

- Market Size (2026)
- USD 1.2 Bn
- Forecast (2036)
- USD 2.0 Bn
- CAGR (2026 to 2036)
- 5.2%
Digital Wound Measurement Devices Market Size, Market Forecast and Outlook By FMI
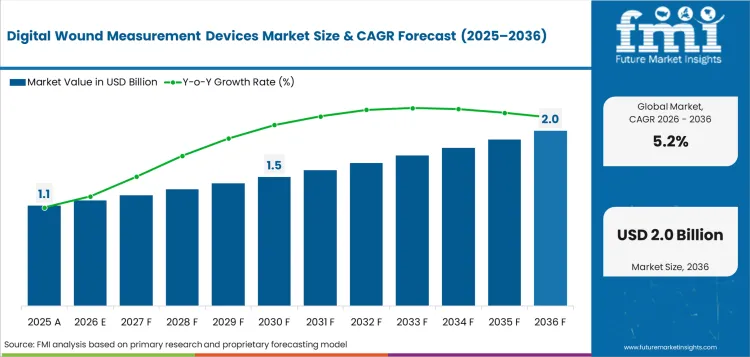
The digital wound measurement devices market was valued at USD 1.1 billion in 2025. The market is set to reach USD 1.2 billion by 2026-end and grow at a CAGR of 5.2% between 2026-2036 to reach USD 2.0 billion by 2036. Diabetic Ulcer will dominate with a 32.0% share, while Hospitals will lead with a 61.0% share.
Summary of the Digital Wound Measurement Devices Market
- Demand and Growth Drivers
- Rising prevalence of chronic conditions and aging populations across developed economies are expanding clinical demand for digital wound measurement devices solutions.
- Regulatory emphasis on patient outcomes and procedural standardization is accelerating institutional procurement of advanced product configurations.
- Reimbursement pathway expansion in key markets is supporting adoption by lowering cost-of-access barriers for hospitals and surgical centers.
- Product and Segment View
- Diabetic Ulcer is likely to remain a leading wound type segment, supported by 32% share of demand from primary end-use applications.
- Hospitals accounts for 61% of end-use sector demand, supported by volume-driven procurement from core application segments.
- Product differentiation across technology tiers and application segments is expected to support margin stability for established participants.
- Geography and Competitive Outlook
- Japan is likely to remain a key market owing to advanced manufacturing capabilities, quality-driven procurement standards, and technology leadership.
- USA is likely to sustain demand on account of strong institutional procurement, regulatory compliance cycles, and aftermarket demand.
- Companies that can combine wound type capabilities and large-scale producer access are likely to gain traction during the forecast period.
- Analyst Opinion
- Nandini Roy Choudhury, Principal Consultant at FMI says, 'Companies that can improve cost competitiveness while delivering consistent performance in diabetic ulcer and hospitals applications are likely to strengthen their position over the forecast period.'
- The digital wound measurement devices market is evolving from a volume-driven category into a more defined market where product performance and compliance determine competitive positioning.
- Adoption is being shaped by structural shifts in end-use procurement rather than cyclical recovery, indicating sustained demand expansion.
- The market is also benefiting from regulatory-driven upgrade cycles that create replacement demand beyond organic growth.
- Demand is further supported by the need for solutions that balance performance, compliance, and long-term cost efficiency.
Key Takeaways, Market Size, and Forecast
- The digital wound measurement devices market was valued at USD 1.13 billion in 2025.
- By 2036, the Digital Wound Measurement Devices Market is expected to be worth USD 1.97 billion.
- From 2026 to 2036, the market is projected to expand at a CAGR of 5.2%.
- The market is projected to create an incremental opportunity of USD 0.78 billion between 2026 and 2036.
- In 2026, Diabetic Ulcer is expected to account for 32% of the Wound Type, driven by increasing clinical adoption and expanding procedural volume across hospital systems.
- Japan (5.6%) and USA (4.8%) are two of the fastest growing markets in the world.
Digital Wound Measurement Devices Market Definition
The digital wound measurement devices market includes all commercially traded products and services classified within this category, covering solutions segmented by wound type, end-use sector, product type, technology, application. The market encompasses both established product configurations and emerging technology variants used across industrial, commercial, and institutional applications.
Digital Wound Measurement Devices Market Inclusions
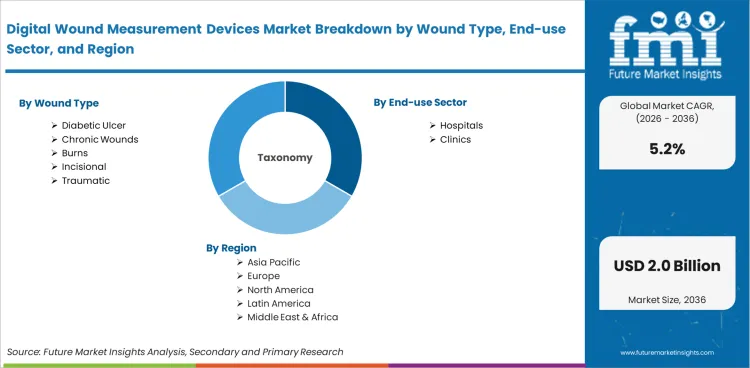
Market scope encompasses all commercially traded products categorized by wound type (Diabetic Ulcer, Chronic Wounds, Burns, Incisional, Traumatic), end-use sector (Hospitals, Clinics), product type (3D Wound Measurement Devices, 2D Digital Measurement Devices, Imaging & Documentation Software, Other), technology (Optical - Camera-Based Measurement Systems, Laser-Based Measurement Systems, Structured Light - 3D Imaging, AI-Based - Software Analytics, Other), application (Wound Assessment & Monitoring, Treatment Planning & Documentation, Clinical Research & Trials, Other). The range of revenue sizes is from 2026 to 2036.
Digital Wound Measurement Devices Market Exclusions
The scope does not include raw or unprocessed materials that are not commercially classified within the defined product taxonomy, components sold as part of unrelated systems where digital wound measurement devices functionality is incidental, or products manufactured exclusively for internal consumption without commercial distribution.
Digital Wound Measurement Devices Market Research Methodology
Primary Research:
FMI analysts conducted interviews with manufacturers, distributors, procurement managers, and technical specialists across key markets to gather primary demand intelligence and validate market dynamics.
Desk Research:
I gathered data from industry groups, regulatory filings, company annual reports and trade publications to build a complete picture of the market.
Market Sizing and Forecasting:
Validated top-down industry benchmarks with bottom-up aggregation of segment-level transaction data across product categories, applications and regions.
Data Validation:
Forecast validated quarterly against global production statistics, trade data and manufacturer disclosures for accuracy.
Why is the Digital Wound Measurement Devices Market Growing?
- Structural demand expansion across primary end-use segments is supporting a 5.2% CAGR through the forecast period, with growth concentrated in wound type applications.
- Japan leads country level growth at 5.6% driven by advanced manufacturing and quality-led procurement supporting its technology leadership.
- Regulatory compliance requirements and performance standardization are driving upgrade cycles, which are pushing replacement demand beyond natural market growth.
The digital wound measurement devices market is projected to grow at a CAGR of 5.2% over the forecast period (2026-2036), owing to structural changes in end-use procurement, regulatory compliance cycles and technology-driven performance requirements. Diabetic Ulcer leads in demand share supported by targeted procurement from major end-use categories where performance and reliability considerations drive specification-based buying.
Procedural evidence is being developed in more indication categories and patient populations, leading to increasing clinical adoption. Increased procurement volumes from hospitals and ambulatory surgical centers are driving down per-procedure costs and improving predictability of outcomes as clinical protocols become standardized around the product category. Access barriers are being lowered with expansion of reimbursement coverage in key markets, and favorable payment pathways are supporting institutional adoption in public and private healthcare settings.
Regulatory approval timelines and compliance requirements remain a structural barrier to entry for new market participants, preserving competitive positioning for established manufacturers with broad product portfolios and multi-market regulatory clearances. Companies that maintain active product development pipelines while managing post-market surveillance and quality compliance are expected to sustain market share through the forecast period.
Market Segmentation Analysis
- Diabetic Ulcer holds 32% of the wound type segment, with wound type used across multiple end-use categories.
- Hospitals are the biggest part of the demand at 61% with procurement concentrated on high-volume application segments.
- Distribution is led by Smith & Nephew plc, indicative of established procurement relationships and contract manufacturing strength.
The digital wound measurement devices market is divided into groups based on wound type, end-use sector, product type, technology, application. By wound type: Diabetic Ulcer, Chronic Wounds, Burns, Incisional. By end-use sector: Hospitals, Clinics. By product type: 3D Wound Measurement Devices, 2D Digital Measurement Devices, Imaging & Documentation Software, Other. By technology: Optical - Camera-Based Measurement Systems, Laser-Based Measurement Systems, Structured Light - 3D Imaging, AI-Based - Software Analytics. By application: Wound Assessment & Monitoring, Treatment Planning & Documentation, Clinical Research & Trials, Other.
Insights into the Diabetic Ulcer Wound Type Segment
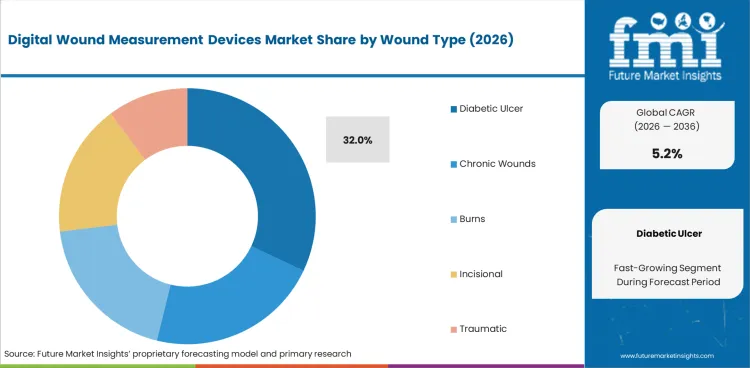
Diabetic Ulcer is expected to hold 32% of the market by 2026. Demand is focused on applications where wound type performance directly drives operational outcomes and compliance positioning. Here, procurement decisions are driven by specification requirements, cost-performance trade-offs, and supplier reliability over multi-year contracting cycles.
Insights into the Hospitals End-use Sector Segment
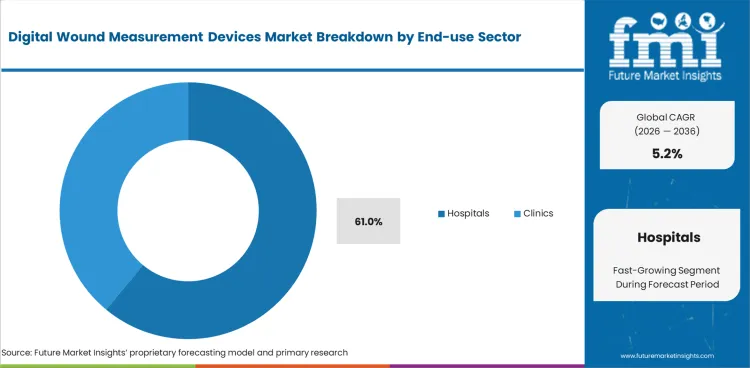
Hospitals segment accounts for 61% of end-use sector. The growth of this category is fueled by the increasing scope of applications as well as rising procurement volumes by institutional and industrial buyers. Product differentiation is driven by performance certification, regulatory compliance, and cost competitiveness across geographic markets.
Digital Wound Measurement Devices Market Drivers, Restraints, and Opportunities
- Regulatory compliance requirements and certification mandates are creating structured demand for digital wound measurement devices products across primary end-use segments.
- Premium and certified products are driving the growth story as advanced configurations are more expensive than their conventional counterparts, restricting their adoption among cost-sensitive segments.
- Technology advancement and expanding application scope are driving incremental demand from previously underserved end-use segments.
The growth of the digital wound measurement devices market is attributed to the regulatory compliance requirements, technology advancement, and growing application scope. Opportunities include compliance-driven procurement, performance upgrades and geographic expansion into high-growth markets, but challenges include cost premiums and scaling.
Regulatory and Compliance Driven Demand
Demand is driven by regulatory requirements for standard product characteristics and performance certification. Regulatory and certification renewal cycles are driving institutional buyers to synchronize their procurement cycles across North America, Europe and East Asia.
Cost Premium and Scalability Constraints
Cost-performance trade-offs inhibit adoption, limiting penetration in price-sensitive segments. Premium product categories can command higher margins where performance specifications justify procurement premiums, with margin compression from competitive intensity and input cost volatility seen in commodity grade applications.
Technology Driven Application Expansion
Growth is a function of technology advancement that expands the scope of addressable applications. Adoption in applications that were served by alternative solutions is creating incremental demand outside of traditional end-use segments, with gains in performance for core product categories.
Supply Chain and Sourcing Dynamics
Procurement is affected by supply chain concentration risks and sourcing reliability factors. Buyers with multi-year procurement requirements are diversifying supplier bases and prioritizing manufacturers with proven production capacity, quality consistency and delivery reliability across geographic markets.
Analysis of Digital Wound Measurement Devices Market By Key Countries
.webp "Top Country Growth Comparison Digital Wound Measurement Devices Market Cagr (2026 2036)")
| Country | CAGR |
|---|---|
| Japan | 5.6% |
| USA | 4.8% |
| Germany | 4.7% |
| China | 3.8% |
| India | 3.4% |
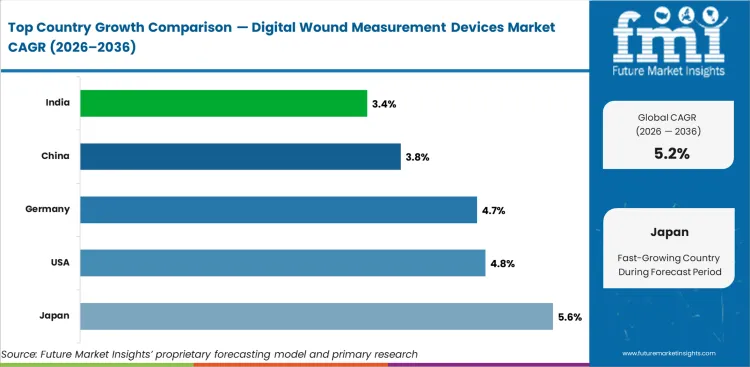
- 5.6% Japan: Advanced manufacturing and quality-driven procurement support technology leadership.
- 4.8% USA by 2024 driven by institutional and aftermarket demand with upgrade cycles driven by regulatory compliance.
- 4.7% Market growth in Germany is underpinned by engineering-led manufacturing and export demand.
- China at 3.8% reflects large-scale industrial capacity and government-backed modernization driving volume expansion.
The global digital wound measurement devices market is expected to grow at a rate of 5.2% per year from 2026 to 2036. The study covers more than 30 countries, and the main markets are listed below.
Demand Outlook for Digital Wound Measurement Devices Market in Japan
Japan is expected to grow at 5.6% through 2036. Advanced manufacturing capabilities and quality-driven procurement standards sustain technology leadership. Demand reflects institutional procurement patterns that prioritize product reliability, performance consistency, and long-term supplier relationships.
- Quality-driven procurement standards sustain premium product demand.
- Advanced manufacturing supports technology leadership and export competitiveness.
- Institutional procurement patterns prioritize long-term supplier relationships.
Future Outlook for Digital Wound Measurement Devices Market in USA
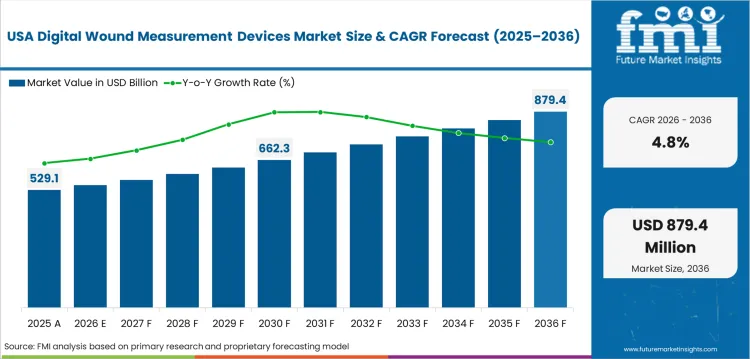
USA is expected to grow at 4.8% through 2036. Demand is supported by regulatory compliance cycles, aftermarket replacement volumes, and institutional procurement from large-scale end-users. Smith & Nephew plc maintains established distribution channels and procurement relationships across the US market.
- Regulatory compliance requirements sustain upgrade and replacement cycles.
- Aftermarket procurement from aging installed base generates recurring demand.
- Institutional buyers prioritize performance certification and supply reliability.
Opportunity Analysis of Digital Wound Measurement Devices Market in Germany
Germany is expected to grow at 4.7% through 2036. Engineering-intensive manufacturing and export demand sustain market growth. Advanced industrial infrastructure and regulatory compliance leadership position Germany as a high-value procurement market.
- Expanding end-use demand supports volume growth.
- Institutional procurement patterns create structured demand.
- Regulatory alignment drives compliance-based purchasing.
In-depth Analysis of Digital Wound Measurement Devices Market in China
China is expected to grow at 3.8% through 2036. Growth reflects expanding industrial capacity, government-backed modernization programs, and rising domestic consumption across primary end-use segments. Production expansion and technology transfer from international manufacturers are supporting quality improvements and cost competitiveness.
- Industrial capacity expansion drives volume-level procurement growth.
- Government modernization programs create structured demand channels.
- Domestic production capabilities are improving cost competitiveness.
Sales Analysis of Digital Wound Measurement Devices Market in India
India is expected to grow at 3.4% through 2036. Market expansion is shaped by infrastructure development programs, institutional procurement growth, and increasing adoption of standardized product specifications across organized industry segments. Government procurement initiatives are creating structured demand channels.
- Infrastructure development programs support institutional procurement.
- Organized industry adoption is expanding the addressable market.
- Government initiatives create procurement channels for standardized products.
Competitive Landscape and Strategic Positioning
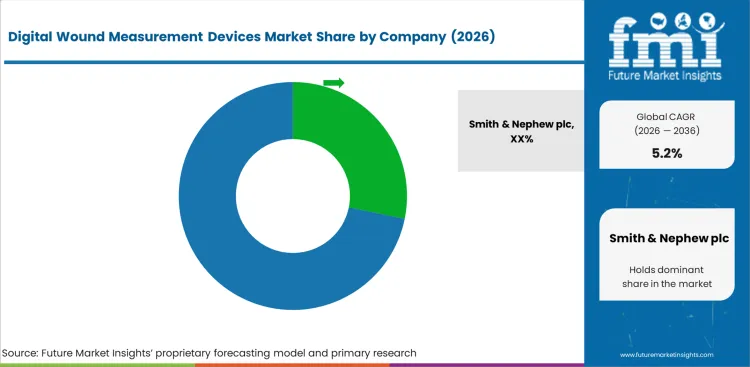
- Smith & Nephew plc is a leader with integrated production capabilities and established procurement relationships across primary end-use segments, with a market share of approximately 28.2%
- The three companies - MolecuLight Inc., WoundVision and ARANZ Medical Ltd. - offer complementary product ranges along the value chain.
- New entrants are targeting niche applications and technology differentiation to carve-out competitive positions in high-growth segments.
Smith & Nephew plc is a leader due to its wide product portfolio coverage, multi-regional manufacturing capabilities and established procurement relationships with institutional buyers. MolecuLight Inc. Competitors are: Complementary product offerings, Regional distribution strength
Market positions of well-known manufacturers such as WoundVision are maintained through technology specialization, local market access and application-specific product development.
Barriers include price sensitivities along the value chain, regulatory approval requirements for new product entries, difficulties in scaling up production, and existing supply chain relationships. Strategic priorities include cost reduction, geographic expansion and partnerships for compliance-driven procurement programs.
Key Companies in the Digital Wound Measurement Devices Market
Key global companies leading the digital wound measurement devices market include:
- Smith & Nephew plc, MolecuLight Inc., WoundVision, ARANZ Medical Ltd., eKare Inc., Kent Imaging Inc., Swift Medical Inc. maintain established market positions through broad product portfolios, multi-regional manufacturing capabilities, and institutional procurement relationships.
- Hitachi Healthcare, Canon Medical Systems, Others have become leaders in their regions by focusing on specialized product development and application-specific technical capabilities.
Competitive Benchmarking: Digital Wound Measurement Devices Market
| Company | Product Breadth | Technology Capability | Distribution Reach | Geographic Footprint |
|---|---|---|---|---|
| Smith & Nephew plc | High | High | Strong | Global |
| MolecuLight Inc. | High | High | Strong | Global |
| WoundVision | High | Medium | Strong | Global |
| ARANZ Medical Ltd. | Medium | Medium | Moderate | Multi-regional |
| eKare Inc. | Medium | Medium | Moderate | Multi-regional |
| Kent Imaging Inc. | Medium | Medium | Moderate | Multi-regional |
| Swift Medical Inc. | Low | Medium | Low | Regional |
| Hitachi Healthcare | Low | Medium | Low | Regional |
| Canon Medical Systems | Low | Medium | Low | Regional |
| Others | Low | Medium | Low | Regional |
Source: Future Market Insights competitive analysis, 2026.
Key Developments in Digital Wound Measurement Devices Market
- In 2025, Smith & Nephew plc continued to strengthen its advanced wound management portfolio (including digital and imaging-supported solutions) through launches such as ALLEVYN COMPLETE CARE foam dressing and RENASYS EDGE negative pressure wound therapy system, while integrating AI and digital tools for better wound assessment and healing.
- In 2025, MolecuLight Inc. advanced its leadership in digital wound imaging with the MolecuLightDX platform, adding new features like Thermal Imaging (April 2025) and securing $27.5 million in funding (January 2025) to accelerate commercialization, expand its footprint, and enhance point-of-care bacterial detection + wound measurement capabilities.
Key Players in the Digital Wound Measurement Devices Market
Major Global Players
- Smith & Nephew plc
- MolecuLight Inc.
- WoundVision
- ARANZ Medical Ltd.
- eKare Inc.
- Kent Imaging Inc.
- Swift Medical Inc.
Emerging Players/Startups
- Hitachi Healthcare
- Canon Medical Systems
- Others
Report Scope and Coverage
| Parameter | Details |
|---|---|
| Quantitative Units | USD 1.19 billion to USD 1.97 billion, at a CAGR of 5.2% |
| Market Definition | The digital wound measurement devices market encompasses wound type, end-use sector, product type, technology, application segmentation across commercial and institutional applications. |
| Regions Covered | North America, Latin America, Europe, East Asia, South Asia and Pacific, Middle East and Africa |
| Countries Covered | Japan, USA, Germany, China, India, 30 plus countries |
| Key Companies Profiled | Smith & Nephew plc, MolecuLight Inc., WoundVision, ARANZ Medical Ltd., eKare Inc., Kent Imaging Inc., Swift Medical Inc., Hitachi Healthcare, Canon Medical Systems, Others |
| Forecast Period | 2026 to 2036 |
| Approach | Hybrid bottom-up and top-down methodology starting with verified transaction data, projecting adoption velocity across segments and regions. |
Market Segmentation Analysis
Digital Wound Measurement Devices Market Segmented by Wound Type:
- Diabetic Ulcer
- Chronic Wounds
- Burns
- Incisional
- Traumatic
Digital Wound Measurement Devices Market Segmented by End-use Sector:
- Hospitals
- Clinics
Digital Wound Measurement Devices Market Segmented by Product Type:
- 3D Wound Measurement Devices
- 2D Digital Measurement Devices
- Imaging & Documentation Software
- Other
Digital Wound Measurement Devices Market Segmented by Technology:
- Optical - Camera-Based Measurement Systems
- Laser-Based Measurement Systems
- Structured Light - 3D Imaging
- AI-Based - Software Analytics
- Other
Digital Wound Measurement Devices Market Segmented by Application:
- Wound Assessment & Monitoring
- Treatment Planning & Documentation
- Clinical Research & Trials
- Other
Digital Wound Measurement Devices Market by Region:
- North America
- USA
- Canada
- Mexico
- Latin America
- Brazil
- Chile
- Rest of Latin America
- Western Europe
- Germany
- UK
- Italy
- Spain
- France
- Nordic
- BENELUX
- Rest of Western Europe
- Eastern Europe
- Russia
- Poland
- Hungary
- Balkan & Baltic
- Rest of Eastern Europe
- East Asia
- China
- Japan
- South Korea
- South Asia and Pacific
- India
- ASEAN
- Australia & New Zealand
- Rest of South Asia and Pacific
- Middle East & Africa
- Kingdom of Saudi Arabia
- Other GCC Countries
- Turkiye
- South Africa
- Other African Union
- Rest of Middle East & Africa
Research Sources and Bibliography
- 1. World Health Organization. (2025). WHO Global Health Expenditure Database. WHO.
- 2. USA Food and Drug Administration. (2025). FDA Medical Device Approvals and Clearances Database. FDA.
- 3. European Medicines Agency. (2024). EMA Regulatory Guidance and Medical Device Standards. EMA.
- 4. Centers for Disease Control and Prevention. (2025). CDC Health Statistics and Surveillance Reports. CDC.
- 5. Organisation for Economic Co-operation and Development. (2025). OECD Health Statistics Database. OECD.
This bibliography is provided for reader reference.
This Report Answers
- Estimating the size of the market and revenue projections from 2026 to 2036.
- Segmentation by wound type, end-use sector, product type, technology, application.
- Insights about more than 30 markets in the region.
- Analysis of technology that includes core product categories and emerging configurations.
- Assessment of the competitive landscape.
- Finding investment opportunities in high-growth segments and regions.
- Keeping track of the supply chain.
- Delivery of data in PDF and Excel formats.
Frequently Asked Questions
What is the global market demand for Digital Wound Measurement Devices Market in 2026?
In 2026, the global digital wound measurement devices market is expected to be worth USD 1.19 billion.
How big will the market for Digital Wound Measurement Devices Market be in 2036?
By 2036, the market for digital wound measurement devices market is expected to be worth USD 1.97 billion.
How much do you think demand for Digital Wound Measurement Devices Market will grow between 2026 and 2036?
Between 2026 and 2036, the demand for digital wound measurement devices market is expected to grow at a CAGR of 5.2%.
Which Wound Type is likely to be the best seller in the Digital Wound Measurement Devices Market by 2026?
Diabetic Ulcer will make up 32% of the market in 2026. This shows that diabetic ulcer is the primary demand category due to increasing clinical adoption and expanding procedural volume across hospital systems.
What is causing demand to rise in Japan in the Digital Wound Measurement Devices Market?
Japan is expected to grow at a rate of 5.6% per year through 2036, thanks to advanced manufacturing and quality-driven procurement sustaining technology leadership.
What is causing demand to rise in USA in the Digital Wound Measurement Devices Market?
USA is expected to grow at a rate of 4.8% per year through 2036, thanks to institutional and aftermarket demand with regulatory compliance driving upgrade cycles.
What does this report mean by 'Digital Wound Measurement Devices Market definition'?
The digital wound measurement devices market includes products and services classified by wound type, end-use sector, product type, technology, application, spanning the 2026 to 2036 forecast period.
How does FMI make the Digital Wound Measurement Devices Market forecast and check it?
Forecasting models use a hybrid bottom-up and top-down approach, starting with verified transaction data and checking it against global production statistics and manufacturer disclosures.
Preview the report firsthand - request a free sample
Get SampleGet the brochure for pricing and purchase details.
Get PDFTable of Content
- Executive Summary
- Global Market Outlook
- Demand-side Trends
- Supply-side Trends
- Technology Roadmap Analysis
- Analysis and Recommendations
- Market Overview
- Market Coverage / Taxonomy
- Market Definition / Scope / Limitations
- Research Methodology
- Chapter Orientation
- Analytical Lens and Working Hypotheses
- Market Structure, Signals, and Trend Drivers
- Benchmarking and Cross-market Comparability
- Market Sizing, Forecasting, and Opportunity Mapping
- Research Design and Evidence Framework
- Desk Research Programme (Secondary Evidence)
- Company Annual and Sustainability Reports
- Peer-reviewed Journals and Academic Literature
- Corporate Websites, Product Literature, and Technical Notes
- Earnings Decks and Investor Briefings
- Statutory Filings and Regulatory Disclosures
- Technical White Papers and Standards Notes
- Trade Journals, Industry Magazines, and Analyst Briefs
- Conference Proceedings, Webinars, and Seminar Materials
- Government Statistics Portals and Public Data Releases
- Press Releases and Reputable Media Coverage
- Specialist Newsletters and Curated Briefings
- Sector Databases and Reference Repositories
- FMI Internal Proprietary Databases and Historical Market Datasets
- Subscription Datasets and Paid Sources
- Social Channels, Communities, and Digital Listening Inputs
- Additional Desk Sources
- Expert Input and Fieldwork (Primary Evidence)
- Primary Modes
- Qualitative Interviews and Expert Elicitation
- Quantitative Surveys and Structured Data Capture
- Blended Approach
- Why Primary Evidence is Used
- Field Techniques
- Interviews
- Surveys
- Focus Groups
- Observational and In-context Research
- Social and Community Interactions
- Stakeholder Universe Engaged
- C-suite Leaders
- Board Members
- Presidents and Vice Presidents
- R&D and Innovation Heads
- Technical Specialists
- Domain Subject-matter Experts
- Scientists
- Physicians and Other Healthcare Professionals
- Governance, Ethics, and Data Stewardship
- Research Ethics
- Data Integrity and Handling
- Primary Modes
- Tooling, Models, and Reference Databases
- Desk Research Programme (Secondary Evidence)
- Data Engineering and Model Build
- Data Acquisition and Ingestion
- Cleaning, Normalisation, and Verification
- Synthesis, Triangulation, and Analysis
- Quality Assurance and Audit Trail
- Market Background
- Market Dynamics
- Drivers
- Restraints
- Opportunity
- Trends
- Scenario Forecast
- Demand in Optimistic Scenario
- Demand in Likely Scenario
- Demand in Conservative Scenario
- Opportunity Map Analysis
- Product Life Cycle Analysis
- Supply Chain Analysis
- Investment Feasibility Matrix
- Value Chain Analysis
- PESTLE and Porter’s Analysis
- Regulatory Landscape
- Regional Parent Market Outlook
- Production and Consumption Statistics
- Import and Export Statistics
- Market Dynamics
- Global Market Analysis 2021 to 2025 and Forecast, 2026 to 2036
- Historical Market Size Value (USD Million) Analysis, 2021 to 2025
- Current and Future Market Size Value (USD Million) Projections, 2026 to 2036
- Y-o-Y Growth Trend Analysis
- Absolute $ Opportunity Analysis
- Global Market Pricing Analysis 2021 to 2025 and Forecast 2026 to 2036
- Global Market Analysis 2021 to 2025 and Forecast 2026 to 2036, By Wound Type
- Introduction / Key Findings
- Historical Market Size Value (USD Million) Analysis By Wound Type , 2021 to 2025
- Current and Future Market Size Value (USD Million) Analysis and Forecast By Wound Type , 2026 to 2036
- Diabetic Ulcer
- Chronic Wounds
- Burns
- Incisional
- Traumatic
- Diabetic Ulcer
- Y-o-Y Growth Trend Analysis By Wound Type , 2021 to 2025
- Absolute $ Opportunity Analysis By Wound Type , 2026 to 2036
- Global Market Analysis 2021 to 2025 and Forecast 2026 to 2036, By End-use Sector
- Introduction / Key Findings
- Historical Market Size Value (USD Million) Analysis By End-use Sector, 2021 to 2025
- Current and Future Market Size Value (USD Million) Analysis and Forecast By End-use Sector, 2026 to 2036
- Hospitals
- Clinics
- Hospitals
- Y-o-Y Growth Trend Analysis By End-use Sector, 2021 to 2025
- Absolute $ Opportunity Analysis By End-use Sector, 2026 to 2036
- Global Market Analysis 2021 to 2025 and Forecast 2026 to 2036, By Product Type
- Introduction / Key Findings
- Historical Market Size Value (USD Million) Analysis By Product Type, 2021 to 2025
- Current and Future Market Size Value (USD Million) Analysis and Forecast By Product Type, 2026 to 2036
- 3D Wound Measurement Devices
- 2D Digital Measurement Devices
- Imaging & Documentation Software
- Other
- 3D Wound Measurement Devices
- Y-o-Y Growth Trend Analysis By Product Type, 2021 to 2025
- Absolute $ Opportunity Analysis By Product Type, 2026 to 2036
- Global Market Analysis 2021 to 2025 and Forecast 2026 to 2036, By Technology
- Introduction / Key Findings
- Historical Market Size Value (USD Million) Analysis By Technology, 2021 to 2025
- Current and Future Market Size Value (USD Million) Analysis and Forecast By Technology, 2026 to 2036
- Optical - Camera-Based Measurement Systems
- Laser-Based Measurement Systems
- Structured Light - 3D Imaging
- AI-Based - Software Analytics
- Other
- Optical - Camera-Based Measurement Systems
- Y-o-Y Growth Trend Analysis By Technology, 2021 to 2025
- Absolute $ Opportunity Analysis By Technology, 2026 to 2036
- Global Market Analysis 2021 to 2025 and Forecast 2026 to 2036, By Application
- Introduction / Key Findings
- Historical Market Size Value (USD Million) Analysis By Application, 2021 to 2025
- Current and Future Market Size Value (USD Million) Analysis and Forecast By Application, 2026 to 2036
- Wound Assessment & Monitoring
- Treatment Planning & Documentation
- Clinical Research & Trials
- Other
- Wound Assessment & Monitoring
- Y-o-Y Growth Trend Analysis By Application, 2021 to 2025
- Absolute $ Opportunity Analysis By Application, 2026 to 2036
- Global Market Analysis 2021 to 2025 and Forecast 2026 to 2036, By Region
- Introduction
- Historical Market Size Value (USD Million) Analysis By Region, 2021 to 2025
- Current Market Size Value (USD Million) Analysis and Forecast By Region, 2026 to 2036
- North America
- Latin America
- Western Europe
- Eastern Europe
- East Asia
- South Asia and Pacific
- Middle East & Africa
- Market Attractiveness Analysis By Region
- North America Market Analysis 2021 to 2025 and Forecast 2026 to 2036, By Country
- Historical Market Size Value (USD Million) Trend Analysis By Market Taxonomy, 2021 to 2025
- Market Size Value (USD Million) Forecast By Market Taxonomy, 2026 to 2036
- By Country
- USA
- Canada
- Mexico
- By Wound Type
- By End-use Sector
- By Product Type
- By Technology
- By Application
- By Country
- Market Attractiveness Analysis
- By Country
- By Wound Type
- By End-use Sector
- By Product Type
- By Technology
- By Application
- Key Takeaways
- Latin America Market Analysis 2021 to 2025 and Forecast 2026 to 2036, By Country
- Historical Market Size Value (USD Million) Trend Analysis By Market Taxonomy, 2021 to 2025
- Market Size Value (USD Million) Forecast By Market Taxonomy, 2026 to 2036
- By Country
- Brazil
- Chile
- Rest of Latin America
- By Wound Type
- By End-use Sector
- By Product Type
- By Technology
- By Application
- By Country
- Market Attractiveness Analysis
- By Country
- By Wound Type
- By End-use Sector
- By Product Type
- By Technology
- By Application
- Key Takeaways
- Western Europe Market Analysis 2021 to 2025 and Forecast 2026 to 2036, By Country
- Historical Market Size Value (USD Million) Trend Analysis By Market Taxonomy, 2021 to 2025
- Market Size Value (USD Million) Forecast By Market Taxonomy, 2026 to 2036
- By Country
- Germany
- UK
- Italy
- Spain
- France
- Nordic
- BENELUX
- Rest of Western Europe
- By Wound Type
- By End-use Sector
- By Product Type
- By Technology
- By Application
- By Country
- Market Attractiveness Analysis
- By Country
- By Wound Type
- By End-use Sector
- By Product Type
- By Technology
- By Application
- Key Takeaways
- Eastern Europe Market Analysis 2021 to 2025 and Forecast 2026 to 2036, By Country
- Historical Market Size Value (USD Million) Trend Analysis By Market Taxonomy, 2021 to 2025
- Market Size Value (USD Million) Forecast By Market Taxonomy, 2026 to 2036
- By Country
- Russia
- Poland
- Hungary
- Balkan & Baltic
- Rest of Eastern Europe
- By Wound Type
- By End-use Sector
- By Product Type
- By Technology
- By Application
- By Country
- Market Attractiveness Analysis
- By Country
- By Wound Type
- By End-use Sector
- By Product Type
- By Technology
- By Application
- Key Takeaways
- East Asia Market Analysis 2021 to 2025 and Forecast 2026 to 2036, By Country
- Historical Market Size Value (USD Million) Trend Analysis By Market Taxonomy, 2021 to 2025
- Market Size Value (USD Million) Forecast By Market Taxonomy, 2026 to 2036
- By Country
- China
- Japan
- South Korea
- By Wound Type
- By End-use Sector
- By Product Type
- By Technology
- By Application
- By Country
- Market Attractiveness Analysis
- By Country
- By Wound Type
- By End-use Sector
- By Product Type
- By Technology
- By Application
- Key Takeaways
- South Asia and Pacific Market Analysis 2021 to 2025 and Forecast 2026 to 2036, By Country
- Historical Market Size Value (USD Million) Trend Analysis By Market Taxonomy, 2021 to 2025
- Market Size Value (USD Million) Forecast By Market Taxonomy, 2026 to 2036
- By Country
- India
- ASEAN
- Australia & New Zealand
- Rest of South Asia and Pacific
- By Wound Type
- By End-use Sector
- By Product Type
- By Technology
- By Application
- By Country
- Market Attractiveness Analysis
- By Country
- By Wound Type
- By End-use Sector
- By Product Type
- By Technology
- By Application
- Key Takeaways
- Middle East & Africa Market Analysis 2021 to 2025 and Forecast 2026 to 2036, By Country
- Historical Market Size Value (USD Million) Trend Analysis By Market Taxonomy, 2021 to 2025
- Market Size Value (USD Million) Forecast By Market Taxonomy, 2026 to 2036
- By Country
- Kingdom of Saudi Arabia
- Other GCC Countries
- Turkiye
- South Africa
- Other African Union
- Rest of Middle East & Africa
- By Wound Type
- By End-use Sector
- By Product Type
- By Technology
- By Application
- By Country
- Market Attractiveness Analysis
- By Country
- By Wound Type
- By End-use Sector
- By Product Type
- By Technology
- By Application
- Key Takeaways
- Key Countries Market Analysis
- USA
- Pricing Analysis
- Market Share Analysis, 2025
- By Wound Type
- By End-use Sector
- By Product Type
- By Technology
- By Application
- Canada
- Pricing Analysis
- Market Share Analysis, 2025
- By Wound Type
- By End-use Sector
- By Product Type
- By Technology
- By Application
- Mexico
- Pricing Analysis
- Market Share Analysis, 2025
- By Wound Type
- By End-use Sector
- By Product Type
- By Technology
- By Application
- Brazil
- Pricing Analysis
- Market Share Analysis, 2025
- By Wound Type
- By End-use Sector
- By Product Type
- By Technology
- By Application
- Chile
- Pricing Analysis
- Market Share Analysis, 2025
- By Wound Type
- By End-use Sector
- By Product Type
- By Technology
- By Application
- Germany
- Pricing Analysis
- Market Share Analysis, 2025
- By Wound Type
- By End-use Sector
- By Product Type
- By Technology
- By Application
- UK
- Pricing Analysis
- Market Share Analysis, 2025
- By Wound Type
- By End-use Sector
- By Product Type
- By Technology
- By Application
- Italy
- Pricing Analysis
- Market Share Analysis, 2025
- By Wound Type
- By End-use Sector
- By Product Type
- By Technology
- By Application
- Spain
- Pricing Analysis
- Market Share Analysis, 2025
- By Wound Type
- By End-use Sector
- By Product Type
- By Technology
- By Application
- France
- Pricing Analysis
- Market Share Analysis, 2025
- By Wound Type
- By End-use Sector
- By Product Type
- By Technology
- By Application
- India
- Pricing Analysis
- Market Share Analysis, 2025
- By Wound Type
- By End-use Sector
- By Product Type
- By Technology
- By Application
- ASEAN
- Pricing Analysis
- Market Share Analysis, 2025
- By Wound Type
- By End-use Sector
- By Product Type
- By Technology
- By Application
- Australia & New Zealand
- Pricing Analysis
- Market Share Analysis, 2025
- By Wound Type
- By End-use Sector
- By Product Type
- By Technology
- By Application
- China
- Pricing Analysis
- Market Share Analysis, 2025
- By Wound Type
- By End-use Sector
- By Product Type
- By Technology
- By Application
- Japan
- Pricing Analysis
- Market Share Analysis, 2025
- By Wound Type
- By End-use Sector
- By Product Type
- By Technology
- By Application
- South Korea
- Pricing Analysis
- Market Share Analysis, 2025
- By Wound Type
- By End-use Sector
- By Product Type
- By Technology
- By Application
- Russia
- Pricing Analysis
- Market Share Analysis, 2025
- By Wound Type
- By End-use Sector
- By Product Type
- By Technology
- By Application
- Poland
- Pricing Analysis
- Market Share Analysis, 2025
- By Wound Type
- By End-use Sector
- By Product Type
- By Technology
- By Application
- Hungary
- Pricing Analysis
- Market Share Analysis, 2025
- By Wound Type
- By End-use Sector
- By Product Type
- By Technology
- By Application
- Kingdom of Saudi Arabia
- Pricing Analysis
- Market Share Analysis, 2025
- By Wound Type
- By End-use Sector
- By Product Type
- By Technology
- By Application
- Turkiye
- Pricing Analysis
- Market Share Analysis, 2025
- By Wound Type
- By End-use Sector
- By Product Type
- By Technology
- By Application
- South Africa
- Pricing Analysis
- Market Share Analysis, 2025
- By Wound Type
- By End-use Sector
- By Product Type
- By Technology
- By Application
- USA
- Market Structure Analysis
- Competition Dashboard
- Competition Benchmarking
- Market Share Analysis of Top Players
- By Regional
- By Wound Type
- By End-use Sector
- By Product Type
- By Technology
- By Application
- Competition Analysis
- Competition Deep Dive
- Smith & Nephew plc
- Overview
- Product Portfolio
- Profitability by Market Segments (Product/Age /Sales Channel/Region)
- Sales Footprint
- Strategy Overview
- Marketing Strategy
- Product Strategy
- Channel Strategy
- MolecuLight Inc.
- WoundVision
- ARANZ Medical Ltd.
- eKare Inc.
- Kent Imaging Inc.
- Swift Medical Inc.
- Hitachi Healthcare
- Canon Medical Systems
- Others
- Smith & Nephew plc
- Competition Deep Dive
- Assumptions & Acronyms Used


