Draining Cellulite Treatments Market Size and Share Forecast Outlook 2025 to 2035

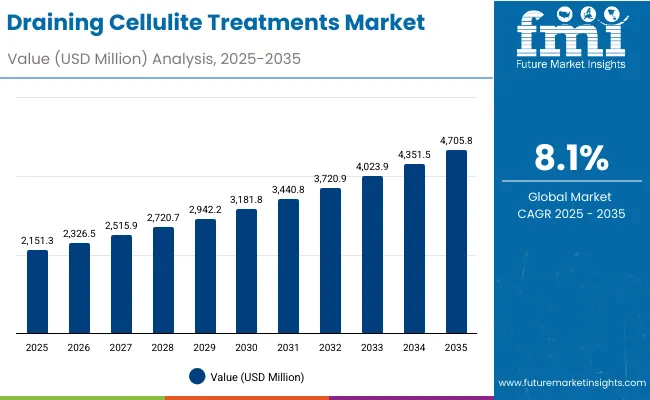
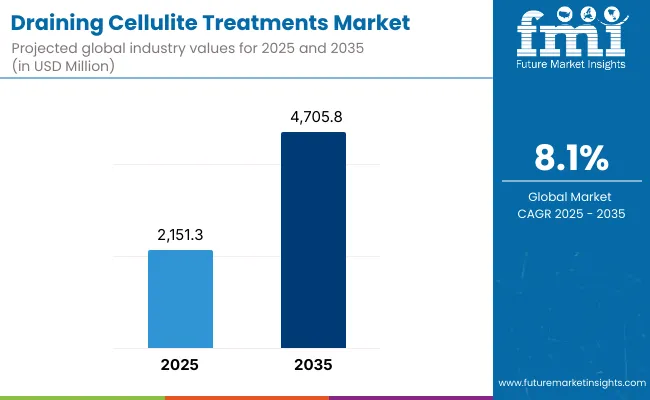
The Draining Cellulite Treatments Market is expected to record a valuation of USD 2,151.3 million in 2025 and USD 4,705.8 million in 2035, with an increase of USD 2,554.5 million, which equals a growth of 193% over the decade. The overall expansion represents a CAGR of 8.1% and a 2.2X increase in market size.
Draining Cellulite Treatments Market 1

Quick Stats for Draining Cellulite Treatments Market

  • Draining Cellulite Treatments Market Value (2025):USD 2,151.3 million
  • Draining Cellulite Treatments Market Forecast Value (2035):USD 4,705.8 million
  • Draining Cellulite Treatments Market Forecast CAGR:8.1%
  • Leading Segment in Draining Cellulite Treatments Market in 2025:Serum Concentrates (largest value contributor)
  • Key Growth Regions in the Draining Cellulite Treatments Market:Asia-Pacific, North America, Europe
  • Top Key Players in Draining Cellulite Treatments Market:Clarins, Nuxe, Vichy, Somatoline, Elancyl, Shiseido, Biotherm, Weleda, Body Shop, Collistar

Draining Cellulite Treatments Market

Draining Cellulite Treatments Market Key Takeaways

Metric Value
Estimated Market Value (2025E) USD 2,151.3 million
Forecast Market Value (2035F) USD 4,705.8 million
Forecast CAGR (2025 to 2035) 8.1%

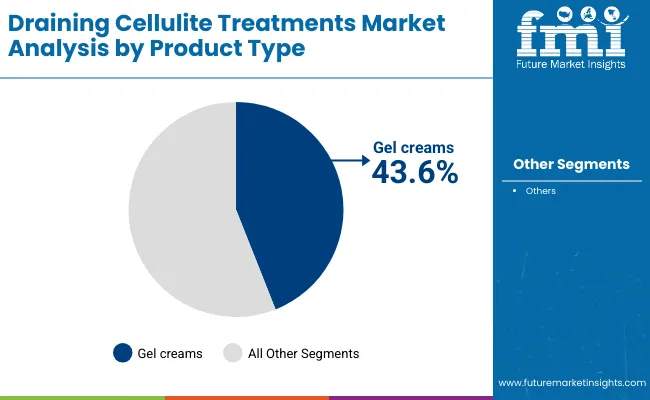
During the first five-year period from 2025 to 2030, the market increases from USD 2,151.3 million to USD 3,181.8 million, adding USD 1,030.5 million, which accounts for 40% of the total decade growth. This phase records steady adoption across daily home-care regimens and e-commerce channels, driven by consumer preference for at-home cellulite reduction and improved accessibility of firming gel creams. Gel creams dominate this period as they capture over 43% of product sales in 2025, supported by caffeine and L-carnitine complex formulations that enhance drainage and skin tonicity.

The second half from 2030 to 2035 contributes USD 1,524.0 million, equal to 60% of total growth, as the market jumps from USD 3,181.8 million to USD 4,705.8 million. This acceleration is powered by growing integration of biotech firming peptides, AI-assisted skincare tools, and expansion of spa and salon treatments that merge therapeutic and cosmetic benefits. E-commerce continues to expand while pharmacy and specialty beauty retail channels grow in tandem, with Asia-Pacific emerging as the leading growth regiondriven by China (CAGR 13.7%) and India (CAGR 15.4%).

From 2020 to 2024, the Draining Cellulite Treatments Market grew steadily, led by hardware-equivalent topical innovations emphasizing formulation delivery and precision in actives. During this period, the competitive landscape was dominated by European skincare manufacturers, collectively controlling nearly 90% of revenue, with leaders such as Clarins, Vichy, and Somatoline focusing on botanical vasotonics and L-carnitine-enriched compositions. Competitive differentiation relied on clinical validation, visible toning results, and consumer trust, while biotech-based firming blends began emerging as high-value add-ons in premium lines. Service-based professional treatments contributed less than 10% of total market value.

Demand for Draining Cellulite Treatments will expand to USD 2,151.3 million in 2025, and the revenue mix will shift as professional spa adjunct treatments and biotech formulations grow to over 30% share. Traditional topical brands face rising competition from digital skincare ecosystems offering smart application tracking, AI-based body contouring assessments, and data-driven formulation customization. Major brands are pivoting to hybrid models, integrating home-use and professional regimens to maintain engagement. Emerging entrants specializing in bio-active peptides, AR-based skincare analysis, and sustainable packaging are gaining traction. The competitive advantage is moving from traditional cosmetic innovation to holistic consumer experience, personalization, and efficacy-backed differentiation.

Why the Draining Cellulite Treatments Market is growing?

Advancements in bioactive ingredient formulation, delivery technologies, and consumer personalization are driving the growth of the Draining Cellulite Treatments Market. Modern draining products integrate caffeine and xanthine complexes that enhance microcirculation, improve lymphatic drainage, and visibly reduce dimpled skin texture. The evolution of L-carnitine complexes and botanical vasotonics such as horse chestnut extract has further accelerated the market, as brands focus on synergistic blends targeting cellulite at both the surface and structural levels. The rise of biotech-derived firming peptides has also improved efficacy, stimulating collagen synthesis and promoting smoother skin.

The market is also benefiting from the growing adoption of at-home daily care routines, driven by busy lifestyles, wellness awareness, and accessibility through e-commerce and pharmacy channels. These products are now positioned as preventive and maintenance treatments rather than corrective-only solutions, encouraging consistent consumer engagement. Gel creams and serum concentrates dominate product innovation due to their fast absorption, non-greasy texture, and ability to deliver concentrated actives effectively. Increasing awareness of body confidence, social media influence, and seasonal product launches (especially pre-summer) continue to fuel product uptake among women and fitness-conscious consumers.

Segmental Analysis

The Draining Cellulite Treatments Market is segmented by product type, key actives, usage mode, channel, end user, and geography. Product types include gel creams, serum concentrates, massage oils, and cryo/thermo roll-ons, with serum concentrates leading due to their high concentration of active ingredients and fast absorption. By key actives, the market covers caffeine and xanthines, L-carnitine complexes, botanical vasotonics such as horse chestnut, and peptide or biotech firming blends, reflecting the growing focus on clinically validated formulations that enhance lymphatic drainage and improve skin firmness. Based on usage mode, the market is categorized into daily home-care, intensive 4–8 week regimens, and professional spa adjuncts, with daily home-care treatments dominating as consumers prioritize convenience and affordability. By channel, the segmentation includes e-commerce, pharmacies and drugstores, specialty beauty retail, and spas and salons, with online platforms capturing the largest share in 2025 due to the rise of direct-to-consumer beauty brands. In terms of end user, key segments include women, post-partum mothers, and fitness-focused consumers, representing the core demographics seeking body-sculpting and firming solutions. Geographically, the market covers North America, Europe, East Asia, South Asia & Pacific, Latin America, and the Middle East & Africa, with Asia Pacific emerging as the fastest-growing region led by China and India.
Insights into the Product Type Segment with Serum Concentrates Leading in Market Share

Draining Cellulite Treatments Market By Product Type

Product Type Value Share % 2025
Gel creams 43.6%
Others 56.4%

The serum concentrates segment is projected to contribute the largest share of the Draining Cellulite Treatments Market revenue in 2025, maintaining its lead as the dominant product category. This growth is driven by rising consumer demand for fast-absorbing, high-performance formulations that deliver visible results in body firming and lymphatic drainage. Serum concentrates often combine L-carnitine complexes, caffeine, and botanical vasotonics, making them highly effective for targeted treatment of cellulite-prone areas.

The increasing preference for lightweight textures and non-sticky finishes, especially among urban consumers, continues to strengthen this segment’s leadership. The category is further supported by innovations in airless packaging, roller-tip applicators, and smart dosage systems that enhance both hygiene and efficacy, solidifying its role as the backbone of the Draining Cellulite Treatments portfolio.
Insights into the Active Ingredient Segment with Caffeine & Xanthines Dominating the Demand

Draining Cellulite Treatments Market By Key Actives

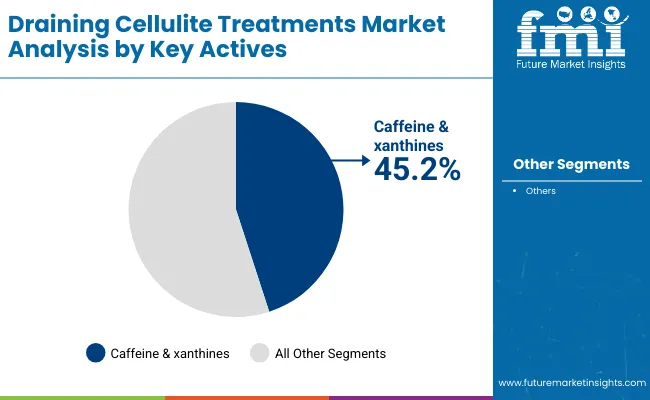
Key Actives Value Share % 2025
Caffeine & xanthines 45.2%
Others 54.8%

The caffeine and xanthine complex segment is forecasted to hold the largest share of the market in 2025, leading due to its well-documented ability to stimulate microcirculation, boost lipolysis, and improve skin texture. These active ingredients are widely recognized for enhancing lymphatic drainage and reducing localized water retention, key concerns in cellulite formation. The segment’s growth is further supported by expanding clinical validation and inclusion in both mass-market and premium skincare lines.

Formulators are increasingly combining caffeine with synergistic actives such as theophylline, guarana extract, and green coffee derivatives to improve efficacy and consumer perception. As clean-label and plant-derived formulations gain momentum, caffeine-based blends continue to dominate, offering a proven balance of safety, performance, and sensory appeal.
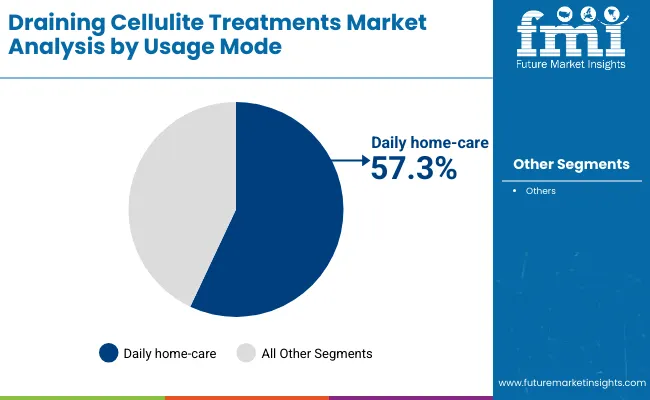
Insights into the Usage Mode Segment with Daily Home-care Leading in Adoption

Draining Cellulite Treatments Market By Usage Mode

Usage Mode Value Share % 2025
Daily home-care 57.3%
Others 42.7%

The daily home-care segment is projected to account for the majority of Draining Cellulite Treatments Market revenue in 2025, establishing itself as the leading usage mode. This dominance stems from consumers’ increasing preference for self-administered, easy-to-use routines supported by visible results and affordability. Daily-use formulationsprimarily gel creams and serumsare integrated into morning and evening skincare regimens, promoting consistent usage and long-term maintenance.

The segment benefits from the convenience of e-commerce accessibility, subscription models, and social media-driven education campaigns that emphasize self-care and confidence. Furthermore, at-home products now incorporate roller applicators, cryo-cooling effects, and thermal actives, bridging the gap between professional spa results and home convenience. With continuous innovation and brand investment in this category, daily home-care is expected to sustain its leadership throughout the forecast period.

What are the Drivers, Restraints, and Key Trends of the Draining Cellulite Treatments Market?

Rising Consumer Focus on Body Aesthetics and Wellness

Growing consumer emphasis on body contouring, skin toning, and visible beauty enhancement is a major driver of the Draining Cellulite Treatments Market. Increased social media influence and fitness awareness have shifted perceptions of cellulite management from a luxury treatment to an everyday self-care necessity. Demand is particularly strong among post-partum mothers and fitness-focused consumers seeking convenient, non-invasive solutions. With expanding product availability in pharmacies and online platforms, and visible results promised by caffeine and L-carnitine-based actives, body-firming skincare is becoming integral to holistic wellness routines worldwide.

Advancements in Active Ingredient Formulation and Delivery Systems

The market is propelled by innovations in biotech peptides, plant-based vasotonics, and transdermal delivery systems that improve penetration and efficacy of anti-cellulite formulations. Modern gel creams and serums use microencapsulation and liposomal technologies to deliver actives like caffeine, carnitine, and horse chestnut more effectively. Brands are integrating clinical validation, sensory appeal, and sustainability into product design, enhancing consumer confidence and repeat purchase rates. These technological improvements have positioned draining cellulite treatments as high-performance skincare solutions that deliver visible results faster while maintaining a clean, non-irritating formulation profile.

Limited Clinical Validation and Perceived Inconsistency in Results

A key restraint in the Draining Cellulite Treatments Market is the lack of standardized clinical evidence supporting long-term efficacy. Many consumers remain skeptical about the effectiveness of topical treatments versus professional or medical procedures. Variations in body type, lifestyle, and treatment consistency can lead to differing outcomes, reducing satisfaction and brand loyalty. Additionally, claims of “visible results in weeks” often face scrutiny, especially in mature markets with strict advertising guidelines. The absence of universally accepted testing protocols and measurable benchmarks continues to hinder premium pricing and large-scale adoption among discerning consumer groups.

Integration of Smart Skincare and Hybrid Spa-Home Solutions

A leading trend shaping the market is the fusion of digital skincare technologies with traditional cosmetic treatments. Smart massagers, app-linked body analyzers, and AI-guided routines are increasingly being paired with cellulite gels and serums to enhance treatment precision and tracking. Consumers prefer hybrid solutions that combine home-use convenience with professional-grade results, blurring the line between wellness and aesthetics. This trend is supported by premium brands collaborating with spas and dermatology clinics to offer connected regimens. The evolution of tech-assisted, personalized body care represents a new era of innovation driving consumer engagement and product differentiation.
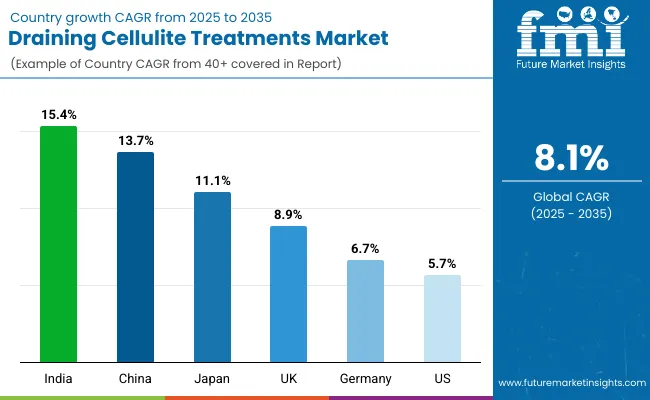
Analysis of Draining Cellulite Treatments Market By Key Countries

Country Wise Draining Cellulite Treatments Market

Country Estimated CAGR (2025 to 2035)
China 13.7%
USA 5.7%
India 15.4%
UK 8.9%
Germany 6.7%
Japan 11.1%

The global Draining Cellulite Treatments Market demonstrates notable regional variation in growth patterns, shaped by differences in consumer behavior, beauty culture, and retail infrastructure.

Asia-Pacific is emerging as the fastest-growing region, led by India (15.4% CAGR) and China (13.7% CAGR), where rising disposable incomes, wellness awareness, and the expansion of online beauty retail are fueling strong adoption. Local consumers are increasingly drawn to affordable yet effective solutions that feature caffeine and L-carnitine-based actives, while local brands leverage herbal formulations to appeal to natural skincare preferences. Japan (11.1% CAGR) remains a mature yet innovation-driven market emphasizing biotech peptides and premium home-use devices that combine heat, cryo, and massage functions.

In Europe, steady growth is led by the United Kingdom (8.9% CAGR) and Germany (6.7% CAGR), supported by consumer trust in clinical-grade European cosmetics and established professional spa networks. The UK market reflects high engagement in anti-cellulite product categories tied to seasonal body-firming routines and fitness-based consumption. Germany maintains a strong position with medical-grade formulations, clean-label ingredients, and an expanding pharmacy distribution network. Across North America, the USA (5.7% CAGR) reflects a mature yet evolving market as wellness and cosmetic dermatology continue to merge. American consumers increasingly adopt daily home-care regimens using concentrated serums and AI-assisted smart applicators.

Overall, Asia-Pacific’s dominance is underpinned by a combination of e-commerce acceleration, digital influencer marketing, and consumer willingness to experiment with advanced topical and hybrid solutions. Europe continues to lead in product sophistication and ingredient innovation, while North America remains the hub for brand diversification and omnichannel expansion.
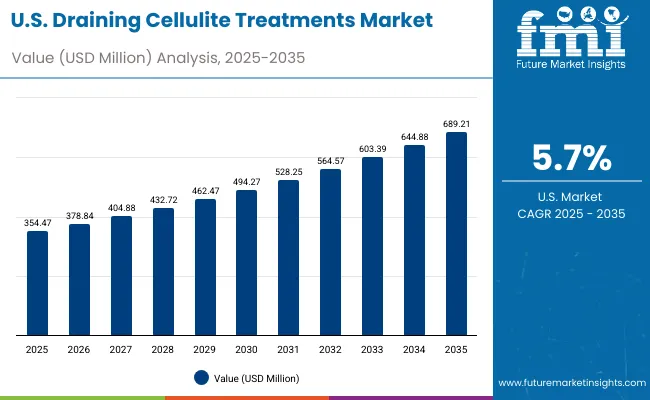
Sales Outlook for Draining Cellulite Treatments in the United States

Usa Draining Cellulite Treatments Market

Year USA Draining Cellulite Treatments Market (USD Million)
2025 354.47
2026 378.84
2027 404.88
2028 432.72
2029 462.47
2030 494.27
2031 528.25
2032 564.57
2033 603.39
2034 644.88
2035 689.21

The Draining Cellulite Treatments Market in the United States is projected to grow from USD 354.47 million in 2025 to USD 689.21 million by 2035, reflecting steady expansion supported by rising consumer focus on self-care and premium beauty routines. The market’s momentum is reinforced by increased adoption of dermatologist-endorsed formulations, integration of AI skin diagnostic tools, and hybrid wellness-retail spaces offering professional-grade products. Daily home-care formats, especially gel creams and serums, dominate usage, while professional spas and dermatology clinics continue to drive awareness through bundled treatments.

  • Post-partum mothers are major consumers adopting structured anti-cellulite routines.
  • Beauty-tech tools linked to body-firming gels are gaining traction in smart skincare.
  • Omnichannel retail strategies are boosting product reach across suburban and urban markets.

Growth and Expansion Outlook for Draining Cellulite Treatments Market in the United Kingdom

The Draining Cellulite Treatments Market in the United Kingdom is expected to grow at a CAGR of 8.9%, supported by the strong convergence of wellness culture and beauty retail innovation. Premium brands such as Clarins and Collistar continue to dominate through pharmacy and department store presence, while niche clean-beauty labels are expanding in online channels. The UK market’s seasonal demand spikes before summer and holidays, driven by consumer emphasis on body confidence and firming routines.

  • Spa resorts and aesthetic clinics are collaborating with brands for professional adjunct treatments.
  • Clean, vegan, and ethically sourced cellulite formulations are witnessing strong uptake.
  • Digital marketing and influencer-based campaigns continue to drive repeat purchase behavior.

Growth and Expansion Outlook for Draining Cellulite Treatments Market in India

The Draining Cellulite Treatments Market in India is witnessing rapid growth with a CAGR of 15.4%, the highest globally. Expansion is supported by increased consumer awareness in metropolitan and tier-2 cities, coupled with the rise of affordable mass-premium skincare brands. Local consumers increasingly favor herbal-based cellulite creams infused with caffeine, green tea, and Ayurvedic actives, blending modern efficacy with traditional trust. E-commerce channels are pivotal in product discovery, while urban fitness culture boosts demand for body contouring and firming products.

  • Domestic startups are launching ayurvedic-inspired cellulite treatments for mass retail.
  • E-commerce platforms like Nykaa and Amazon dominate distribution.
  • Fitness and lifestyle influencers play a key role in awareness and engagement.

Sales Outlook for Draining Cellulite Treatments in China

The Draining Cellulite Treatments Market in China is projected to expand at a CAGR of 13.7%, driven by the convergence of cosmeceutical innovation, body positivity movements, and beauty-tech integration. Urban consumers, particularly women aged 25–40, are fueling demand for advanced draining formulas featuring caffeine, peptides, and cryo-activated ingredients. Domestic brands such as Pechoin and Inoherb are competing with global players like Clarins and Shiseido through localized formulations and influencer-driven marketing on Tmall and Douyin.
  • Smart applicators with heating/cooling technology are boosting consumer experience.
  • Domestic beauty-tech firms are expanding product innovation beyond facial skincare.
  • Localized marketing focusing on “body detox” and “skin firmness” resonates strongly with Chinese consumers.

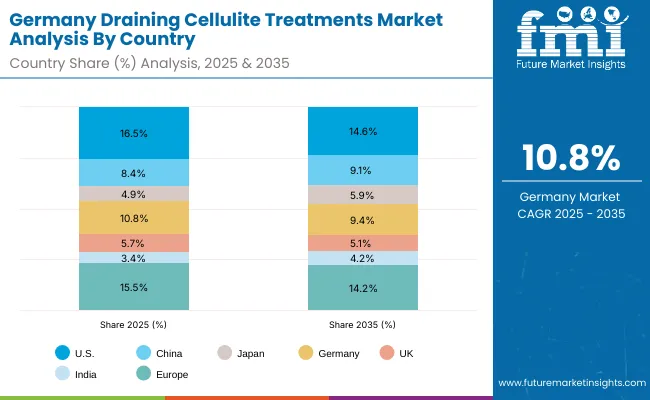
In-depth Analysis of Draining Cellulite Treatments in Germany

Europe Draining Cellulite Treatments Market

Country 2025 Share (%)
USA 16.5%
China 8.4%
Japan 4.9%
Germany 10.8%
UK 5.7%
India 3.4%
Country 2035 Share (%)
USA 14.6%
China 9.1%
Japan 5.9%
Germany 9.4%
UK 5.1%
India 4.2%

Germany’s market shows steady, premium-led growth (country share easing from 10.8% in 2025 to 9.4% in 2035 as Asia scales faster). Dermocosmetic heritage, pharmacy trust, and strict claim substantiation favor clinically validated gel creams and serum concentrates featuring caffeine, L-carnitine, and vasotonic botanicals. Professional spa and medispa ecosystems complement home-care, with rising interest in biotech firming peptides and clean-label actives. Distribution remains pharmacy- and drugstore-centric, while e-commerce expands for replenishment cycles and bundles. Sustainability and recyclable airless packaging influence launches, and seasonal “pre-summer” routines sustain repeat purchases.
  • Pharmacies drive premium, clinically backed cellulite care.
  • Spa/medispa adjuncts lift regimen adherence and basket size.
  • Clean-label plus biotech peptides shape next-gen launches.

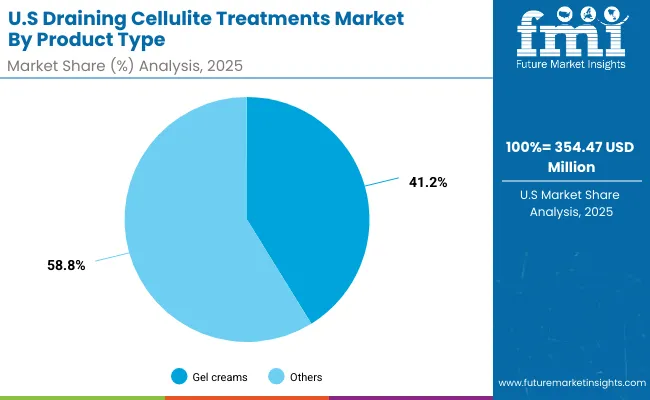
Growth Outlook for Draining Cellulite Treatments Market in USA

Us Draining Cellulite Treatments Market

USA By Product Type Value Share % 2025
Gel creams 41.2%
Others 58.8%

The USA market is projected to rise from USD 354.47 Mn (2025) to USD 689.21 Mn (2035), supported by dermatologist endorsements, omnichannel reach, and AI-guided body-care routines. Gel creams hold 41.2% of 2025 sales, while “Others” (58.8%)notably serum concentratesgain from higher active loads and faster visible results. Wellness culture, postpartum recovery needs, and fitness communities sustain demand; retailers push subscription and duo-pack formats to extend lifetime value. Partnerships with spas and aesthetic clinics promote hybrid home-professional regimens and upsell premium peptide formulas.
  • Post-partum and fitness cohorts adopt structured routines.
  • AI tools + smart applicators boost regimen stickiness.
  • Bundled serums elevate “Others” ahead of gels in value.

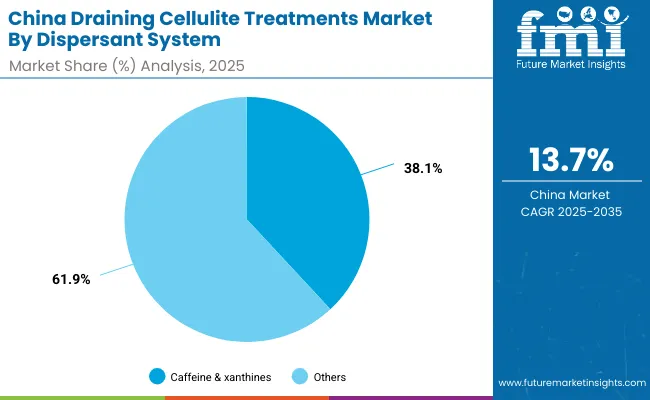
Opportunity Analysis of China Draining Cellulite Treatments Market

China Draining Cellulite Treatments Market

China By Dispersant System Value Share % 2025
Caffeine & xanthines 38.1%
Others 61.9%

The Draining Cellulite Treatments Market in China presents strong growth opportunities, driven by evolving beauty routines, rising disposable incomes, and heightened awareness of body toning and lymphatic health. Consumers increasingly favor multi-active formulations that blend caffeine and xanthines (38.1% share) with botanical and peptide complexes for enhanced skin firmness and microcirculation. Domestic skincare brands are launching competitively priced serum concentrates and cryo roll-ons, using localized natural ingredients like ginseng, lotus, and tea extracts to appeal to wellness-conscious buyers. Meanwhile, premium global brands leverage cross-border e-commerce platforms such as Tmall Global and Douyin to reach aspirational consumers seeking clinically proven European and Japanese products.

The market’s opportunity is further supported by rising participation of beauty-tech startups, introducing smart applicators with cooling and massage functions that mimic professional spa treatments. These devices, paired with high-performance formulations, are creating a new category of hybrid at-home body care. Additionally, government emphasis on sustainability and local R&D funding encourages eco-friendly packaging and ingredient transparency, giving domestic manufacturers a competitive edge. With increasing adoption across Tier 1 and Tier 2 cities, and a growing shift toward science-backed body care, China is expected to remain a core growth engine for the global Draining Cellulite Treatments Market through 2035.
  • Caffeine & xanthine-based blends continue to anchor consumer trust and efficacy perception.
  • Cross-border e-commerce and social commerce amplify brand visibility and trial rates.
  • Smart applicators and cooling roll-ons define the next wave of hybrid beauty innovation.

Competitive Landscape of Draining Cellulite Treatments Market

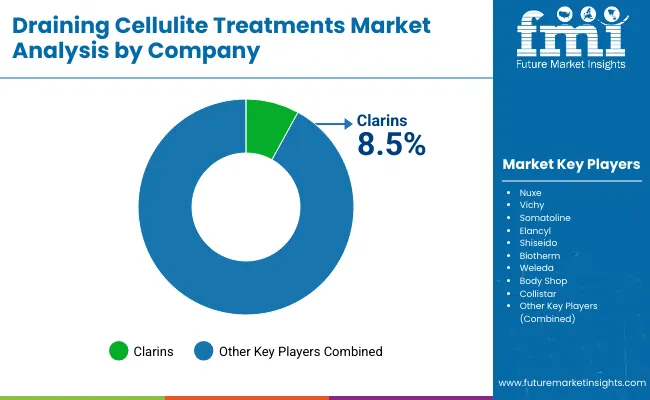
Draining Cellulite Treatments Market By Company

Company Global Value Share 2025
Clarins 8.5%
Others 91.5%

The Draining Cellulite Treatments Market is moderately fragmented, featuring a mix of global luxury skincare houses, professional dermocosmetic brands, and emerging niche players specializing in natural and biotech formulations. Global leaders such as Clarins, Vichy, and Somatoline hold a collective edge through long-standing brand credibility, clinically backed efficacy, and diversified distribution across pharmacies, e-commerce, and spa channels. Clarins, with an 8.5% global share in 2025, continues to dominate through its caffeine-enriched “Body Fit” line and strong emphasis on sensorial texture innovation and sustainable packaging.

Mid-sized innovators like Elancyl, Collistar, and Biotherm are expanding their portfolios with peptide-rich firming blends, cryo-active gels, and massage-based delivery systems targeting visible contouring effects. Their strategies focus on merging cosmetic efficacy with physiological performance, emphasizing tightening, drainage, and toning benefits validated through in-vivo testing. Meanwhile, niche and indie brands such as Weleda and The Body Shop leverage plant-based actives, ethical sourcing, and minimalist ingredient lists to attract clean-beauty consumers seeking gentle but functional solutions.

The competitive focus is shifting from traditional anti-cellulite claims to holistic body wellness and digital engagement. Brands are launching AI-enabled self-assessment apps, subscription-based regimen kits, and refillable applicator systems to build consumer loyalty. Sustainability has emerged as a key differentiator, with companies adopting eco-conscious packaging and traceable ingredients. As the market evolves, winning players will be those capable of blending dermocosmetic science, wellness positioning, and tech-enabled personalization into a cohesive consumer experience.

Key Developments in Draining Cellulite Treatments Market

  • 2025: Clarins launched an upgraded version of its Body Fit Active Gel, featuring a new caffeine–watermintphyto-complex designed to enhance lymphatic drainage and skin cooling. The brand also introduced eco-refill pouches across its cellulite treatment line, aligning with its sustainability goals and reducing plastic use by 80%.
  • 2024: Somatoline Cosmetic introduced its Biotech Firming Peptide Serum in select European pharmacies, integrating L-carnitine and encapsulated peptide technology for accelerated firming results. The launch was supported by a digital campaign promoting AI-based body analysis tools that guide consumers on personalized at-home massage routines.

Scope of the Report

Item Value
Quantitative Units USD 2,151.3 Million
Product Type Gel creams, Serum concentrates, Massage oils, Cryo / thermo roll-ons
Key Actives Caffeine & xanthines, L-Carnitine complexes, Botanical vasotonics (e.g., horse chestnut), Peptide/biotech firming blends
Usage Mode Daily home-care, Intensive 4–8 week regimen, Professional spa adjunct
Channel E-commerce, Pharmacies & drugstores, Specialty beauty retail, Spas & salons
End User Women, Post-partum mothers, Fitness-focused consumers
Regions Covered North America, Europe, Asia-Pacific, Latin America, Middle East & Africa
Country Covered United States, Canada, Germany, France, United Kingdom, China, Japan, India, Brazil, South Africa
Key Companies Profiled Clarins, Nuxe, Vichy, Somatoline, Elancyl, Shiseido, Biotherm, Weleda, Body Shop, Collistar
Additional Attributes Dollar sales by product type and key active ingredient, adoption trends in daily home-care and professional spa treatments, rising demand for serum concentrates and gel creams with caffeine and L-carnitine complexes, segment growth driven by wellness, postpartum recovery, and fitness-focused consumers, product innovation in peptide- and biotech-based firming blends, e-commerce and pharmacy-led retail expansion, integration of smart applicators and AI skincare tools, regional trends influenced by beauty-tech adoption in Asia-Pacific and Europe, and advancements in cryo -therapy, thermo-active, and microcirculation-enhancing formulations.

Key Segments

By Product Type:

  • Gel creams
  • Serum concentrates
  • Massage oils
  • Cryo/thermo roll-ons

By Key Actives:

  • Caffeine & xanthines
  • L-Carnitine complexes
  • Botanical vasotonics (e.g., horse chestnut)
  • Peptide/biotech firming blends

By Usage Mode:

  • Daily home-care
  • Intensive 4-8 week regimen
  • Professional spa adjunct

By Channel:

  • E-commerce
  • Pharmacies & drugstores
  • Specialty beauty retail
  • Spas & salons

By End User:

  • Women
  • Post-partum mothers
  • Fitness-focused consumers

By Region:

  • North America
  • Latin America
  • Europe
  • East Asia
  • South Asia & Pacific
  • Middle East and Africa

Table of Content

  1. Executive Summary
    • Global Market Outlook
    • Demand-side Trends
    • Supply-side Trends
    • Technology Roadmap Analysis
    • Analysis and Recommendations
  2. Market Overview
    • Market Coverage / Taxonomy
    • Market Definition / Scope / Limitations
  3. Market Background
    • Market Dynamics
      • Drivers
      • Restraints
      • Opportunity
      • Trends
    • Scenario Forecast
      • Demand in Optimistic Scenario
      • Demand in Likely Scenario
      • Demand in Conservative Scenario
    • Opportunity Map Analysis
    • Product Life Cycle Analysis
    • Supply Chain Analysis
      • Supply Side Participants and their Roles
        • Producers
        • Mid-Level Participants (Traders/ Agents/ Brokers)
        • Wholesalers and Distributors
      • Value Added and Value Created at Node in the Supply Chain
      • List of Raw Material Suppliers
      • List of Existing and Potential Buyer’s
    • Investment Feasibility Matrix
    • Value Chain Analysis
      • Profit Margin Analysis
      • Wholesalers and Distributors
      • Retailers
    • PESTLE and Porter’s Analysis
    • Regulatory Landscape
      • By Key Regions
      • By Key Countries
    • Regional Parent Market Outlook
    • Production and Consumption Statistics
    • Import and Export Statistics
  4. Global Market Analysis 2020 to 2024 and Forecast, 2025 to 2035
    • Historical Market Size Value (USD Million) & Volume (Units) Analysis, 2020 to 2024
    • Current and Future Market Size Value (USD Million) & Volume (Units) Projections, 2025 to 2035
      • Y-o-Y Growth Trend Analysis
      • Absolute $ Opportunity Analysis
  5. Global Market Analysis 2020 to 2024 and Forecast 2025 to 2035, By Product Type
    • Introduction / Key Findings
    • Historical Market Size Value (USD Million) & Volume (Units) Analysis By Product Type, 2020 to 2024
    • Current and Future Market Size Value (USD Million) & Volume (Units) Analysis and Forecast By Product Type, 2025 to 2035
      • Gel creams
      • Serum concentrates
      • Massage oils
      • Cryo/thermo roll-ons
    • Y-o-Y Growth Trend Analysis By Product Type, 2020 to 2024
    • Absolute $ Opportunity Analysis By Product Type, 2025 to 2035
  6. Global Market Analysis 2020 to 2024 and Forecast 2025 to 2035, By Key Actives
    • Introduction / Key Findings
    • Historical Market Size Value (USD Million) & Volume (Units) Analysis By Key Actives, 2020 to 2024
    • Current and Future Market Size Value (USD Million) & Volume (Units) Analysis and Forecast By Key Actives, 2025 to 2035
      • Caffeine & xanthines
      • L-Carnitine complexes
      • Botanical vasotonics (e.g., horse chestnut)
      • Peptide/biotech firming blends
    • Y-o-Y Growth Trend Analysis By Key Actives, 2020 to 2024
    • Absolute $ Opportunity Analysis By Key Actives, 2025 to 2035
  7. Global Market Analysis 2020 to 2024 and Forecast 2025 to 2035, By Usage Mode
    • Introduction / Key Findings
    • Historical Market Size Value (USD Million) & Volume (Units) Analysis By Usage Mode, 2020 to 2024
    • Current and Future Market Size Value (USD Million) & Volume (Units) Analysis and Forecast By Usage Mode, 2025 to 2035
      • Daily home-care
      • Intensive 4–8 week regimen
      • Professional spa adjunct
    • Y-o-Y Growth Trend Analysis By Usage Mode, 2020 to 2024
    • Absolute $ Opportunity Analysis By Usage Mode, 2025 to 2035
  8. Global Market Analysis 2020 to 2024 and Forecast 2025 to 2035, By Channel
    • Introduction / Key Findings
    • Historical Market Size Value (USD Million) & Volume (Units) Analysis By Channel, 2020 to 2024
    • Current and Future Market Size Value (USD Million) & Volume (Units) Analysis and Forecast By Channel, 2025 to 2035
      • E-commerce
      • Pharmacies & drugstores
      • Specialty beauty retail
      • Spas & salons
    • Y-o-Y Growth Trend Analysis By Channel, 2020 to 2024
    • Absolute $ Opportunity Analysis By Channel, 2025 to 2035
  9. Global Market Analysis 2020 to 2024 and Forecast 2025 to 2035, By End User
    • Introduction / Key Findings
    • Historical Market Size Value (USD Million) & Volume (Units) Analysis By End User, 2020 to 2024
    • Current and Future Market Size Value (USD Million) & Volume (Units) Analysis and Forecast By End User, 2025 to 2035
      • Women
      • Post-partum mothers
      • Fitness-focused consumers
    • Y-o-Y Growth Trend Analysis By End User, 2020 to 2024
    • Absolute $ Opportunity Analysis By End User, 2025 to 2035
  10. Global Market Analysis 2020 to 2024 and Forecast 2025 to 2035, By Region
    • Introduction
    • Historical Market Size Value (USD Million) & Volume (Units) Analysis By Region, 2020 to 2024
    • Current Market Size Value (USD Million) & Volume (Units) Analysis and Forecast By Region, 2025 to 2035
      • North America
      • Latin America
      • Europe
      • East Asia
      • South Asia & Pacific
      • Middle East and Africa
    • Market Attractiveness Analysis By Region
  11. North America Market Analysis 2020 to 2024 and Forecast 2025 to 2035, By Country
    • Historical Market Size Value (USD Million) & Volume (Units) Trend Analysis By Market Taxonomy, 2020 to 2024
    • Market Size Value (USD Million) & Volume (Units) Forecast By Market Taxonomy, 2025 to 2035
      • By Country
        • USA
        • Canada
      • By Product Type
      • By Key Actives
      • By Usage Mode
      • By Channel
      • By End User
    • Market Attractiveness Analysis
      • By Country
      • By Product Type
      • By Key Actives
      • By Usage Mode
      • By Channel
      • By End User
    • Key Takeaways
  12. Latin America Market Analysis 2020 to 2024 and Forecast 2025 to 2035, By Country
    • Historical Market Size Value (USD Million) & Volume (Units) Trend Analysis By Market Taxonomy, 2020 to 2024
    • Market Size Value (USD Million) & Volume (Units) Forecast By Market Taxonomy, 2025 to 2035
      • By Country
        • Brazil
        • Mexico
        • Colombia
        • Rest of Latin America
      • By Product Type
      • By Key Actives
      • By Usage Mode
      • By Channel
      • By End User
    • Market Attractiveness Analysis
      • By Country
      • By Product Type
      • By Key Actives
      • By Usage Mode
      • By Channel
      • By End User
    • Key Takeaways
  13. Europe Market Analysis 2020 to 2024 and Forecast 2025 to 2035, By Country
    • Historical Market Size Value (USD Million) & Volume (Units) Trend Analysis By Market Taxonomy, 2020 to 2024
    • Market Size Value (USD Million) & Volume (Units) Forecast By Market Taxonomy, 2025 to 2035
      • By Country
        • Germany
        • UK
        • France
        • Italy
        • Spain
        • Belgium
        • Netherlands
        • Nordic
        • Switzerland
        • Russia
        • Poland
        • Rest of Europe
      • By Product Type
      • By Key Actives
      • By Usage Mode
      • By Channel
      • By End User
    • Market Attractiveness Analysis
      • By Country
      • By Product Type
      • By Key Actives
      • By Usage Mode
      • By Channel
      • By End User
    • Key Takeaways
  14. East Asia Market Analysis 2020 to 2024 and Forecast 2025 to 2035, By Country
    • Historical Market Size Value (USD Million) & Volume (Units) Trend Analysis By Market Taxonomy, 2020 to 2024
    • Market Size Value (USD Million) & Volume (Units) Forecast By Market Taxonomy, 2025 to 2035
      • By Country
        • China
        • Japan
        • South Korea
      • By Product Type
      • By Key Actives
      • By Usage Mode
      • By Channel
      • By End User
    • Market Attractiveness Analysis
      • By Country
      • By Product Type
      • By Key Actives
      • By Usage Mode
      • By Channel
      • By End User
    • Key Takeaways
  15. South Asia & Pacific Market Analysis 2020 to 2024 and Forecast 2025 to 2035, By Country
    • Historical Market Size Value (USD Million) & Volume (Units) Trend Analysis By Market Taxonomy, 2020 to 2024
    • Market Size Value (USD Million) & Volume (Units) Forecast By Market Taxonomy, 2025 to 2035
      • By Country
        • India
        • Thailand
        • Malaysia
        • Indonesia
        • Singapore
        • Vietnam
        • Australia
        • New Zealand
        • Rest of South Asia
      • By Product Type
      • By Key Actives
      • By Usage Mode
      • By Channel
      • By End User
    • Market Attractiveness Analysis
      • By Country
      • By Product Type
      • By Key Actives
      • By Usage Mode
      • By Channel
      • By End User
    • Key Takeaways
  16. Middle East and Africa Market Analysis 2020 to 2024 and Forecast 2025 to 2035, By Country
    • Historical Market Size Value (USD Million) & Volume (Units) Trend Analysis By Market Taxonomy, 2020 to 2024
    • Market Size Value (USD Million) & Volume (Units) Forecast By Market Taxonomy, 2025 to 2035
      • By Country
        • Turkey
        • UAE
        • Saudi Arabia
        • Israel
        • Other GCC Countries
        • North Africa
        • South Africa
      • By Product Type
      • By Key Actives
      • By Usage Mode
      • By Channel
      • By End User
    • Market Attractiveness Analysis
      • By Country
      • By Product Type
      • By Key Actives
      • By Usage Mode
      • By Channel
      • By End User
    • Key Takeaways
  17. Key Countries Market Analysis
    • USA
      • Pricing Analysis
      • Market Share Analysis, 2024
        • By Product Type
        • By Key Actives
        • By Usage Mode
        • By Channel
        • By End User
    • Canada
      • Pricing Analysis
      • Market Share Analysis, 2024
        • By Product Type
        • By Key Actives
        • By Usage Mode
        • By Channel
        • By End User
    • Brazil
      • Pricing Analysis
      • Market Share Analysis, 2024
        • By Product Type
        • By Key Actives
        • By Usage Mode
        • By Channel
        • By End User
    • Mexico
      • Pricing Analysis
      • Market Share Analysis, 2024
        • By Product Type
        • By Key Actives
        • By Usage Mode
        • By Channel
        • By End User
    • Colombia
      • Pricing Analysis
      • Market Share Analysis, 2024
        • By Product Type
        • By Key Actives
        • By Usage Mode
        • By Channel
        • By End User
    • Germany
      • Pricing Analysis
      • Market Share Analysis, 2024
        • By Product Type
        • By Key Actives
        • By Usage Mode
        • By Channel
        • By End User
    • UK
      • Pricing Analysis
      • Market Share Analysis, 2024
        • By Product Type
        • By Key Actives
        • By Usage Mode
        • By Channel
        • By End User
    • France
      • Pricing Analysis
      • Market Share Analysis, 2024
        • By Product Type
        • By Key Actives
        • By Usage Mode
        • By Channel
        • By End User
    • Italy
      • Pricing Analysis
      • Market Share Analysis, 2024
        • By Product Type
        • By Key Actives
        • By Usage Mode
        • By Channel
        • By End User
    • Spain
      • Pricing Analysis
      • Market Share Analysis, 2024
        • By Product Type
        • By Key Actives
        • By Usage Mode
        • By Channel
        • By End User
    • Belgium
      • Pricing Analysis
      • Market Share Analysis, 2024
        • By Product Type
        • By Key Actives
        • By Usage Mode
        • By Channel
        • By End User
    • Netherlands
      • Pricing Analysis
      • Market Share Analysis, 2024
        • By Product Type
        • By Key Actives
        • By Usage Mode
        • By Channel
        • By End User
    • Nordic
      • Pricing Analysis
      • Market Share Analysis, 2024
        • By Product Type
        • By Key Actives
        • By Usage Mode
        • By Channel
        • By End User
    • Switzerland
      • Pricing Analysis
      • Market Share Analysis, 2024
        • By Product Type
        • By Key Actives
        • By Usage Mode
        • By Channel
        • By End User
    • Russia
      • Pricing Analysis
      • Market Share Analysis, 2024
        • By Product Type
        • By Key Actives
        • By Usage Mode
        • By Channel
        • By End User
    • Poland
      • Pricing Analysis
      • Market Share Analysis, 2024
        • By Product Type
        • By Key Actives
        • By Usage Mode
        • By Channel
        • By End User
    • China
      • Pricing Analysis
      • Market Share Analysis, 2024
        • By Product Type
        • By Key Actives
        • By Usage Mode
        • By Channel
        • By End User
    • Japan
      • Pricing Analysis
      • Market Share Analysis, 2024
        • By Product Type
        • By Key Actives
        • By Usage Mode
        • By Channel
        • By End User
    • South Korea
      • Pricing Analysis
      • Market Share Analysis, 2024
        • By Product Type
        • By Key Actives
        • By Usage Mode
        • By Channel
        • By End User
    • India
      • Pricing Analysis
      • Market Share Analysis, 2024
        • By Product Type
        • By Key Actives
        • By Usage Mode
        • By Channel
        • By End User
    • Thailand
      • Pricing Analysis
      • Market Share Analysis, 2024
        • By Product Type
        • By Key Actives
        • By Usage Mode
        • By Channel
        • By End User
    • Indonesia
      • Pricing Analysis
      • Market Share Analysis, 2024
        • By Product Type
        • By Key Actives
        • By Usage Mode
        • By Channel
        • By End User
    • Australia
      • Pricing Analysis
      • Market Share Analysis, 2024
        • By Product Type
        • By Key Actives
        • By Usage Mode
        • By Channel
        • By End User
    • New Zealand
      • Pricing Analysis
      • Market Share Analysis, 2024
        • By Product Type
        • By Key Actives
        • By Usage Mode
        • By Channel
        • By End User
    • Turkey
      • Pricing Analysis
      • Market Share Analysis, 2024
        • By Product Type
        • By Key Actives
        • By Usage Mode
        • By Channel
        • By End User
    • UAE
      • Pricing Analysis
      • Market Share Analysis, 2024
        • By Product Type
        • By Key Actives
        • By Usage Mode
        • By Channel
        • By End User
    • Saudi Arabia
      • Pricing Analysis
      • Market Share Analysis, 2024
        • By Product Type
        • By Key Actives
        • By Usage Mode
        • By Channel
        • By End User
    • Israel
      • Pricing Analysis
      • Market Share Analysis, 2024
        • By Product Type
        • By Key Actives
        • By Usage Mode
        • By Channel
        • By End User
    • North Africa
      • Pricing Analysis
      • Market Share Analysis, 2024
        • By Product Type
        • By Key Actives
        • By Usage Mode
        • By Channel
        • By End User
    • South Africa
      • Pricing Analysis
      • Market Share Analysis, 2024
        • By Product Type
        • By Key Actives
        • By Usage Mode
        • By Channel
        • By End User
  18. Market Structure Analysis
    • Competition Dashboard
    • Competition Benchmarking
    • Market Share Analysis of Top Players
      • By Regional
      • By Product Type
      • By Key Actives
      • By Usage Mode
      • By Channel
      • By End User
  19. Competition Analysis
    • Competition Deep Dive
      • Clarins
        • Overview
        • Product Portfolio
        • Profitability by Market Segments (Product/Age /Sales Channel/Region)
        • Sales Footprint
        • Strategy Overview
          • Marketing Strategy
          • Product Strategy
          • Channel Strategy
      • Nuxe
        • Overview
        • Product Portfolio
        • Profitability by Market Segments (Product/Age /Sales Channel/Region)
        • Sales Footprint
        • Strategy Overview
          • Marketing Strategy
          • Product Strategy
          • Channel Strategy
      • Vichy
        • Overview
        • Product Portfolio
        • Profitability by Market Segments (Product/Age /Sales Channel/Region)
        • Sales Footprint
        • Strategy Overview
          • Marketing Strategy
          • Product Strategy
          • Channel Strategy
      • Somatoline
        • Overview
        • Product Portfolio
        • Profitability by Market Segments (Product/Age /Sales Channel/Region)
        • Sales Footprint
        • Strategy Overview
          • Marketing Strategy
          • Product Strategy
          • Channel Strategy
      • Elancyl
        • Overview
        • Product Portfolio
        • Profitability by Market Segments (Product/Age /Sales Channel/Region)
        • Sales Footprint
        • Strategy Overview
          • Marketing Strategy
          • Product Strategy
          • Channel Strategy
      • Shiseido
        • Overview
        • Product Portfolio
        • Profitability by Market Segments (Product/Age /Sales Channel/Region)
        • Sales Footprint
        • Strategy Overview
          • Marketing Strategy
          • Product Strategy
          • Channel Strategy
      • Biotherm
        • Overview
        • Product Portfolio
        • Profitability by Market Segments (Product/Age /Sales Channel/Region)
        • Sales Footprint
        • Strategy Overview
          • Marketing Strategy
          • Product Strategy
          • Channel Strategy
      • Weleda
        • Overview
        • Product Portfolio
        • Profitability by Market Segments (Product/Age /Sales Channel/Region)
        • Sales Footprint
        • Strategy Overview
          • Marketing Strategy
          • Product Strategy
          • Channel Strategy
      • Body Shop
        • Overview
        • Product Portfolio
        • Profitability by Market Segments (Product/Age /Sales Channel/Region)
        • Sales Footprint
        • Strategy Overview
          • Marketing Strategy
          • Product Strategy
          • Channel Strategy
      • Collistar
        • Overview
        • Product Portfolio
        • Profitability by Market Segments (Product/Age /Sales Channel/Region)
        • Sales Footprint
        • Strategy Overview
          • Marketing Strategy
          • Product Strategy
          • Channel Strategy
      • Others
        • Overview
        • Product Portfolio
        • Profitability by Market Segments (Product/Age /Sales Channel/Region)
        • Sales Footprint
        • Strategy Overview
          • Marketing Strategy
          • Product Strategy
          • Channel Strategy
  20. Assumptions & Acronyms Used
  21. Research Methodology

List of Tables

  • Table 1: Global Market Value (USD Million) Forecast by Region, 2020-2035
  • Table 2: Global Market Volume (Units) Forecast by Region, 2020-2035
  • Table 3: Global Market Value (USD Million) Forecast by Product Type, 2020-2035
  • Table 4: Global Market Volume (Units) Forecast by Product Type, 2020-2035
  • Table 5: Global Market Value (USD Million) Forecast by Key Actives, 2020-2035
  • Table 6: Global Market Volume (Units) Forecast by Key Actives, 2020-2035
  • Table 7: Global Market Value (USD Million) Forecast by Usage Mode, 2020-2035
  • Table 8: Global Market Volume (Units) Forecast by Usage Mode, 2020-2035
  • Table 9: Global Market Value (USD Million) Forecast by Channel, 2020-2035
  • Table 10: Global Market Volume (Units) Forecast by Channel, 2020-2035
  • Table 11: Global Market Value (USD Million) Forecast by End User, 2020-2035
  • Table 12: Global Market Volume (Units) Forecast by End User, 2020-2035
  • Table 13: North America Market Value (USD Million) Forecast by Country, 2020-2035
  • Table 14: North America Market Volume (Units) Forecast by Country, 2020-2035
  • Table 15: North America Market Value (USD Million) Forecast by Product Type, 2020-2035
  • Table 16: North America Market Volume (Units) Forecast by Product Type, 2020-2035
  • Table 17: North America Market Value (USD Million) Forecast by Key Actives, 2020-2035
  • Table 18: North America Market Volume (Units) Forecast by Key Actives, 2020-2035
  • Table 19: North America Market Value (USD Million) Forecast by Usage Mode, 2020-2035
  • Table 20: North America Market Volume (Units) Forecast by Usage Mode, 2020-2035
  • Table 21: North America Market Value (USD Million) Forecast by Channel, 2020-2035
  • Table 22: North America Market Volume (Units) Forecast by Channel, 2020-2035
  • Table 23: North America Market Value (USD Million) Forecast by End User, 2020-2035
  • Table 24: North America Market Volume (Units) Forecast by End User, 2020-2035
  • Table 25: Latin America Market Value (USD Million) Forecast by Country, 2020-2035
  • Table 26: Latin America Market Volume (Units) Forecast by Country, 2020-2035
  • Table 27: Latin America Market Value (USD Million) Forecast by Product Type, 2020-2035
  • Table 28: Latin America Market Volume (Units) Forecast by Product Type, 2020-2035
  • Table 29: Latin America Market Value (USD Million) Forecast by Key Actives, 2020-2035
  • Table 30: Latin America Market Volume (Units) Forecast by Key Actives, 2020-2035
  • Table 31: Latin America Market Value (USD Million) Forecast by Usage Mode, 2020-2035
  • Table 32: Latin America Market Volume (Units) Forecast by Usage Mode, 2020-2035
  • Table 33: Latin America Market Value (USD Million) Forecast by Channel, 2020-2035
  • Table 34: Latin America Market Volume (Units) Forecast by Channel, 2020-2035
  • Table 35: Latin America Market Value (USD Million) Forecast by End User, 2020-2035
  • Table 36: Latin America Market Volume (Units) Forecast by End User, 2020-2035
  • Table 37: Europe Market Value (USD Million) Forecast by Country, 2020-2035
  • Table 38: Europe Market Volume (Units) Forecast by Country, 2020-2035
  • Table 39: Europe Market Value (USD Million) Forecast by Product Type, 2020-2035
  • Table 40: Europe Market Volume (Units) Forecast by Product Type, 2020-2035
  • Table 41: Europe Market Value (USD Million) Forecast by Key Actives, 2020-2035
  • Table 42: Europe Market Volume (Units) Forecast by Key Actives, 2020-2035
  • Table 43: Europe Market Value (USD Million) Forecast by Usage Mode, 2020-2035
  • Table 44: Europe Market Volume (Units) Forecast by Usage Mode, 2020-2035
  • Table 45: Europe Market Value (USD Million) Forecast by Channel, 2020-2035
  • Table 46: Europe Market Volume (Units) Forecast by Channel, 2020-2035
  • Table 47: Europe Market Value (USD Million) Forecast by End User, 2020-2035
  • Table 48: Europe Market Volume (Units) Forecast by End User, 2020-2035
  • Table 49: East Asia Market Value (USD Million) Forecast by Country, 2020-2035
  • Table 50: East Asia Market Volume (Units) Forecast by Country, 2020-2035
  • Table 51: East Asia Market Value (USD Million) Forecast by Product Type, 2020-2035
  • Table 52: East Asia Market Volume (Units) Forecast by Product Type, 2020-2035
  • Table 53: East Asia Market Value (USD Million) Forecast by Key Actives, 2020-2035
  • Table 54: East Asia Market Volume (Units) Forecast by Key Actives, 2020-2035
  • Table 55: East Asia Market Value (USD Million) Forecast by Usage Mode, 2020-2035
  • Table 56: East Asia Market Volume (Units) Forecast by Usage Mode, 2020-2035
  • Table 57: East Asia Market Value (USD Million) Forecast by Channel, 2020-2035
  • Table 58: East Asia Market Volume (Units) Forecast by Channel, 2020-2035
  • Table 59: East Asia Market Value (USD Million) Forecast by End User, 2020-2035
  • Table 60: East Asia Market Volume (Units) Forecast by End User, 2020-2035
  • Table 61: South Asia & Pacific Market Value (USD Million) Forecast by Country, 2020-2035
  • Table 62: South Asia & Pacific Market Volume (Units) Forecast by Country, 2020-2035
  • Table 63: South Asia & Pacific Market Value (USD Million) Forecast by Product Type, 2020-2035
  • Table 64: South Asia & Pacific Market Volume (Units) Forecast by Product Type, 2020-2035
  • Table 65: South Asia & Pacific Market Value (USD Million) Forecast by Key Actives, 2020-2035
  • Table 66: South Asia & Pacific Market Volume (Units) Forecast by Key Actives, 2020-2035
  • Table 67: South Asia & Pacific Market Value (USD Million) Forecast by Usage Mode, 2020-2035
  • Table 68: South Asia & Pacific Market Volume (Units) Forecast by Usage Mode, 2020-2035
  • Table 69: South Asia & Pacific Market Value (USD Million) Forecast by Channel, 2020-2035
  • Table 70: South Asia & Pacific Market Volume (Units) Forecast by Channel, 2020-2035
  • Table 71: South Asia & Pacific Market Value (USD Million) Forecast by End User, 2020-2035
  • Table 72: South Asia & Pacific Market Volume (Units) Forecast by End User, 2020-2035
  • Table 73: Middle East and Africa Market Value (USD Million) Forecast by Country, 2020-2035
  • Table 74: Middle East and Africa Market Volume (Units) Forecast by Country, 2020-2035
  • Table 75: Middle East and Africa Market Value (USD Million) Forecast by Product Type, 2020-2035
  • Table 76: Middle East and Africa Market Volume (Units) Forecast by Product Type, 2020-2035
  • Table 77: Middle East and Africa Market Value (USD Million) Forecast by Key Actives, 2020-2035
  • Table 78: Middle East and Africa Market Volume (Units) Forecast by Key Actives, 2020-2035
  • Table 79: Middle East and Africa Market Value (USD Million) Forecast by Usage Mode, 2020-2035
  • Table 80: Middle East and Africa Market Volume (Units) Forecast by Usage Mode, 2020-2035
  • Table 81: Middle East and Africa Market Value (USD Million) Forecast by Channel, 2020-2035
  • Table 82: Middle East and Africa Market Volume (Units) Forecast by Channel, 2020-2035
  • Table 83: Middle East and Africa Market Value (USD Million) Forecast by End User, 2020-2035
  • Table 84: Middle East and Africa Market Volume (Units) Forecast by End User, 2020-2035

List of Figures

  • Figure 1: Global Market Value (USD Million) by Product Type, 2025-2035
  • Figure 2: Global Market Value (USD Million) by Key Actives, 2025-2035
  • Figure 3: Global Market Value (USD Million) by Usage Mode, 2025-2035
  • Figure 4: Global Market Value (USD Million) by Channel, 2025-2035
  • Figure 5: Global Market Value (USD Million) by End User, 2025-2035
  • Figure 6: Global Market Value (USD Million) by Region, 2025-2035
  • Figure 7: Global Market Value (USD Million) Analysis by Region, 2020-2035
  • Figure 8: Global Market Volume (Units) Analysis by Region, 2020-2035
  • Figure 9: Global Market Value Share (%) and BPS Analysis by Region, 2025-2035
  • Figure 10: Global Market Y-o-Y Growth (%) Projections by Region, 2025-2035
  • Figure 11: Global Market Value (USD Million) Analysis by Product Type, 2020-2035
  • Figure 12: Global Market Volume (Units) Analysis by Product Type, 2020-2035
  • Figure 13: Global Market Value Share (%) and BPS Analysis by Product Type, 2025-2035
  • Figure 14: Global Market Y-o-Y Growth (%) Projections by Product Type, 2025-2035
  • Figure 15: Global Market Value (USD Million) Analysis by Key Actives, 2020-2035
  • Figure 16: Global Market Volume (Units) Analysis by Key Actives, 2020-2035
  • Figure 17: Global Market Value Share (%) and BPS Analysis by Key Actives, 2025-2035
  • Figure 18: Global Market Y-o-Y Growth (%) Projections by Key Actives, 2025-2035
  • Figure 19: Global Market Value (USD Million) Analysis by Usage Mode, 2020-2035
  • Figure 20: Global Market Volume (Units) Analysis by Usage Mode, 2020-2035
  • Figure 21: Global Market Value Share (%) and BPS Analysis by Usage Mode, 2025-2035
  • Figure 22: Global Market Y-o-Y Growth (%) Projections by Usage Mode, 2025-2035
  • Figure 23: Global Market Value (USD Million) Analysis by Channel, 2020-2035
  • Figure 24: Global Market Volume (Units) Analysis by Channel, 2020-2035
  • Figure 25: Global Market Value Share (%) and BPS Analysis by Channel, 2025-2035
  • Figure 26: Global Market Y-o-Y Growth (%) Projections by Channel, 2025-2035
  • Figure 27: Global Market Value (USD Million) Analysis by End User, 2020-2035
  • Figure 28: Global Market Volume (Units) Analysis by End User, 2020-2035
  • Figure 29: Global Market Value Share (%) and BPS Analysis by End User, 2025-2035
  • Figure 30: Global Market Y-o-Y Growth (%) Projections by End User, 2025-2035
  • Figure 31: Global Market Attractiveness by Product Type, 2025-2035
  • Figure 32: Global Market Attractiveness by Key Actives, 2025-2035
  • Figure 33: Global Market Attractiveness by Usage Mode, 2025-2035
  • Figure 34: Global Market Attractiveness by Channel, 2025-2035
  • Figure 35: Global Market Attractiveness by End User, 2025-2035
  • Figure 36: Global Market Attractiveness by Region, 2025-2035
  • Figure 37: North America Market Value (USD Million) by Product Type, 2025-2035
  • Figure 38: North America Market Value (USD Million) by Key Actives, 2025-2035
  • Figure 39: North America Market Value (USD Million) by Usage Mode, 2025-2035
  • Figure 40: North America Market Value (USD Million) by Channel, 2025-2035
  • Figure 41: North America Market Value (USD Million) by End User, 2025-2035
  • Figure 42: North America Market Value (USD Million) by Country, 2025-2035
  • Figure 43: North America Market Value (USD Million) Analysis by Country, 2020-2035
  • Figure 44: North America Market Volume (Units) Analysis by Country, 2020-2035
  • Figure 45: North America Market Value Share (%) and BPS Analysis by Country, 2025-2035
  • Figure 46: North America Market Y-o-Y Growth (%) Projections by Country, 2025-2035
  • Figure 47: North America Market Value (USD Million) Analysis by Product Type, 2020-2035
  • Figure 48: North America Market Volume (Units) Analysis by Product Type, 2020-2035
  • Figure 49: North America Market Value Share (%) and BPS Analysis by Product Type, 2025-2035
  • Figure 50: North America Market Y-o-Y Growth (%) Projections by Product Type, 2025-2035
  • Figure 51: North America Market Value (USD Million) Analysis by Key Actives, 2020-2035
  • Figure 52: North America Market Volume (Units) Analysis by Key Actives, 2020-2035
  • Figure 53: North America Market Value Share (%) and BPS Analysis by Key Actives, 2025-2035
  • Figure 54: North America Market Y-o-Y Growth (%) Projections by Key Actives, 2025-2035
  • Figure 55: North America Market Value (USD Million) Analysis by Usage Mode, 2020-2035
  • Figure 56: North America Market Volume (Units) Analysis by Usage Mode, 2020-2035
  • Figure 57: North America Market Value Share (%) and BPS Analysis by Usage Mode, 2025-2035
  • Figure 58: North America Market Y-o-Y Growth (%) Projections by Usage Mode, 2025-2035
  • Figure 59: North America Market Value (USD Million) Analysis by Channel, 2020-2035
  • Figure 60: North America Market Volume (Units) Analysis by Channel, 2020-2035
  • Figure 61: North America Market Value Share (%) and BPS Analysis by Channel, 2025-2035
  • Figure 62: North America Market Y-o-Y Growth (%) Projections by Channel, 2025-2035
  • Figure 63: North America Market Value (USD Million) Analysis by End User, 2020-2035
  • Figure 64: North America Market Volume (Units) Analysis by End User, 2020-2035
  • Figure 65: North America Market Value Share (%) and BPS Analysis by End User, 2025-2035
  • Figure 66: North America Market Y-o-Y Growth (%) Projections by End User, 2025-2035
  • Figure 67: North America Market Attractiveness by Product Type, 2025-2035
  • Figure 68: North America Market Attractiveness by Key Actives, 2025-2035
  • Figure 69: North America Market Attractiveness by Usage Mode, 2025-2035
  • Figure 70: North America Market Attractiveness by Channel, 2025-2035
  • Figure 71: North America Market Attractiveness by End User, 2025-2035
  • Figure 72: North America Market Attractiveness by Country, 2025-2035
  • Figure 73: Latin America Market Value (USD Million) by Product Type, 2025-2035
  • Figure 74: Latin America Market Value (USD Million) by Key Actives, 2025-2035
  • Figure 75: Latin America Market Value (USD Million) by Usage Mode, 2025-2035
  • Figure 76: Latin America Market Value (USD Million) by Channel, 2025-2035
  • Figure 77: Latin America Market Value (USD Million) by End User, 2025-2035
  • Figure 78: Latin America Market Value (USD Million) by Country, 2025-2035
  • Figure 79: Latin America Market Value (USD Million) Analysis by Country, 2020-2035
  • Figure 80: Latin America Market Volume (Units) Analysis by Country, 2020-2035
  • Figure 81: Latin America Market Value Share (%) and BPS Analysis by Country, 2025-2035
  • Figure 82: Latin America Market Y-o-Y Growth (%) Projections by Country, 2025-2035
  • Figure 83: Latin America Market Value (USD Million) Analysis by Product Type, 2020-2035
  • Figure 84: Latin America Market Volume (Units) Analysis by Product Type, 2020-2035
  • Figure 85: Latin America Market Value Share (%) and BPS Analysis by Product Type, 2025-2035
  • Figure 86: Latin America Market Y-o-Y Growth (%) Projections by Product Type, 2025-2035
  • Figure 87: Latin America Market Value (USD Million) Analysis by Key Actives, 2020-2035
  • Figure 88: Latin America Market Volume (Units) Analysis by Key Actives, 2020-2035
  • Figure 89: Latin America Market Value Share (%) and BPS Analysis by Key Actives, 2025-2035
  • Figure 90: Latin America Market Y-o-Y Growth (%) Projections by Key Actives, 2025-2035
  • Figure 91: Latin America Market Value (USD Million) Analysis by Usage Mode, 2020-2035
  • Figure 92: Latin America Market Volume (Units) Analysis by Usage Mode, 2020-2035
  • Figure 93: Latin America Market Value Share (%) and BPS Analysis by Usage Mode, 2025-2035
  • Figure 94: Latin America Market Y-o-Y Growth (%) Projections by Usage Mode, 2025-2035
  • Figure 95: Latin America Market Value (USD Million) Analysis by Channel, 2020-2035
  • Figure 96: Latin America Market Volume (Units) Analysis by Channel, 2020-2035
  • Figure 97: Latin America Market Value Share (%) and BPS Analysis by Channel, 2025-2035
  • Figure 98: Latin America Market Y-o-Y Growth (%) Projections by Channel, 2025-2035
  • Figure 99: Latin America Market Value (USD Million) Analysis by End User, 2020-2035
  • Figure 100: Latin America Market Volume (Units) Analysis by End User, 2020-2035
  • Figure 101: Latin America Market Value Share (%) and BPS Analysis by End User, 2025-2035
  • Figure 102: Latin America Market Y-o-Y Growth (%) Projections by End User, 2025-2035
  • Figure 103: Latin America Market Attractiveness by Product Type, 2025-2035
  • Figure 104: Latin America Market Attractiveness by Key Actives, 2025-2035
  • Figure 105: Latin America Market Attractiveness by Usage Mode, 2025-2035
  • Figure 106: Latin America Market Attractiveness by Channel, 2025-2035
  • Figure 107: Latin America Market Attractiveness by End User, 2025-2035
  • Figure 108: Latin America Market Attractiveness by Country, 2025-2035
  • Figure 109: Europe Market Value (USD Million) by Product Type, 2025-2035
  • Figure 110: Europe Market Value (USD Million) by Key Actives, 2025-2035
  • Figure 111: Europe Market Value (USD Million) by Usage Mode, 2025-2035
  • Figure 112: Europe Market Value (USD Million) by Channel, 2025-2035
  • Figure 113: Europe Market Value (USD Million) by End User, 2025-2035
  • Figure 114: Europe Market Value (USD Million) by Country, 2025-2035
  • Figure 115: Europe Market Value (USD Million) Analysis by Country, 2020-2035
  • Figure 116: Europe Market Volume (Units) Analysis by Country, 2020-2035
  • Figure 117: Europe Market Value Share (%) and BPS Analysis by Country, 2025-2035
  • Figure 118: Europe Market Y-o-Y Growth (%) Projections by Country, 2025-2035
  • Figure 119: Europe Market Value (USD Million) Analysis by Product Type, 2020-2035
  • Figure 120: Europe Market Volume (Units) Analysis by Product Type, 2020-2035
  • Figure 121: Europe Market Value Share (%) and BPS Analysis by Product Type, 2025-2035
  • Figure 122: Europe Market Y-o-Y Growth (%) Projections by Product Type, 2025-2035
  • Figure 123: Europe Market Value (USD Million) Analysis by Key Actives, 2020-2035
  • Figure 124: Europe Market Volume (Units) Analysis by Key Actives, 2020-2035
  • Figure 125: Europe Market Value Share (%) and BPS Analysis by Key Actives, 2025-2035
  • Figure 126: Europe Market Y-o-Y Growth (%) Projections by Key Actives, 2025-2035
  • Figure 127: Europe Market Value (USD Million) Analysis by Usage Mode, 2020-2035
  • Figure 128: Europe Market Volume (Units) Analysis by Usage Mode, 2020-2035
  • Figure 129: Europe Market Value Share (%) and BPS Analysis by Usage Mode, 2025-2035
  • Figure 130: Europe Market Y-o-Y Growth (%) Projections by Usage Mode, 2025-2035
  • Figure 131: Europe Market Value (USD Million) Analysis by Channel, 2020-2035
  • Figure 132: Europe Market Volume (Units) Analysis by Channel, 2020-2035
  • Figure 133: Europe Market Value Share (%) and BPS Analysis by Channel, 2025-2035
  • Figure 134: Europe Market Y-o-Y Growth (%) Projections by Channel, 2025-2035
  • Figure 135: Europe Market Value (USD Million) Analysis by End User, 2020-2035
  • Figure 136: Europe Market Volume (Units) Analysis by End User, 2020-2035
  • Figure 137: Europe Market Value Share (%) and BPS Analysis by End User, 2025-2035
  • Figure 138: Europe Market Y-o-Y Growth (%) Projections by End User, 2025-2035
  • Figure 139: Europe Market Attractiveness by Product Type, 2025-2035
  • Figure 140: Europe Market Attractiveness by Key Actives, 2025-2035
  • Figure 141: Europe Market Attractiveness by Usage Mode, 2025-2035
  • Figure 142: Europe Market Attractiveness by Channel, 2025-2035
  • Figure 143: Europe Market Attractiveness by End User, 2025-2035
  • Figure 144: Europe Market Attractiveness by Country, 2025-2035
  • Figure 145: East Asia Market Value (USD Million) by Product Type, 2025-2035
  • Figure 146: East Asia Market Value (USD Million) by Key Actives, 2025-2035
  • Figure 147: East Asia Market Value (USD Million) by Usage Mode, 2025-2035
  • Figure 148: East Asia Market Value (USD Million) by Channel, 2025-2035
  • Figure 149: East Asia Market Value (USD Million) by End User, 2025-2035
  • Figure 150: East Asia Market Value (USD Million) by Country, 2025-2035
  • Figure 151: East Asia Market Value (USD Million) Analysis by Country, 2020-2035
  • Figure 152: East Asia Market Volume (Units) Analysis by Country, 2020-2035
  • Figure 153: East Asia Market Value Share (%) and BPS Analysis by Country, 2025-2035
  • Figure 154: East Asia Market Y-o-Y Growth (%) Projections by Country, 2025-2035
  • Figure 155: East Asia Market Value (USD Million) Analysis by Product Type, 2020-2035
  • Figure 156: East Asia Market Volume (Units) Analysis by Product Type, 2020-2035
  • Figure 157: East Asia Market Value Share (%) and BPS Analysis by Product Type, 2025-2035
  • Figure 158: East Asia Market Y-o-Y Growth (%) Projections by Product Type, 2025-2035
  • Figure 159: East Asia Market Value (USD Million) Analysis by Key Actives, 2020-2035
  • Figure 160: East Asia Market Volume (Units) Analysis by Key Actives, 2020-2035
  • Figure 161: East Asia Market Value Share (%) and BPS Analysis by Key Actives, 2025-2035
  • Figure 162: East Asia Market Y-o-Y Growth (%) Projections by Key Actives, 2025-2035
  • Figure 163: East Asia Market Value (USD Million) Analysis by Usage Mode, 2020-2035
  • Figure 164: East Asia Market Volume (Units) Analysis by Usage Mode, 2020-2035
  • Figure 165: East Asia Market Value Share (%) and BPS Analysis by Usage Mode, 2025-2035
  • Figure 166: East Asia Market Y-o-Y Growth (%) Projections by Usage Mode, 2025-2035
  • Figure 167: East Asia Market Value (USD Million) Analysis by Channel, 2020-2035
  • Figure 168: East Asia Market Volume (Units) Analysis by Channel, 2020-2035
  • Figure 169: East Asia Market Value Share (%) and BPS Analysis by Channel, 2025-2035
  • Figure 170: East Asia Market Y-o-Y Growth (%) Projections by Channel, 2025-2035
  • Figure 171: East Asia Market Value (USD Million) Analysis by End User, 2020-2035
  • Figure 172: East Asia Market Volume (Units) Analysis by End User, 2020-2035
  • Figure 173: East Asia Market Value Share (%) and BPS Analysis by End User, 2025-2035
  • Figure 174: East Asia Market Y-o-Y Growth (%) Projections by End User, 2025-2035
  • Figure 175: East Asia Market Attractiveness by Product Type, 2025-2035
  • Figure 176: East Asia Market Attractiveness by Key Actives, 2025-2035
  • Figure 177: East Asia Market Attractiveness by Usage Mode, 2025-2035
  • Figure 178: East Asia Market Attractiveness by Channel, 2025-2035
  • Figure 179: East Asia Market Attractiveness by End User, 2025-2035
  • Figure 180: East Asia Market Attractiveness by Country, 2025-2035
  • Figure 181: South Asia & Pacific Market Value (USD Million) by Product Type, 2025-2035
  • Figure 182: South Asia & Pacific Market Value (USD Million) by Key Actives, 2025-2035
  • Figure 183: South Asia & Pacific Market Value (USD Million) by Usage Mode, 2025-2035
  • Figure 184: South Asia & Pacific Market Value (USD Million) by Channel, 2025-2035
  • Figure 185: South Asia & Pacific Market Value (USD Million) by End User, 2025-2035
  • Figure 186: South Asia & Pacific Market Value (USD Million) by Country, 2025-2035
  • Figure 187: South Asia & Pacific Market Value (USD Million) Analysis by Country, 2020-2035
  • Figure 188: South Asia & Pacific Market Volume (Units) Analysis by Country, 2020-2035
  • Figure 189: South Asia & Pacific Market Value Share (%) and BPS Analysis by Country, 2025-2035
  • Figure 190: South Asia & Pacific Market Y-o-Y Growth (%) Projections by Country, 2025-2035
  • Figure 191: South Asia & Pacific Market Value (USD Million) Analysis by Product Type, 2020-2035
  • Figure 192: South Asia & Pacific Market Volume (Units) Analysis by Product Type, 2020-2035
  • Figure 193: South Asia & Pacific Market Value Share (%) and BPS Analysis by Product Type, 2025-2035
  • Figure 194: South Asia & Pacific Market Y-o-Y Growth (%) Projections by Product Type, 2025-2035
  • Figure 195: South Asia & Pacific Market Value (USD Million) Analysis by Key Actives, 2020-2035
  • Figure 196: South Asia & Pacific Market Volume (Units) Analysis by Key Actives, 2020-2035
  • Figure 197: South Asia & Pacific Market Value Share (%) and BPS Analysis by Key Actives, 2025-2035
  • Figure 198: South Asia & Pacific Market Y-o-Y Growth (%) Projections by Key Actives, 2025-2035
  • Figure 199: South Asia & Pacific Market Value (USD Million) Analysis by Usage Mode, 2020-2035
  • Figure 200: South Asia & Pacific Market Volume (Units) Analysis by Usage Mode, 2020-2035
  • Figure 201: South Asia & Pacific Market Value Share (%) and BPS Analysis by Usage Mode, 2025-2035
  • Figure 202: South Asia & Pacific Market Y-o-Y Growth (%) Projections by Usage Mode, 2025-2035
  • Figure 203: South Asia & Pacific Market Value (USD Million) Analysis by Channel, 2020-2035
  • Figure 204: South Asia & Pacific Market Volume (Units) Analysis by Channel, 2020-2035
  • Figure 205: South Asia & Pacific Market Value Share (%) and BPS Analysis by Channel, 2025-2035
  • Figure 206: South Asia & Pacific Market Y-o-Y Growth (%) Projections by Channel, 2025-2035
  • Figure 207: South Asia & Pacific Market Value (USD Million) Analysis by End User, 2020-2035
  • Figure 208: South Asia & Pacific Market Volume (Units) Analysis by End User, 2020-2035
  • Figure 209: South Asia & Pacific Market Value Share (%) and BPS Analysis by End User, 2025-2035
  • Figure 210: South Asia & Pacific Market Y-o-Y Growth (%) Projections by End User, 2025-2035
  • Figure 211: South Asia & Pacific Market Attractiveness by Product Type, 2025-2035
  • Figure 212: South Asia & Pacific Market Attractiveness by Key Actives, 2025-2035
  • Figure 213: South Asia & Pacific Market Attractiveness by Usage Mode, 2025-2035
  • Figure 214: South Asia & Pacific Market Attractiveness by Channel, 2025-2035
  • Figure 215: South Asia & Pacific Market Attractiveness by End User, 2025-2035
  • Figure 216: South Asia & Pacific Market Attractiveness by Country, 2025-2035
  • Figure 217: Middle East and Africa Market Value (USD Million) by Product Type, 2025-2035
  • Figure 218: Middle East and Africa Market Value (USD Million) by Key Actives, 2025-2035
  • Figure 219: Middle East and Africa Market Value (USD Million) by Usage Mode, 2025-2035
  • Figure 220: Middle East and Africa Market Value (USD Million) by Channel, 2025-2035
  • Figure 221: Middle East and Africa Market Value (USD Million) by End User, 2025-2035
  • Figure 222: Middle East and Africa Market Value (USD Million) by Country, 2025-2035
  • Figure 223: Middle East and Africa Market Value (USD Million) Analysis by Country, 2020-2035
  • Figure 224: Middle East and Africa Market Volume (Units) Analysis by Country, 2020-2035
  • Figure 225: Middle East and Africa Market Value Share (%) and BPS Analysis by Country, 2025-2035
  • Figure 226: Middle East and Africa Market Y-o-Y Growth (%) Projections by Country, 2025-2035
  • Figure 227: Middle East and Africa Market Value (USD Million) Analysis by Product Type, 2020-2035
  • Figure 228: Middle East and Africa Market Volume (Units) Analysis by Product Type, 2020-2035
  • Figure 229: Middle East and Africa Market Value Share (%) and BPS Analysis by Product Type, 2025-2035
  • Figure 230: Middle East and Africa Market Y-o-Y Growth (%) Projections by Product Type, 2025-2035
  • Figure 231: Middle East and Africa Market Value (USD Million) Analysis by Key Actives, 2020-2035
  • Figure 232: Middle East and Africa Market Volume (Units) Analysis by Key Actives, 2020-2035
  • Figure 233: Middle East and Africa Market Value Share (%) and BPS Analysis by Key Actives, 2025-2035
  • Figure 234: Middle East and Africa Market Y-o-Y Growth (%) Projections by Key Actives, 2025-2035
  • Figure 235: Middle East and Africa Market Value (USD Million) Analysis by Usage Mode, 2020-2035
  • Figure 236: Middle East and Africa Market Volume (Units) Analysis by Usage Mode, 2020-2035
  • Figure 237: Middle East and Africa Market Value Share (%) and BPS Analysis by Usage Mode, 2025-2035
  • Figure 238: Middle East and Africa Market Y-o-Y Growth (%) Projections by Usage Mode, 2025-2035
  • Figure 239: Middle East and Africa Market Value (USD Million) Analysis by Channel, 2020-2035
  • Figure 240: Middle East and Africa Market Volume (Units) Analysis by Channel, 2020-2035
  • Figure 241: Middle East and Africa Market Value Share (%) and BPS Analysis by Channel, 2025-2035
  • Figure 242: Middle East and Africa Market Y-o-Y Growth (%) Projections by Channel, 2025-2035
  • Figure 243: Middle East and Africa Market Value (USD Million) Analysis by End User, 2020-2035
  • Figure 244: Middle East and Africa Market Volume (Units) Analysis by End User, 2020-2035
  • Figure 245: Middle East and Africa Market Value Share (%) and BPS Analysis by End User, 2025-2035
  • Figure 246: Middle East and Africa Market Y-o-Y Growth (%) Projections by End User, 2025-2035
  • Figure 247: Middle East and Africa Market Attractiveness by Product Type, 2025-2035
  • Figure 248: Middle East and Africa Market Attractiveness by Key Actives, 2025-2035
  • Figure 249: Middle East and Africa Market Attractiveness by Usage Mode, 2025-2035
  • Figure 250: Middle East and Africa Market Attractiveness by Channel, 2025-2035
  • Figure 251: Middle East and Africa Market Attractiveness by End User, 2025-2035
  • Figure 252: Middle East and Africa Market Attractiveness by Country, 2025-2035

Frequently Asked Questions

How big is the Draining Cellulite Treatments Market in 2025?

The global Draining Cellulite Treatments Market is estimated to be valued at USD 2,151.3 million in 2025.

What will be the size of Draining Cellulite Treatments Market in 2035?

The market size for the Draining Cellulite Treatments Market is projected to reach USD 4,705.8 million by 2035.

How much will be the Draining Cellulite Treatments Market growth between 2025 and 2035?

The Draining Cellulite Treatments Market is expected to grow at a 8.1 % CAGR between 2025 and 2035.

What are the key product types in the Draining Cellulite Treatments Market?

The key product types in the Draining Cellulite Treatments Market are gel creams, serum concentrates, massage oils, and cryo/thermo roll-ons.

Which range segment to contribute significant share in the Draining Cellulite Treatments Market in 2025?

In terms of usage mode, the daily home-care segment is expected to command a significant share of 57.3% in the Draining Cellulite Treatments Market in 2025, driven by growing consumer preference for convenient, at-home treatment regimens and consistent self-care routines.

Explore Similar Insights

Future Market Insights

Draining Cellulite Treatments Market

Chat With MaRIA

Chat With

MaRIA

Hi There, I am MaRIA, Your Market Research Intelligence Assistant. How may I help you?