Sol-Gel Based Skin Treatments Market Size and Share Forecast Outlook 2025 to 2035

The global Sol-Gel Based Skin Treatments Market is expected to record a valuation of USD 1,102.9 million in 2025 and USD 3,950.3 million in 2035, with an increase of USD 2,847.4 million, which equals a growth of more than 258% over the decade. The overall expansion represents a CAGR of 13.6% and a more than 3X increase in market size.
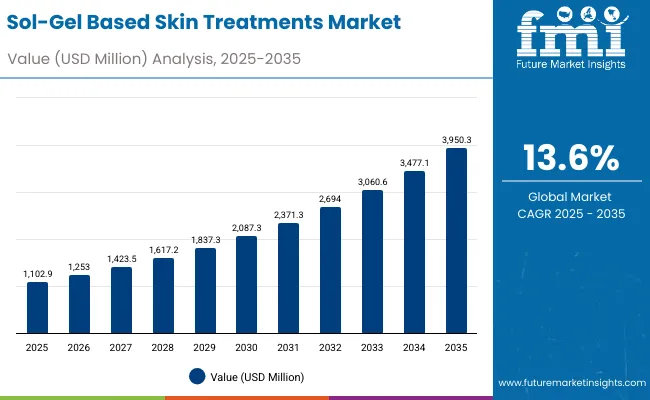
Quick Stats for Global Sol-Gel Based Skin Treatments Market

  • Sol-Gel Based Skin Treatments Market Value (2025): USD 1,102.9 million
  • Sol-Gel Based Skin Treatments Market Forecast Value (2035): USD 3,950.3 million
  • Sol-Gel Based Skin Treatments Market Forecast CAGR: 13.6%
  • Leading Segment in 2025: Clinical-grade Claims (53.3%)
  • Key Growth Regions: China, India, Japan, USA, Germany, UK
  • Top Key Players: BASF, Evonik, Ashland, Clariant, Croda, Sol-Gel Technologies, DSM-Firmenich, Seppic, Givaudan, Symrise

Sol Gel Based Skin Treatments Market

Global Sol-Gel Based Skin Treatments Market Key Takeaways

Metric Value
Global Sol-Gel Based Skin Treatments Market Estimated Value in (2025E) USD 1,102.9 million
Global Sol-Gel Based Skin Treatments Market Forecast Value in (2035F) USD 3,950.3 million
Forecast CAGR (2025 to 2035) 13.6%

During the first five-year period from 2025 to 2030, the market increases from USD 1,102.9 million to USD 2,087.3 million, adding USD 984.4 million, which accounts for 34.5% of the total decade growth. This phase records steady adoption in clinical-grade formulations, encapsulated vitamins, and dermatologist-tested hydration systems, driven by rising demand for scientifically backed skin treatments. Serums dominate this period as they cater to nearly 48.8% of applications, offering targeted delivery of sol-gel encapsulated actives like vitamin C and peptides.

The second half from 2030 to 2035 contributes USD 1,863.0 million, equal to 65.5% of total growth, as the market jumps from USD 2,087.3 million to USD 3,950.3 million. This acceleration is powered by widespread deployment of premium e-commerce platforms, adoption of clean-label sol-gel sunscreens, and integration of peptides and minerals in clinical-grade dermatology clinic offerings. Asian countries including China (20.8% CAGR) and India (23.9% CAGR) push expansion as consumers in these regions shift from conventional topicals to advanced nanostructured sol-gel formulations. Digital retailing strategies further expand access, making e-commerce a strong growth channel by the end of the decade.

From 2020 to 2024, the global Sol-Gel Based Skin Treatments Market grew steadily from a niche science-driven category to an emerging dermatology-aligned solution segment, fueled by hardware-like precision in sol-gel encapsulation and clinical claims. During this period, the competitive landscape was dominated by chemical majors such as BASF, Evonik, and Croda, which together accounted for a significant share of innovation pipelines, focusing on sol-gel matrices for encapsulation and UV-filtering gels. Competitive differentiation relied on sustained release, skin penetration efficiency, and multi-active delivery systems. Service-oriented models, such as dermatology clinic treatments, were still under 10% of value share, while pharmacies and premium retail slowly began adopting sol-gel infused products.

Demand for sol-gel based skin treatments will expand to USD 1,102.9 million in 2025, and the revenue mix will shift as clinical-grade and dermatologist-tested claims rise above 55% share by 2035. Traditional chemical leaders face competition from biotech-driven entrants integrating plant extract sol-gels, vegan claims, and clean-label positioning. Major established players are pivoting to hybrid models, merging chemical expertise with biotech formulations and skin microbiome research. Emerging companies focusing on UV-protective gels, hydration systems, and eco-conscious vegan sol-gel actives are capturing market attention. The competitive advantage is moving away from basic formulation supply towards ecosystem strength, integration with clinical dermatology, and consumer trust in premium beauty retail.

Why the Global Sol-Gel Based Skin Treatments Market is Growing?

Advances in sol-gel encapsulation science have improved stability, skin penetration, and release control, allowing for more efficient delivery of vitamins, peptides, and plant extracts. Clinical-grade products are gaining popularity due to their suitability for long-lasting, dermatologist-tested results. The rise of sol-gel based UV-filtering gels and hydration systems has contributed to enhanced consumer trust in performance-oriented treatments. Industries such as dermatology, cosmeceuticals, and premium skincare are driving demand for solutions that can integrate seamlessly into professional and consumer workflows.

Expansion of dermatology clinic procedures and premium e-commerce distribution has fueled market growth. Innovations in sol-gel structured serums, patches, and sunscreens are expected to open new application areas. Segment growth is expected to be led by clinical-grade claims, encapsulation and sustained release functions, and serum-based products due to their precision, adaptability, and higher consumer acceptance in anti-aging and skin protection regimes.

Segmental Analysis

The market is segmented by function, active type, product type, channel, and claim. Functions include encapsulation & sustained release, barrier formation, UV-filtering gels, and hydration systems, highlighting the core science behind consumer adoption. Active type classification covers vitamins (C, E, retinoids), peptides, minerals & oxides, and plant extracts, which represent the biologically active portfolio driving differentiation. Based on product type, segmentation includes creams/lotions, serums, patches/masks, and sunscreens to cater to diverse consumer needs.

By channel, categories include dermatology clinics, e-commerce, premium beauty retail, and pharmacies, showcasing the hybrid professional-consumer pathway. Claims include clinical-grade, dermatologist-tested, vegan, and clean-label, aligning with shifting consumer expectations. Regionally, the scope spans North America, Europe, Asia-Pacific, Latin America, and Middle East & Africa, with leading countries being the USA, China, India, Japan, UK, and Germany.
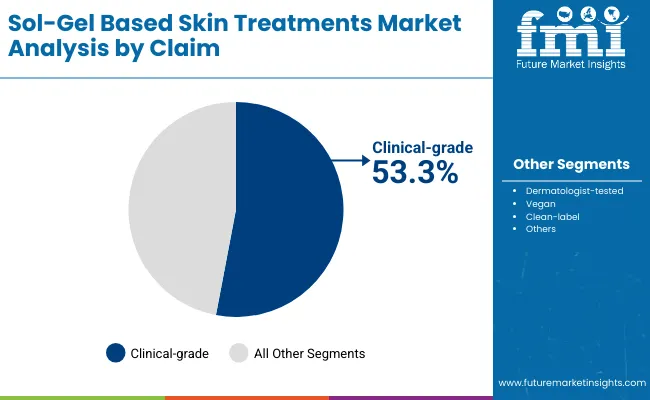
Insights into the Claim Segment with Clinical-grade Leading in Market Share

Sol Gel Based Skin Treatments Market By Claim

Claim Value Share% 2025
Clinical-grade 53.3%
Others 46.7%

The clinical-grade segment is projected to contribute 53.3% of global Sol-Gel Based Skin Treatments Market revenue in 2025, maintaining its lead as the dominant claim category. This is driven by consumer demand for dermatologist-backed efficacy, regulatory trust, and the expansion of professional dermatology clinics prescribing sol-gel based therapies. Growth is supported by rising consumer inclination toward skin safety, high-potency results, and premium product positioning. By 2035, clinical-grade claims are expected to remain dominant due to their alignment with cosmeceutical credibility and medical skincare adoption.
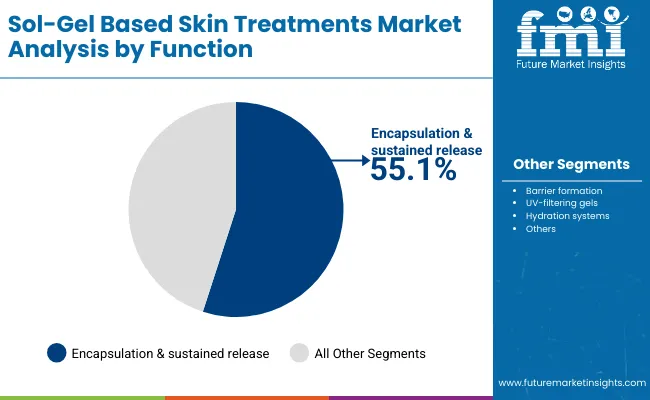
Insights into the Function Segment with Encapsulation & Sustained Release Dominating the Demand

Sol Gel Based Skin Treatments Market By Function

Function Value Share% 2025
Encapsulation & sustained release 55.1%
Others 48.5%

The encapsulation and sustained release function is forecasted to hold 55.1% of market share in 2025, led by its role in protecting sensitive actives like vitamin C and peptides from degradation and ensuring prolonged release on the skin surface. These systems enhance treatment efficacy and reduce irritation risks, making them highly sought after in premium formulations. As sol-gel research advances, encapsulation is expected to dominate not just serums and creams but also patches, masks, and sunscreens, extending consumer trust across categories.
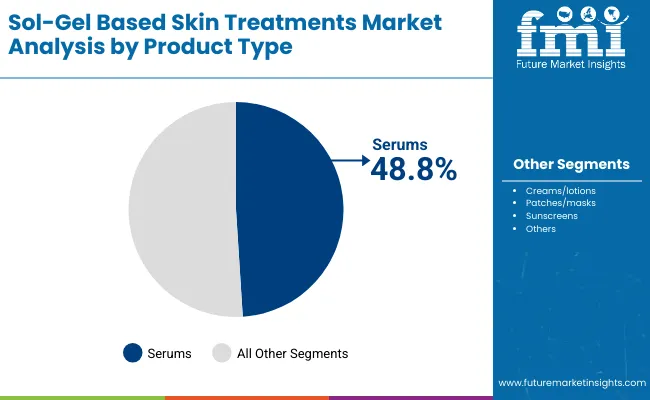
Insights into the Product Type Segment with Serums Dominating the Market

Sol Gel Based Skin Treatments Market By Product Type

Product Type Value Share% 2025
Serums 48.8%
Others 51.2%

The serum segment is projected to account for 48.8% of global Sol-Gel Based Skin Treatments Market revenue in 2025, establishing itself as the leading product type. Serums are preferred for their lightweight textures, concentrated actives, and faster absorption, making them ideal for anti-aging, hydration, and brightening treatments. Sol-gel delivery enhances stability and potency of vitamins, peptides, and minerals within serum formulations. With consumers demanding visible and measurable results, serums are expected to retain their leadership in the product type category through 2035.

What are the Drivers, Restraints, and Key Trends of the Global Sol-Gel Based Skin Treatments Market?

Drivers

Clinical-Grade Validation Driving Dermatology Integration

One of the strongest drivers of the global Sol-Gel Based Skin Treatments Market is the increasing adoption of clinical-grade validation and dermatologist endorsement. In your data, clinical-grade already represents 53.3% of market value in 2025 (USD 588.9 Mn). Unlike traditional cosmetics that rely on consumer perception, sol-gel formulations are being integrated into dermatology clinics where scientific evidence, sustained-release encapsulation, and high stability of actives such as vitamin C and retinoids are critical. This driver is particularly strong in the USA and Germany, where regulatory oversight and consumer preference for dermatologist-tested products are higher. Clinical validation not only drives trust and premium pricing but also positions sol-gel products as a bridge between cosmetics and medical skincare (cosmeceuticals), expanding market penetration into prescription-based treatments and professional channels.

Encapsulation & Sustained Release Enabling Next-Generation Product Innovation

The second major driver is the technological capability of sol-gel matrices to encapsulate unstable actives and release them gradually, which directly explains why this function holds 51.5% share in 2025 (USD 566.7 Mn). Ingredients such as vitamin C, peptides, and retinoids traditionally degrade quickly in topical formulations. With sol-gel, these actives retain potency for longer and are released in a controlled manner, reducing side effects like irritation while enhancing therapeutic outcomes. This has enabled innovation in serums, patches, and sunscreens, which are top growth categories. In Asia-Pacific, particularly China and Japan, this driver is even more pronounced because consumers seek multi-functional products that deliver efficacy without compromising skin sensitivity. Controlled release also allows brands to justify premium price points, enhancing profitability across both retail and clinical channels.

Restraints

High Cost of Manufacturing and Scale-Up Barriers

Despite strong demand, sol-gel processing remains expensive and technically complex compared to conventional emulsion-based skincare. The need for specialized equipment, high-purity precursors, and stringent stability testing increases costs, making products significantly pricier than mass-market alternatives. This cost factor restricts penetration into pharmacies and mass beauty retail channels, where consumers are highly price-sensitive. While premium retail and e-commerce channels absorb the higher costs, scalability remains a challenge in emerging markets such as India where demand is high but willingness to pay for premium-priced treatments is limited. The cost barrier slows down mass adoption and restricts sol-gel products to higher-income consumer groups and clinical applications.

Regulatory Ambiguity in Functional Claims

Another restraint is the unclear regulatory classification of sol-gel formulations across different markets. In the USA, products marketed as “clinical-grade” often face scrutiny from the FDA if positioned too close to therapeutic claims, while in Europe, sol-gel sunscreens and UV-filtering gels face rigorous safety and labeling requirements under the EU Cosmetics Regulation. This creates compliance costs and delays in product launches, particularly for smaller companies. Furthermore, claims such as “sustained release” or “encapsulation technology” are not standardized for cosmetic regulations, leaving brands vulnerable to legal challenges or consumer skepticism if efficacy data is not transparent. This restraint may slow adoption in regions with strict oversight such as the USA and Germany, even as Asia-Pacific moves ahead with faster commercialization.

Key Trends

Rise of Vegan and Clean-Label Sol-Gel Skincare

While clinical-grade dominates the market today, there is a growing consumer shift toward vegan and clean-label formulations, particularly in e-commerce and premium retail channels. Vegan claims align with sustainability and ethical sourcing, while clean-label aligns with consumer demand for transparency in ingredient lists. Brands are increasingly experimenting with plant extract sol-gels and mineral oxides that not only meet ethical standards but also leverage sol-gel encapsulation to enhance performance. In markets like the UK and Japan, vegan sol-gel sunscreens and serums are gaining early traction as a differentiation strategy. This trend is expected to grow strongly by 2030, offering mid-tier players a route to compete against giants like BASF and Evonik by targeting eco-conscious and younger demographics.

E-Commerce as the Fastest-Growing Distribution Channel

Although dermatology clinics remain the trust anchor for clinical-grade sol-gel treatments, e-commerce is emerging as the fastest-growing channel, especially in Asia-Pacific and North America. Platforms like Tmall, Sephora online, and direct-to-consumer websites are increasingly offering serums, patches, and sunscreens with sol-gel technology, supported by AI-based skin analysis tools and subscription models. This trend is fueled by the ability of e-commerce to educate consumers about complex technologies like encapsulation and controlled release through digital content and influencer marketing. For China, which is already posting a 20.8% CAGR, this channel is a catalyst for mass adoption, while in the USA, premium e-commerce is helping push dermatologist-tested sol-gel serums to wider audiences. By 2035, e-commerce could rival clinics in revenue share, particularly for vegan and clean-label sol-gel lines.
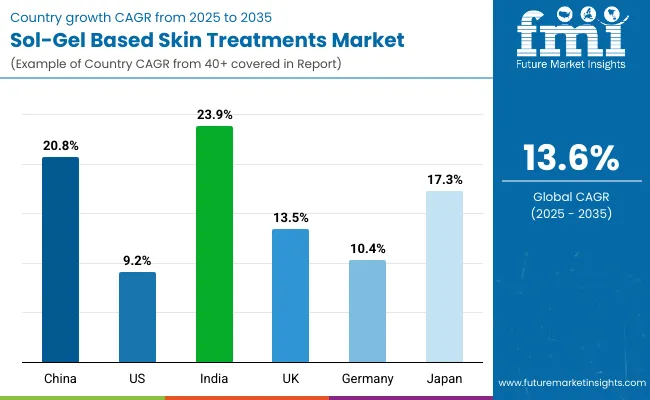
Analysis of Global Sol-Gel Based Skin Treatments Market By Key Countries

Country Wise Analysis Sol Gel Based Skin Treatments Market

Countries Estimated CAGR (2025 to 2035)
China 20.8%
USA 9.2%
India 23.9%
UK 13.5%
Germany 10.4%
Japan 17.3%

Between 2025 and 2035, the global Sol-Gel Based Skin Treatments Market will see emerging Asian markets leading growth trajectories. India stands out with the highest CAGR of 23.9%, supported by rapid urbanization, a young consumer base, and increasing awareness of premium skincare. The shift from conventional herbal formulations to advanced sol-gel encapsulated actives like vitamin C and peptides is fueling premium adoption. China, with a 20.8% CAGR, is leveraging its strong e-commerce dominance and high consumer acceptance of technologically advanced beauty products. Domestic players are partnering with global chemical majors to deliver localized sol-gel serums, sunscreens, and hydration systems tailored for sensitive skin concerns such as pollution-related damage. Japan also records a robust 17.3% CAGR, driven by its tradition of high-tech skincare innovation, where consumers prefer products with proven clinical backing and long-term efficacy. Together, these Asian markets will account for the fastest acceleration of global value, making the region the epicenter of sol-gel skincare innovation by 2035.

In contrast, mature Western markets grow at a more measured pace. The USA will post a 9.2% CAGR, reflecting steady expansion through clinical-grade sol-gel treatments offered in dermatology clinics and premium beauty retail. While the market value is large, growth is tempered by regulatory scrutiny and a slower shift toward mass consumer adoption. The UK, with 13.5% CAGR, benefits from rising consumer preference for vegan and clean-label sol-gel products, aligning with broader sustainability-driven purchasing behavior. Germany, at 10.4% CAGR, is anchored by its strong pharmacy channel and strict regulatory environment, ensuring that only clinically validated formulations achieve traction. Western Europe is therefore expected to remain a stable but slower-growth market, compared to Asia’s rapid expansion, with innovation focused more on compliance, clinical credibility, and premium positioning.
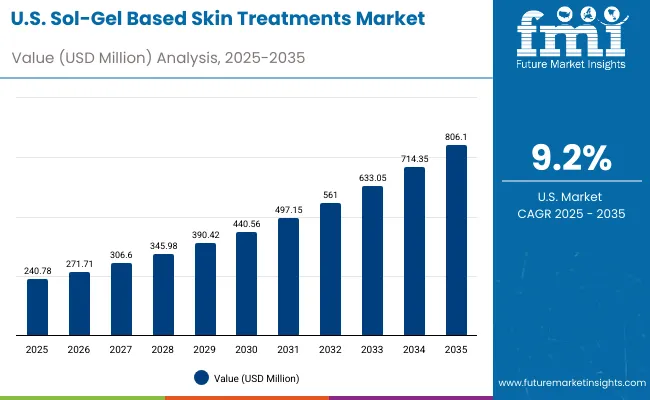
Sales Outlook for Sol-Gel Based Skin Treatments in the United States

Usa Sol Gel Based Skin Treatments Market

Year USA Sol-Gel Based Skin Treatments Market (USD Million)
2025 240.78
2026 271.71
2027 306.60
2028 345.98
2029 390.42
2030 440.56
2031 497.15
2032 561.00
2033 633.05
2034 714.35
2035 806.10

The global Sol-Gel Based Skin Treatments Market in the United States is projected to grow at a CAGR of 9.2%, led by strong adoption of clinical-grade and dermatologist-tested formulations. Clinical validation has been the anchor of growth, with clinical-grade claims already accounting for 55.1% share in 2025 (USD 132.8 Mn). Dermatology clinics are driving early adoption of sol-gel encapsulated serums and sunscreens for anti-aging, acne management, and photoprotection. The USA consumer base values clinical efficacy and transparency, pushing companies to invest in peer-reviewed studies and FDA-compliant claims. Pharmacies and premium beauty retailers are expanding shelf space for sol-gel hydration systems and patches that demonstrate measurable results.

  • Clinical-grade claims remain the leading driver of consumer trust in USA skincare.
  • Dermatology clinics are scaling adoption of encapsulated vitamins and peptides.
  • Pharmacies and premium retail chains are introducing sol-gel sunscreens as safer, stable UV solutions.

Growth and Expansion Outlook for Sol-Gel Based Skin Treatments in the United Kingdom

The global Sol-Gel Based Skin Treatments Market in the United Kingdom is expected to grow at a CAGR of 13.5%, supported by increasing consumer preference for vegan and clean-label formulations. The UK is a hub for sustainability-conscious consumers, where plant extract sol-gel serums and mineral oxide sunscreens are gaining traction. Premium retail and e-commerce platforms such as Selfridges and Lookfantastic have accelerated product visibility, while dermatologists are increasingly recommending sol-gel hydration systems for sensitive skin types. Local demand is also being influenced by strong regulation of ingredient transparency and cruelty-free claims, reinforcing growth in vegan-certified sol-gel solutions.

  • Clean-label and vegan claims are reshaping consumer choice in sol-gel formulations.
  • Premium retail and e-commerce are expanding access to sol-gel infused serums and sunscreens.
  • Dermatologists emphasize hydration systems for skin safety, broadening clinical adoption.

Growth and Expansion Outlook for Sol-Gel Based Skin Treatments in India

India is witnessing the fastest expansion globally, with the Sol-Gel Based Skin Treatments Market forecast to grow at a CAGR of 23.9% through 2035. Rising middle-class incomes, beauty-conscious youth demographics, and growing urbanization are accelerating demand for advanced formulations. Indian consumers are moving from traditional ayurvedic products to premium sol-gel based serums and patches due to their visible performance in brightening, hydration, and sun protection. Cost-effective launches are penetrating tier-2 and tier-3 cities, where e-commerce platforms are key distribution enablers. Additionally, dermatology clinics in metros are increasingly adopting clinical-grade sol-gel treatments for pigmentation and acne therapy, supported by a surge in cosmetic dermatology demand.

  • Tier-2 cities are witnessing strong adoption of cost-efficient sol-gel formulations.
  • Serums and sunscreens are leading product demand, fueled by e-commerce channels.
  • Dermatology clinics are adopting sol-gel based acne and pigmentation therapies.

Sales Outlook for Sol-Gel Based Skin Treatments in China

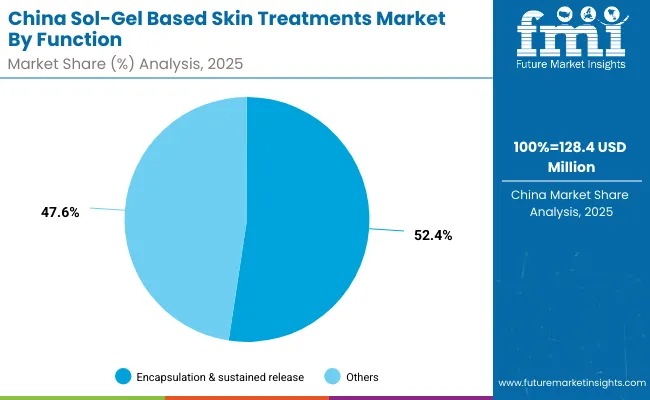
The global Sol-Gel Based Skin Treatments Market in China is projected to expand at a CAGR of 20.8%, the highest among leading economies after India. Growth is powered by e-commerce leadership, smart retail ecosystems, and rising adoption of high-tech beauty solutions. Encapsulation and sustained release functions already account for 52.4% share in 2025 (USD 67.4 Mn), showing that Chinese consumers value advanced delivery technologies that prolong the efficacy of vitamins and peptides. Domestic brands are competing with global majors by offering affordable sol-gel serums and sunscreens, while premium consumers gravitate toward dermatologist-tested solutions with international credibility. The rise of digital-native beauty brands on platforms like Tmall and Douyin is accelerating mass awareness of sol-gel formulations, making China a high-volume growth driver.
  • E-commerce and digital-native brands are central to sol-gel adoption in China.
  • Encapsulation technology leads the function segment, reflecting demand for high-tech beauty.
  • Affordable local launches and premium global imports together accelerate growth momentum.

Growth Outlook for Sol-Gel Based Skin Treatments Market in the United States

Usa Sol Gel Based Skin Treatments Market By Claim

USA by Claim Value Share% 2025
Clinical-grade 55.1%
Others 44.9%

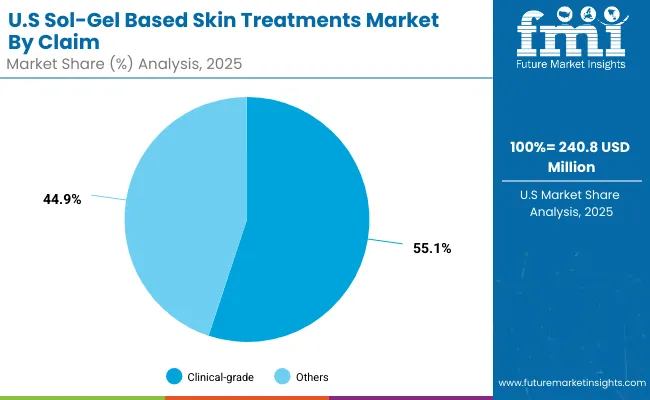
The global Sol-Gel Based Skin Treatments Market in the United States is valued at USD 240.8 million in 2025, growing at a CAGR of 9.2%. Clinical-grade formulations hold a clear lead with 55.1% market share (USD 132.8 Mn), supported by strong demand for dermatologist-tested serums, sunscreens, and hydration systems. This dominance reflects the USA consumer emphasis on efficacy and safety, where dermatologist recommendations and FDA-compliant claims strongly influence purchasing decisions. Pharmacies and dermatology clinics are the main distribution pillars, while premium beauty retailers and e-commerce channels provide expansion into lifestyle-driven skincare adoption.

The USA market outlook is shaped by rising integration of sol-gel encapsulated vitamins, peptides, and oxides into professional treatments. These are increasingly used for anti-aging, acne, and pigmentation management, demonstrating measurable clinical outcomes. Furthermore, dermatologist-tested vegan and clean-label sol-gel serums are gaining traction among younger demographics seeking a balance of science and sustainability. By 2035, the USA is expected to remain a high-value but steady-growth market, dominated by clinical validation and strict regulatory compliance.
  • USA holds a 21.8% share of the global market in 2025.
  • Clinical-grade claims dominate at 55.1% vs 44.9%.
  • Growth is supported by dermatology clinic adoption and FDA-compliant positioning.

Opportunity Analysis of China Sol-Gel Based Skin Treatments Market

China Sol Gel Based Skin Treatments Market By Function

China by Function Value Share% 2025
Encapsulation & sustained release 52.4%
Others 47.6%

The global Sol-Gel Based Skin Treatments Market in China is valued at USD 128.4 million in 2025, with encapsulation and sustained release leading at 52.4% (USD 67.4 Mn). China is projected to grow at a CAGR of 20.8%, one of the fastest globally. The dominance of encapsulation is directly tied to consumer expectations for potent yet gentle skincare, where stability of vitamins and peptides under high pollution and UV exposure conditions is a priority. Chinese consumers, especially in Tier-1 cities, are highly receptive to advanced delivery systems and clinical-science claims, accelerating adoption of sol-gel serums and sunscreens.

The market opportunity is further expanded by e-commerce ecosystems such as Tmall, JD.com, and Douyin, where sol-gel infused products are marketed with strong scientific storytelling and influencer advocacy. Local brands are competing with global majors by introducing cost-effective sol-gel sunscreens and hydration masks, while premium imports attract affluent consumers demanding dermatologist-tested or clean-label claims. By 2035, China is set to outpace Western markets in growth share, becoming one of the core global hubs for sol-gel skincare innovation.
  • Market size in China is USD 128.4 million in 2025.
  • Encapsulation & sustained release leads at 52.4% vs 47.6%.
  • Growth is driven by e-commerce ecosystems, Tier-1 urban demand, and high-tech brand positioning.

Competitive Landscape of the Global Sol-Gel Based Skin Treatments Market

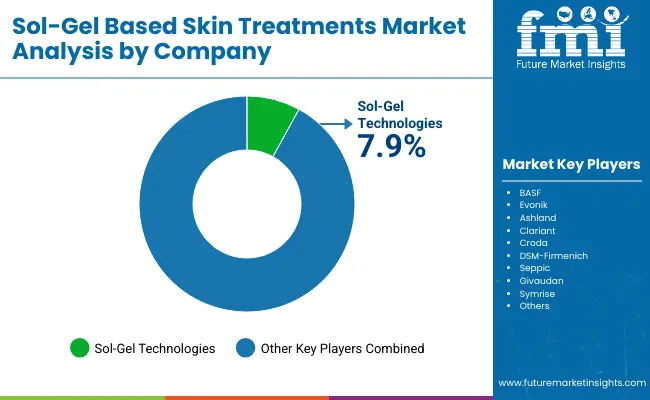
Sol Gel Based Skin Treatments Market By Company

Company Global Value Share 2025
Sol-Gel Technologies 7.9%
Others 92.1%

The global Sol-Gel Based Skin Treatments Market is moderately fragmented, with chemical majors, biotech innovators, and niche cosmeceutical specialists competing across claims, functions, and product categories. Sol-Gel Technologies holds a visible lead with 7.9% global share in 2025, leveraging proprietary expertise in encapsulation and sustained release systems for clinical dermatology. Their pipeline includes advanced serums and sunscreen prototypes that are gaining traction in both the USA and European markets.

Global chemical leaders such as BASF, Evonik, Croda, Ashland, DSM-Firmenich, and Clariant drive scale through raw material expertise, focusing on sol-gel precursors and active delivery platforms. These players are actively positioning themselves as backbone suppliers for global premium skincare brands, integrating sol-gel science into broader cosmeceutical formulations. Mid-sized innovators like Seppic, Givaudan, and Symrise emphasize plant extract sol-gel systems and vegan/clean-label formulations, targeting e-commerce-driven beauty brands in Asia-Pacific.

Competitive differentiation is increasingly shifting away from chemical supply alone to integrated ecosystems, combining sol-gel encapsulation with clinical validation, consumer-friendly claims (dermatologist-tested, vegan, clean-label), and multichannel distribution strategies. Partnerships between dermatology clinics and premium retailers are creating exclusive sol-gel product lines, while biotech entrants are carving space by combining sol-gel technology with microbiome research and AI-driven personalized skincare.

Key Developments in Global Sol-Gel Based Skin Treatments Market

  • On February 6, 2025, BASF announced the expansion of its sol-gel based skincare ingredient line in North America, introducing encapsulated vitamin C systems designed for dermatologist-tested formulations in anti-aging serums.
  • On November 15, 2024, Evonik launched a new sol-gel encapsulation platform under its Care Solutions division, enabling sustained release of peptides for clinical-grade cosmeceuticals. The company highlighted its role in premium serums and sunscreens targeted at Asian markets.

Scope of the Report

Item Value
Quantitative Units USD 1,102.9 Million
Function Encapsulation & sustained release, Barrier formation, UV-filtering gels, Hydration systems
Active Type Vitamins (C, E, retinoids), Peptides, Minerals & oxides, Plant extracts
Product Type Creams/lotions, Serums, Patches/masks, Sunscreens
Channel Dermatology clinics, E-commerce, Premium beauty retail, Pharmacies
Claim Clinical-grade, Dermatologist-tested, Vegan, Clean-label
Regions Covered North America, Europe, Asia-Pacific, Latin America, Middle East & Africa
Country Covered United States, Canada, Germany, France, United Kingdom, China, Japan, India, Brazil, South Africa
Key Companies Profiled BASF, Evonik, Ashland, Clariant, Croda, Sol-Gel Technologies, DSM- Firmenich, Seppic, Givaudan, Symrise
Additional Attributes Dollar sales by claim, function, and product type; rising adoption in dermatology clinics and premium retail; e-commerce penetration driving vegan and clean-label launches; encapsulation innovation in vitamins and peptides; regional differences in clinical-grade adoption; growing demand for sol-gel sunscreens in high-UV markets; active R&D in encapsulation stability; sustained release systems as innovation pipelines; mergers and partnerships between chemical majors and skincare brands.

Key Segmentation

By Function:

  • Encapsulation & sustained release
  • Barrier formation
  • UV-filtering gels
  • Hydration systems

By Active Type:

  • Vitamins (C, E, retinoids)
  • Peptides
  • Minerals & oxides
  • Plant extracts

By Product Type:

  • Creams/lotions
  • Serums
  • Patches/masks
  • Sunscreens

By Channel:

  • Dermatology clinics
  • E-commerce
  • Premium beauty retail
  • Pharmacies

By Claim:

  • Clinical-grade
  • Dermatologist-tested
  • Vegan
  • Clean-label

By Region:

  • North America
  • Latin America
  • Europe
  • East Asia
  • South Asia & Pacific
  • Middle East and Africa

Table of Content

  1. Executive Summary
    • Global Market Outlook
    • Demand-side Trends
    • Supply-side Trends
    • Technology Roadmap Analysis
    • Analysis and Recommendations
  2. Market Overview
    • Market Coverage / Taxonomy
    • Market Definition / Scope / Limitations
  3. Market Background
    • Market Dynamics
      • Drivers
      • Restraints
      • Opportunity
      • Trends
    • Scenario Forecast
      • Demand in Optimistic Scenario
      • Demand in Likely Scenario
      • Demand in Conservative Scenario
    • Opportunity Map Analysis
    • Product Life Cycle Analysis
    • Supply Chain Analysis
    • Investment Feasibility Matrix
    • Value Chain Analysis
    • PESTLE and Porter’s Analysis
    • Regulatory Landscape
    • Regional Parent Market Outlook
    • Production and Consumption Statistics
    • Import and Export Statistics
  4. Global Analysis 2020 to 2024 and Forecast, 2025 to 2035
    • Historical Market Size Value (USD Million) Analysis, 2020 to 2024
    • Current and Future Market Size Value (USD Million) Projections, 2025 to 2035
      • Y-o-Y Growth Trend Analysis
      • Absolute $ Opportunity Analysis
  5. Global Pricing Analysis 2020 to 2024 and Forecast 2025 to 2035
  6. Global Analysis 2020 to 2024 and Forecast 2025 to 2035, By Function
    • Introduction / Key Findings
    • Historical Market Size Value (USD Million) Analysis By Function, 2020 to 2024
    • Current and Future Market Size Value (USD Million) Analysis and Forecast By Function, 2025 to 2035
      • Encapsulation & sustained release
      • Barrier formation
      • UV-filtering gels
      • Hydration systems
    • Y-o-Y Growth Trend Analysis By Function, 2020 to 2024
    • Absolute $ Opportunity Analysis By Function, 2025 to 2035
  7. Global Analysis 2020 to 2024 and Forecast 2025 to 2035, By Active Type
    • Introduction / Key Findings
    • Historical Market Size Value (USD Million) Analysis By Active Type, 2020 to 2024
    • Current and Future Market Size Value (USD Million) Analysis and Forecast By Active Type, 2025 to 2035
      • Vitamins (C, E, retinoids)
      • Peptides
      • Minerals & oxides
      • Plant extracts
    • Y-o-Y Growth Trend Analysis By Active Type, 2020 to 2024
    • Absolute $ Opportunity Analysis By Active Type, 2025 to 2035
  8. Global Analysis 2020 to 2024 and Forecast 2025 to 2035, By Product Type
    • Introduction / Key Findings
    • Historical Market Size Value (USD Million) Analysis By Product Type, 2020 to 2024
    • Current and Future Market Size Value (USD Million) Analysis and Forecast By Product Type, 2025 to 2035
      • Creams/lotions
      • Serums
      • Patches/masks
      • Sunscreens
    • Y-o-Y Growth Trend Analysis By Product Type, 2020 to 2024
    • Absolute $ Opportunity Analysis By Product Type, 2025 to 2035
  9. Global Analysis 2020 to 2024 and Forecast 2025 to 2035, By Channel
    • Introduction / Key Findings
    • Historical Market Size Value (USD Million) Analysis By Channel, 2020 to 2024
    • Current and Future Market Size Value (USD Million) Analysis and Forecast By Channel, 2025 to 2035
      • Dermatology clinics
      • E-commerce
      • Premium beauty retail
      • Pharmacies
    • Y-o-Y Growth Trend Analysis By Channel, 2020 to 2024
    • Absolute $ Opportunity Analysis By Channel, 2025 to 2035
  10. Global Analysis 2020 to 2024 and Forecast 2025 to 2035, By Claim
    • Introduction / Key Findings
    • Historical Market Size Value (USD Million) Analysis By Claim, 2020 to 2024
    • Current and Future Market Size Value (USD Million) Analysis and Forecast By Claim, 2025 to 2035
      • Clinical-grade
      • Dermatologist-tested
      • Vegan
      • Clean-label
    • Y-o-Y Growth Trend Analysis By Claim, 2020 to 2024
    • Absolute $ Opportunity Analysis By Claim, 2025 to 2035
  11. Global Analysis 2020 to 2024 and Forecast 2025 to 2035, By Region
    • Introduction
    • Historical Market Size Value (USD Million) Analysis By Region, 2020 to 2024
    • Current Market Size Value (USD Million) Analysis and Forecast By Region, 2025 to 2035
      • North America
      • Latin America
      • Europe
      • East Asia
      • South Asia & Pacific
      • Middle East and Africa
    • Market Attractiveness Analysis By Region
  12. North America Analysis 2020 to 2024 and Forecast 2025 to 2035, By Country
    • Historical Market Size Value (USD Million) Trend Analysis By Market Taxonomy, 2020 to 2024
    • Market Size Value (USD Million) Forecast By Market Taxonomy, 2025 to 2035
      • By Country
        • U.S.
        • Canada
      • By Function
      • By Active Type
      • By Product Type
      • By Channel
      • By Claim
    • Market Attractiveness Analysis
      • By Country
      • By Function
      • By Active Type
      • By Product Type
      • By Channel
      • By Claim
    • Key Takeaways
  13. Latin America Analysis 2020 to 2024 and Forecast 2025 to 2035, By Country
    • Historical Market Size Value (USD Million) Trend Analysis By Market Taxonomy, 2020 to 2024
    • Market Size Value (USD Million) Forecast By Market Taxonomy, 2025 to 2035
      • By Country
        • Brazil
        • Mexico
        • Colombia
        • Rest of Latin America
      • By Function
      • By Active Type
      • By Product Type
      • By Channel
      • By Claim
    • Market Attractiveness Analysis
      • By Country
      • By Function
      • By Active Type
      • By Product Type
      • By Channel
      • By Claim
    • Key Takeaways
  14. Europe Analysis 2020 to 2024 and Forecast 2025 to 2035, By Country
    • Historical Market Size Value (USD Million) Trend Analysis By Market Taxonomy, 2020 to 2024
    • Market Size Value (USD Million) Forecast By Market Taxonomy, 2025 to 2035
      • By Country
        • Germany
        • U.K.
        • France
        • Italy
        • Spain
        • Belgium
        • Netherlands
        • Nordic
        • Switzerland
        • Russia
        • Poland
        • Rest of Europe
      • By Function
      • By Active Type
      • By Product Type
      • By Channel
      • By Claim
    • Market Attractiveness Analysis
      • By Country
      • By Function
      • By Active Type
      • By Product Type
      • By Channel
      • By Claim
    • Key Takeaways
  15. East Asia Analysis 2020 to 2024 and Forecast 2025 to 2035, By Country
    • Historical Market Size Value (USD Million) Trend Analysis By Market Taxonomy, 2020 to 2024
    • Market Size Value (USD Million) Forecast By Market Taxonomy, 2025 to 2035
      • By Country
        • China
        • Japan
        • South Korea
      • By Function
      • By Active Type
      • By Product Type
      • By Channel
      • By Claim
    • Market Attractiveness Analysis
      • By Country
      • By Function
      • By Active Type
      • By Product Type
      • By Channel
      • By Claim
    • Key Takeaways
  16. South Asia & Pacific Analysis 2020 to 2024 and Forecast 2025 to 2035, By Country
    • Historical Market Size Value (USD Million) Trend Analysis By Market Taxonomy, 2020 to 2024
    • Market Size Value (USD Million) Forecast By Market Taxonomy, 2025 to 2035
      • By Country
        • India
        • Thailand
        • Malaysia
        • Indonesia
        • Singapore
        • Vietnam
        • Australia
        • New Zealand
        • Rest of South Asia
      • By Function
      • By Active Type
      • By Product Type
      • By Channel
      • By Claim
    • Market Attractiveness Analysis
      • By Country
      • By Function
      • By Active Type
      • By Product Type
      • By Channel
      • By Claim
    • Key Takeaways
  17. Middle East and Africa Analysis 2020 to 2024 and Forecast 2025 to 2035, By Country
    • Historical Market Size Value (USD Million) Trend Analysis By Market Taxonomy, 2020 to 2024
    • Market Size Value (USD Million) Forecast By Market Taxonomy, 2025 to 2035
      • By Country
        • Turkey
        • UAE
        • Saudi Arabia
        • Israel
        • Other GCC Countries
        • North Africa
        • South Africa
      • By Function
      • By Active Type
      • By Product Type
      • By Channel
      • By Claim
    • Market Attractiveness Analysis
      • By Country
      • By Function
      • By Active Type
      • By Product Type
      • By Channel
      • By Claim
    • Key Takeaways
  18. Key Countries Analysis
    • U.S.
      • Pricing Analysis
      • Market Share Analysis, 2024
        • By Function
        • By Active Type
        • By Product Type
        • By Channel
        • By Claim
    • Canada
      • Pricing Analysis
      • Market Share Analysis, 2024
        • By Function
        • By Active Type
        • By Product Type
        • By Channel
        • By Claim
    • Mexico
      • Pricing Analysis
      • Market Share Analysis, 2024
        • By Function
        • By Active Type
        • By Product Type
        • By Channel
        • By Claim
    • Brazil
      • Pricing Analysis
      • Market Share Analysis, 2024
        • By Function
        • By Active Type
        • By Product Type
        • By Channel
        • By Claim
    • Germany
      • Pricing Analysis
      • Market Share Analysis, 2024
        • By Function
        • By Active Type
        • By Product Type
        • By Channel
        • By Claim
    • U.K.
      • Pricing Analysis
      • Market Share Analysis, 2024
        • By Function
        • By Active Type
        • By Product Type
        • By Channel
        • By Claim
    • Italy
      • Pricing Analysis
      • Market Share Analysis, 2024
        • By Function
        • By Active Type
        • By Product Type
        • By Channel
        • By Claim
    • Spain
      • Pricing Analysis
      • Market Share Analysis, 2024
        • By Function
        • By Active Type
        • By Product Type
        • By Channel
        • By Claim
    • France
      • Pricing Analysis
      • Market Share Analysis, 2024
        • By Function
        • By Active Type
        • By Product Type
        • By Channel
        • By Claim
    • India
      • Pricing Analysis
      • Market Share Analysis, 2024
        • By Function
        • By Active Type
        • By Product Type
        • By Channel
        • By Claim
    • Australia & New Zealand
      • Pricing Analysis
      • Market Share Analysis, 2024
        • By Function
        • By Active Type
        • By Product Type
        • By Channel
        • By Claim
    • China
      • Pricing Analysis
      • Market Share Analysis, 2024
        • By Function
        • By Active Type
        • By Product Type
        • By Channel
        • By Claim
    • Japan
      • Pricing Analysis
      • Market Share Analysis, 2024
        • By Function
        • By Active Type
        • By Product Type
        • By Channel
        • By Claim
    • South Korea
      • Pricing Analysis
      • Market Share Analysis, 2024
        • By Function
        • By Active Type
        • By Product Type
        • By Channel
        • By Claim
    • Russia
      • Pricing Analysis
      • Market Share Analysis, 2024
        • By Function
        • By Active Type
        • By Product Type
        • By Channel
        • By Claim
    • Poland
      • Pricing Analysis
      • Market Share Analysis, 2024
        • By Function
        • By Active Type
        • By Product Type
        • By Channel
        • By Claim
    • Hungary
      • Pricing Analysis
      • Market Share Analysis, 2024
        • By Function
        • By Active Type
        • By Product Type
        • By Channel
        • By Claim
    • Kingdom of Saudi Arabia
      • Pricing Analysis
      • Market Share Analysis, 2024
        • By Function
        • By Active Type
        • By Product Type
        • By Channel
        • By Claim
    • South Africa
      • Pricing Analysis
      • Market Share Analysis, 2024
        • By Function
        • By Active Type
        • By Product Type
        • By Channel
        • By Claim
  19. Market Structure Analysis
    • Competition Dashboard
    • Competition Benchmarking
    • Market Share Analysis of Top Players
      • By Regional
      • By Function
      • By Active Type
      • By Product Type
      • By Channel
      • By Claim
  20. Competition Analysis
    • Competition Deep Dive
      • BASF
        • Overview
        • Product Portfolio
        • Profitability by Market Segments (Product/Age /Sales Channel/Region)
        • Sales Footprint
        • Strategy Overview
        • Evonik
        • Ashland
        • Clariant
        • Croda
        • Sol-Gel Technologies
        • DSM-Firmenich
        • Seppic
        • Givaudan
        • Symrise
    • Assumptions & Acronyms Used
    • Research Methodology

List of Tables

  • Table 1: Global Value (USD Million) Forecast by Region, 2020-2035
  • Table 2: Global Value (USD Million) Forecast by Function, 2020-2035
  • Table 3: Global Value (USD Million) Forecast by Active Type, 2020-2035
  • Table 4: Global Value (USD Million) Forecast by Product Type, 2020-2035
  • Table 5: Global Value (USD Million) Forecast by Channel, 2020-2035
  • Table 6: Global Value (USD Million) Forecast by Claim, 2020-2035
  • Table 7: North America Value (USD Million) Forecast by Country, 2020-2035
  • Table 8: North America Value (USD Million) Forecast by Function, 2020-2035
  • Table 9: North America Value (USD Million) Forecast by Active Type, 2020-2035
  • Table 10: North America Value (USD Million) Forecast by Product Type, 2020-2035
  • Table 11: North America Value (USD Million) Forecast by Channel, 2020-2035
  • Table 12: North America Value (USD Million) Forecast by Claim, 2020-2035
  • Table 13: Latin America Value (USD Million) Forecast by Country, 2020-2035
  • Table 14: Latin America Value (USD Million) Forecast by Function, 2020-2035
  • Table 15: Latin America Value (USD Million) Forecast by Active Type, 2020-2035
  • Table 16: Latin America Value (USD Million) Forecast by Product Type, 2020-2035
  • Table 17: Latin America Value (USD Million) Forecast by Channel, 2020-2035
  • Table 18: Latin America Value (USD Million) Forecast by Claim, 2020-2035
  • Table 19: Europe Value (USD Million) Forecast by Country, 2020-2035
  • Table 20: Europe Value (USD Million) Forecast by Function, 2020-2035
  • Table 21: Europe Value (USD Million) Forecast by Active Type, 2020-2035
  • Table 22: Europe Value (USD Million) Forecast by Product Type, 2020-2035
  • Table 23: Europe Value (USD Million) Forecast by Channel, 2020-2035
  • Table 24: Europe Value (USD Million) Forecast by Claim, 2020-2035
  • Table 25: East Asia Value (USD Million) Forecast by Country, 2020-2035
  • Table 26: East Asia Value (USD Million) Forecast by Function, 2020-2035
  • Table 27: East Asia Value (USD Million) Forecast by Active Type, 2020-2035
  • Table 28: East Asia Value (USD Million) Forecast by Product Type, 2020-2035
  • Table 29: East Asia Value (USD Million) Forecast by Channel, 2020-2035
  • Table 30: East Asia Value (USD Million) Forecast by Claim, 2020-2035
  • Table 31: South Asia & Pacific Value (USD Million) Forecast by Country, 2020-2035
  • Table 32: South Asia & Pacific Value (USD Million) Forecast by Function, 2020-2035
  • Table 33: South Asia & Pacific Value (USD Million) Forecast by Active Type, 2020-2035
  • Table 34: South Asia & Pacific Value (USD Million) Forecast by Product Type, 2020-2035
  • Table 35: South Asia & Pacific Value (USD Million) Forecast by Channel, 2020-2035
  • Table 36: South Asia & Pacific Value (USD Million) Forecast by Claim, 2020-2035
  • Table 37: Middle East and Africa Value (USD Million) Forecast by Country, 2020-2035
  • Table 38: Middle East and Africa Value (USD Million) Forecast by Function, 2020-2035
  • Table 39: Middle East and Africa Value (USD Million) Forecast by Active Type, 2020-2035
  • Table 40: Middle East and Africa Value (USD Million) Forecast by Product Type, 2020-2035
  • Table 41: Middle East and Africa Value (USD Million) Forecast by Channel, 2020-2035
  • Table 42: Middle East and Africa Value (USD Million) Forecast by Claim, 2020-2035

List of Figures

  • Figure 1: Global Pricing Analysis
  • Figure 2: Global Value (USD Million) Forecast 2020-2035
  • Figure 3: Global Value Share and BPS Analysis by Function, 2025 and 2035
  • Figure 4: Global Y-o-Y Growth Comparison by Function, 2025-2035
  • Figure 5: Global Attractiveness Analysis by Function
  • Figure 6: Global Value Share and BPS Analysis by Active Type, 2025 and 2035
  • Figure 7: Global Y-o-Y Growth Comparison by Active Type, 2025-2035
  • Figure 8: Global Attractiveness Analysis by Active Type
  • Figure 9: Global Value Share and BPS Analysis by Product Type, 2025 and 2035
  • Figure 10: Global Y-o-Y Growth Comparison by Product Type, 2025-2035
  • Figure 11: Global Attractiveness Analysis by Product Type
  • Figure 12: Global Value Share and BPS Analysis by Channel, 2025 and 2035
  • Figure 13: Global Y-o-Y Growth Comparison by Channel, 2025-2035
  • Figure 14: Global Attractiveness Analysis by Channel
  • Figure 15: Global Value Share and BPS Analysis by Claim, 2025 and 2035
  • Figure 16: Global Y-o-Y Growth Comparison by Claim, 2025-2035
  • Figure 17: Global Attractiveness Analysis by Claim
  • Figure 18: Global Value (USD Million) Share and BPS Analysis by Region, 2025 and 2035
  • Figure 19: Global Y-o-Y Growth Comparison by Region, 2025-2035
  • Figure 20: Global Attractiveness Analysis by Region
  • Figure 21: North America Incremental $ Opportunity, 2025-2035
  • Figure 22: Latin America Incremental $ Opportunity, 2025-2035
  • Figure 23: Europe Incremental $ Opportunity, 2025-2035
  • Figure 24: East Asia Incremental $ Opportunity, 2025-2035
  • Figure 25: South Asia & Pacific Incremental $ Opportunity, 2025-2035
  • Figure 26: Middle East and Africa Incremental $ Opportunity, 2025-2035
  • Figure 27: North America Value Share and BPS Analysis by Country, 2025 and 2035
  • Figure 28: North America Value Share and BPS Analysis by Function, 2025 and 2035
  • Figure 29: North America Y-o-Y Growth Comparison by Function, 2025-2035
  • Figure 30: North America Attractiveness Analysis by Function
  • Figure 31: North America Value Share and BPS Analysis by Active Type, 2025 and 2035
  • Figure 32: North America Y-o-Y Growth Comparison by Active Type, 2025-2035
  • Figure 33: North America Attractiveness Analysis by Active Type
  • Figure 34: North America Value Share and BPS Analysis by Product Type, 2025 and 2035
  • Figure 35: North America Y-o-Y Growth Comparison by Product Type, 2025-2035
  • Figure 36: North America Attractiveness Analysis by Product Type
  • Figure 37: North America Value Share and BPS Analysis by Channel, 2025 and 2035
  • Figure 38: North America Y-o-Y Growth Comparison by Channel, 2025-2035
  • Figure 39: North America Attractiveness Analysis by Channel
  • Figure 40: North America Value Share and BPS Analysis by Claim, 2025 and 2035
  • Figure 41: North America Y-o-Y Growth Comparison by Claim, 2025-2035
  • Figure 42: North America Attractiveness Analysis by Claim
  • Figure 43: Latin America Value Share and BPS Analysis by Country, 2025 and 2035
  • Figure 44: Latin America Value Share and BPS Analysis by Function, 2025 and 2035
  • Figure 45: Latin America Y-o-Y Growth Comparison by Function, 2025-2035
  • Figure 46: Latin America Attractiveness Analysis by Function
  • Figure 47: Latin America Value Share and BPS Analysis by Active Type, 2025 and 2035
  • Figure 48: Latin America Y-o-Y Growth Comparison by Active Type, 2025-2035
  • Figure 49: Latin America Attractiveness Analysis by Active Type
  • Figure 50: Latin America Value Share and BPS Analysis by Product Type, 2025 and 2035
  • Figure 51: Latin America Y-o-Y Growth Comparison by Product Type, 2025-2035
  • Figure 52: Latin America Attractiveness Analysis by Product Type
  • Figure 53: Latin America Value Share and BPS Analysis by Channel, 2025 and 2035
  • Figure 54: Latin America Y-o-Y Growth Comparison by Channel, 2025-2035
  • Figure 55: Latin America Attractiveness Analysis by Channel
  • Figure 56: Latin America Value Share and BPS Analysis by Claim, 2025 and 2035
  • Figure 57: Latin America Y-o-Y Growth Comparison by Claim, 2025-2035
  • Figure 58: Latin America Attractiveness Analysis by Claim
  • Figure 59: Europe Value Share and BPS Analysis by Country, 2025 and 2035
  • Figure 60: Europe Value Share and BPS Analysis by Function, 2025 and 2035
  • Figure 61: Europe Y-o-Y Growth Comparison by Function, 2025-2035
  • Figure 62: Europe Attractiveness Analysis by Function
  • Figure 63: Europe Value Share and BPS Analysis by Active Type, 2025 and 2035
  • Figure 64: Europe Y-o-Y Growth Comparison by Active Type, 2025-2035
  • Figure 65: Europe Attractiveness Analysis by Active Type
  • Figure 66: Europe Value Share and BPS Analysis by Product Type, 2025 and 2035
  • Figure 67: Europe Y-o-Y Growth Comparison by Product Type, 2025-2035
  • Figure 68: Europe Attractiveness Analysis by Product Type
  • Figure 69: Europe Value Share and BPS Analysis by Channel, 2025 and 2035
  • Figure 70: Europe Y-o-Y Growth Comparison by Channel, 2025-2035
  • Figure 71: Europe Attractiveness Analysis by Channel
  • Figure 72: Europe Value Share and BPS Analysis by Claim, 2025 and 2035
  • Figure 73: Europe Y-o-Y Growth Comparison by Claim, 2025-2035
  • Figure 74: Europe Attractiveness Analysis by Claim
  • Figure 75: East Asia Value Share and BPS Analysis by Country, 2025 and 2035
  • Figure 76: East Asia Value Share and BPS Analysis by Function, 2025 and 2035
  • Figure 77: East Asia Y-o-Y Growth Comparison by Function, 2025-2035
  • Figure 78: East Asia Attractiveness Analysis by Function
  • Figure 79: East Asia Value Share and BPS Analysis by Active Type, 2025 and 2035
  • Figure 80: East Asia Y-o-Y Growth Comparison by Active Type, 2025-2035
  • Figure 81: East Asia Attractiveness Analysis by Active Type
  • Figure 82: East Asia Value Share and BPS Analysis by Product Type, 2025 and 2035
  • Figure 83: East Asia Y-o-Y Growth Comparison by Product Type, 2025-2035
  • Figure 84: East Asia Attractiveness Analysis by Product Type
  • Figure 85: East Asia Value Share and BPS Analysis by Channel, 2025 and 2035
  • Figure 86: East Asia Y-o-Y Growth Comparison by Channel, 2025-2035
  • Figure 87: East Asia Attractiveness Analysis by Channel
  • Figure 88: East Asia Value Share and BPS Analysis by Claim, 2025 and 2035
  • Figure 89: East Asia Y-o-Y Growth Comparison by Claim, 2025-2035
  • Figure 90: East Asia Attractiveness Analysis by Claim
  • Figure 91: South Asia & Pacific Value Share and BPS Analysis by Country, 2025 and 2035
  • Figure 92: South Asia & Pacific Value Share and BPS Analysis by Function, 2025 and 2035
  • Figure 93: South Asia & Pacific Y-o-Y Growth Comparison by Function, 2025-2035
  • Figure 94: South Asia & Pacific Attractiveness Analysis by Function
  • Figure 95: South Asia & Pacific Value Share and BPS Analysis by Active Type, 2025 and 2035
  • Figure 96: South Asia & Pacific Y-o-Y Growth Comparison by Active Type, 2025-2035
  • Figure 97: South Asia & Pacific Attractiveness Analysis by Active Type
  • Figure 98: South Asia & Pacific Value Share and BPS Analysis by Product Type, 2025 and 2035
  • Figure 99: South Asia & Pacific Y-o-Y Growth Comparison by Product Type, 2025-2035
  • Figure 100: South Asia & Pacific Attractiveness Analysis by Product Type
  • Figure 101: South Asia & Pacific Value Share and BPS Analysis by Channel, 2025 and 2035
  • Figure 102: South Asia & Pacific Y-o-Y Growth Comparison by Channel, 2025-2035
  • Figure 103: South Asia & Pacific Attractiveness Analysis by Channel
  • Figure 104: South Asia & Pacific Value Share and BPS Analysis by Claim, 2025 and 2035
  • Figure 105: South Asia & Pacific Y-o-Y Growth Comparison by Claim, 2025-2035
  • Figure 106: South Asia & Pacific Attractiveness Analysis by Claim
  • Figure 107: Middle East and Africa Value Share and BPS Analysis by Country, 2025 and 2035
  • Figure 108: Middle East and Africa Value Share and BPS Analysis by Function, 2025 and 2035
  • Figure 109: Middle East and Africa Y-o-Y Growth Comparison by Function, 2025-2035
  • Figure 110: Middle East and Africa Attractiveness Analysis by Function
  • Figure 111: Middle East and Africa Value Share and BPS Analysis by Active Type, 2025 and 2035
  • Figure 112: Middle East and Africa Y-o-Y Growth Comparison by Active Type, 2025-2035
  • Figure 113: Middle East and Africa Attractiveness Analysis by Active Type
  • Figure 114: Middle East and Africa Value Share and BPS Analysis by Product Type, 2025 and 2035
  • Figure 115: Middle East and Africa Y-o-Y Growth Comparison by Product Type, 2025-2035
  • Figure 116: Middle East and Africa Attractiveness Analysis by Product Type
  • Figure 117: Middle East and Africa Value Share and BPS Analysis by Channel, 2025 and 2035
  • Figure 118: Middle East and Africa Y-o-Y Growth Comparison by Channel, 2025-2035
  • Figure 119: Middle East and Africa Attractiveness Analysis by Channel
  • Figure 120: Middle East and Africa Value Share and BPS Analysis by Claim, 2025 and 2035
  • Figure 121: Middle East and Africa Y-o-Y Growth Comparison by Claim, 2025-2035
  • Figure 122: Middle East and Africa Attractiveness Analysis by Claim
  • Figure 123: Global - Tier Structure Analysis
  • Figure 124: Global - Company Share Analysis

Frequently Asked Questions

How big is the global Sol-Gel Based Skin Treatments Market in 2025?

The global Sol-Gel Based Skin Treatments Market is estimated to be valued at USD 1,102.9 million in 2025.

What will be the size of the global Sol-Gel Based Skin Treatments Market in 2035?

The market size for the global Sol-Gel Based Skin Treatments Market is projected to reach USD 3,950.3 million by 2035.

How much will be the global Sol-Gel Based Skin Treatments Market growth between 2025 and 2035?

The global Sol-Gel Based Skin Treatments Market is expected to grow at a 13.6% CAGR between 2025 and 2035.

What are the key product types in the global Sol-Gel Based Skin Treatments Market?

The key product types in the global Sol-Gel Based Skin Treatments Market are creams/lotions, serums, patches/masks, and sunscreens.

Which claim segment will contribute the most significant share in the global Sol-Gel Based Skin Treatments Market in 2025?

In terms of claim, the clinical-grade segment commands 53.3% share of the global Sol-Gel Based Skin Treatments Market in 2025, equivalent to USD 588.9 million.

Explore Similar Insights

Future Market Insights

Sol-Gel Based Skin Treatments Market

Chat With

MaRIA

Hi There, I am MaRIA, Your Market Research Intelligence Assistant. How may I help you?