AI-based Atrial Fibrillation AFib Detection Market Size and Share Forecast Outlook 2025 to 2035

The global AI-based Atrial Fibrillation (AFib) Detection Market is projected to reach a valuation of USD 8,097.9 million by 2025 and USD 53,477.5million by 2035 which indicates a (CAGR) of 20.8%, during the study period. Clinical AI Systems contributes 49.9% share while Continuous Rhythm Monitoring leads the application segment with 30.0% share.

During the first five-year period from 2025 to 2030, the total market value is projected to expand from USD 8,097.9 million to around USD 22,785.1 million, adding nearly USD 14,687.2million, which contributes to 32.4% of the total decade growth.

The Clinical AI Systems segment will remain dominant, holding close to 49.9% share of the category by 2030 due to hospitals’ continued prioritization of advanced diagnostic accuracy and workflow efficiency. The Remote Monitoring segment will account for nearly 24% by 2030, while Wearables 18.2%and Smartphone Apps 7.9%will continue to gain traction as consumer-preferred tools for arrhythmia detection.

The second half from 2030 to 2035 contributes approximately USD 30,692.3 million, equal to 67.6% of the total growth. This acceleration is powered by the widespread adoption of AI-enabled Continuous Rhythm Monitoring contributing 30% in both specialized cardiology centers and large hospital networks. By the end of the decade, Clinical AI Systems and Remote Monitoring Platforms together are expected to capture over 70% of the market share, while Wearables and Smartphone Apps are projected to maintain strong adoption in cost-sensitive and emerging markets.
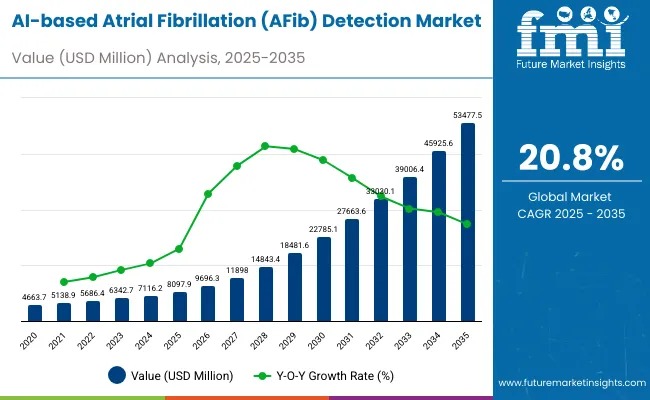
Quick Stats for AI-based Atrial Fibrillation (AFib) Detection Market

  • Industry Value (2025): USD 8,097.9 million
  • Forecast Value (2035): USD 53,477.5 million
  • Forecast CAGR: 20.8%
  • Leading Segment in 2025 (Platform): Clinical AI Systems (49.9% market share)
  • Key Growth Region: Asia Pacific, North America and europe
  • Top Key Players: AliveCor, Inc., Koninklijke Philips N.V., TEMPUS, Medtronic, OMRON Healthcare Co., Ltd., iRhythm Inc., Bardy Diagnostics, Inc., Powerful Medical, Inc.

Ai Based Atrial Fibrillation Afib Detection Market

Metric Value
Industry Size (2025E) USD 8,097.9 million
Industry Value (2035F) USD 53,477.5million
CAGR (2025 to 2035) 20.8%

From 2020 to 2024, the overall AI-based Atrial Fibrillation (AFib) Detection Market grew steadilygrew from USD 4,663.7  million to USD 7,116.2  million, supported by the rising adoption of AI-enabled clinical platforms, wearable ECG devices, and smartphone-based rhythm monitoring applications. Leading manufacturers such as AliveCor, Inc., iRhythm Technologies, Koninklijke Philips N.V., Tempus, Medtronic, and OMRON Healthcare collectively account for a significant share of global revenue through AI-driven arrhythmia detection solutions and integration with remote monitoring systems.

Key strategies deployed by these players include advancements in deep learning (DL) and machine learning (ML) models, development of hybrid AI for rhythm interpretation, and partnerships with hospitals and cardiology centers to standardize early AFib detection and risk prediction workflows.

In 2025, the AI-based Atrial Fibrillation (AFib) Detection Market is expected to reach a value of approximately USD 8,097.9 million, driven by the shift from traditional ECG diagnostics toward AI-powered Clinical AI Systems and remote monitoring platforms. Growth will be propelled by healthcare providers’ investments in precision diagnostics, continuous rhythm monitoring, and improved patient management outcomes.

End users, particularly hospitals and cardiology clinics, are increasingly adopting platforms with AI-based risk prediction models, wearable integration, and smartphone connectivity, supporting both continuous monitoring and post-treatment follow-up. This trend aligns with the rising demand for preventive cardiology solutions and highly accurate arrhythmia detection across both developed and emerging markets.

Why Is This Market Growing?

The AI-based Atrial Fibrillation (AFib) Detection Market is experiencing strong growth as healthcare providers worldwide face increasing demand for early arrhythmia detection, continuous rhythm monitoring, and improved patient outcomes. Major growth drivers include the rising global prevalence of atrial fibrillation, the expanding adoption of wearable and remote monitoring devices, and the integration of AI algorithms with clinical diagnostics.

Advancements such as deep learning (DL) and machine learning (ML) models, smartphone app connectivity, and system-specific AI platforms reduce diagnostic delays, minimize undetected AFib episodes, and enhance treatment decision-making. The shift toward preventive cardiology and growing acceptance of digital health monitoring are further accelerating adoption.

The pandemic heightened the importance of remote patient monitoring and virtual care pathways, driving hospitals, cardiology centers, and digital health providers to standardize AI-based detection workflows. In regions with rapidly expanding healthcare infrastructure particularly in North America, Europe, and Asia Pacific new investments in clinical AI systems and technology upgrades are fueling demand for advanced AFib detection solutions that combine accuracy, safety, and clinical efficiency.

Segmental Analysis

The market is segmented by platform, technology, application, and region. Platform segmentation includes Clinical AI Systems, Remote Monitoring, Wearables, and Smartphone Apps, representing the core solutions driving early arrhythmia detection, patient engagement, and integration with healthcare workflows. Technology segmentation covers Deep Learning (DL), Machine Learning (ML), Hybrid AI, and Other Models, each contributing to improvements in predictive accuracy, rhythm classification, and real-time monitoring capabilities.

Application classification includes Continuous Rhythm Monitoring, Screening & Risk Prediction, Post-treatment Monitoring, and Hospital Workflow Optimization, reflecting the broad spectrum of use cases supported by AI-driven AFib detection tools in clinical practice and patient care pathways. Regional scope spans North America, Latin America, Western and Eastern Europe, East Asia, South Asia and Pacific, and the Middle East and Africa, with market growth influenced by variations in healthcare infrastructure, prevalence of cardiovascular diseases, digital health adoption, and regulatory frameworks for AI-enabled diagnostics.
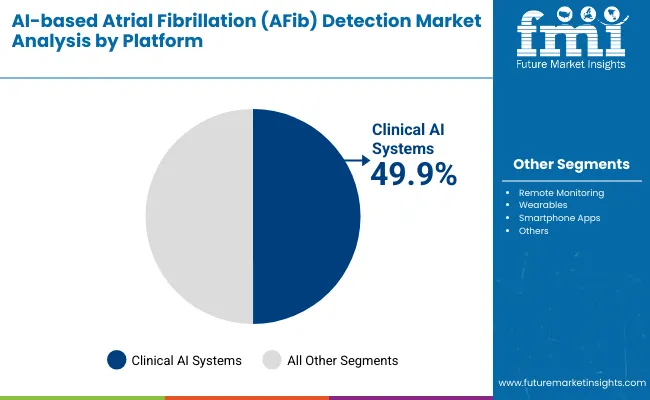
Insights into the Platform Segment with Clinical AI Systems Leading in Market Share

Ai Based Atrial Fibrillation Afib Detection Market By Platform

Platform Market Share (%)
Clinical AI Systems 49.90%
Remote Monitoring 24.00%
Wearables 18.20%
Smartphone Apps 7.90%

Clinical AI Systems are expected to retain a dominant position, contributing 49.9% to the market in 2025, owing to their ability to deliver highly accurate, real-time arrhythmia detection and risk prediction within clinical workflows. Their adoption has been driven by the global shift toward precision cardiology and the increasing integration of AI algorithms with hospital-based monitoring platforms and electronic health records. These systems are increasingly preferred by healthcare providers due to their capacity to reduce undiagnosed AFib cases, enhance treatment predictability, and improve patient management outcomes.

Hospitals and specialized cardiology centers are investing in AI-driven systems to standardize early detection, particularly for high-risk patients requiring continuous monitoring or post-treatment follow-up. Industry adoption has also been supported by advancements in deep learning (DL) and machine learning (ML) models, interoperability with remote monitoring devices, and integration into telecardiology platforms. Collectively, these factors have solidified the position of Clinical AI Systems over consumer-centric wearables or app-only solutions in high-volume, clinically driven healthcare environments worldwide.
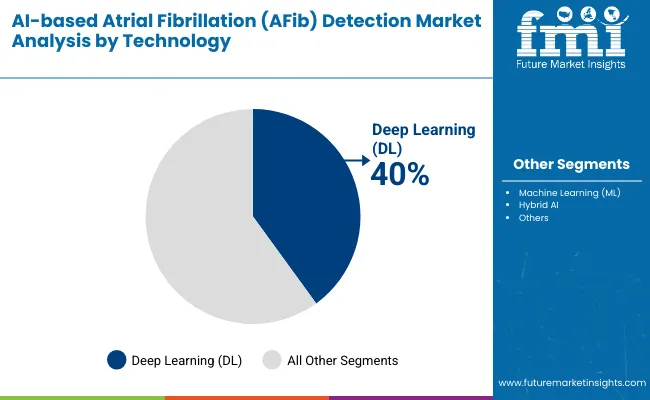
Insights into the Technology Segment with Deep Learning (DL) Leading in Market Share

Ai Based Atrial Fibrillation Afib Detection Market By Technology

Technology Market Share (%)
Deep Learning (DL) 40%
Machine Learning (ML) 35%
Hybrid AI 15%
Other Models 10%

Deep Learning (DL) is expected to retain a dominant position, contributing 40% to the market in 2025, owing to its unmatched ability to analyze complex ECG and PPG signals for accurate AFib detection. Adoption has been driven by the global shift toward precision cardiology and the increasing deployment of convolutional neural networks (CNNs) and recurrent neural networks (RNNs) in arrhythmia monitoring platforms. DL models are increasingly preferred due to their capacity to improve diagnostic accuracy, reduce false positives, and enable predictive risk stratification in high-risk populations.

Healthcare providers and digital health innovators are investing in DL-based systems to support early detection workflows, particularly for continuous rhythm monitoring and screening programs. Industry adoption has also been supported by advancements in cloud-based computing, GPU acceleration, and integration of DL models into wearable and smartphone-based applications. Collectively, these factors have solidified the position of Deep Learning ahead of traditional machine learning and hybrid approaches, making it the leading technology in AI-driven AFib detection worldwide.
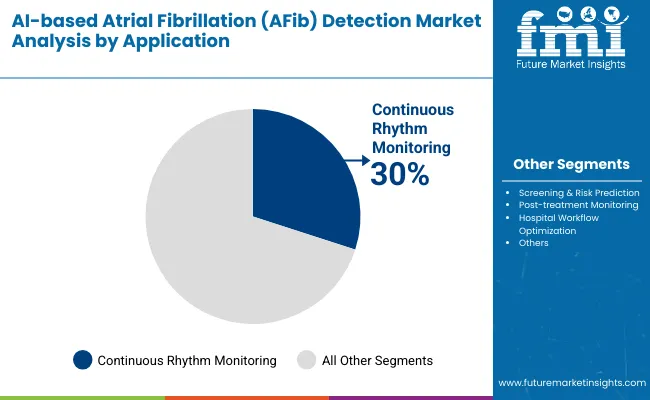
Insights into the Application Segment with Highest Adoption in Continuous Rhythm Monitoring

Ai Based Atrial Fibrillation Afib Detection Market By Application

Application Market Share (%)
Continuous Rhythm Monitoring 30%
Screening & Risk Prediction 28%
Post-treatment Monitoring 25%
Hospital Workflow Optimization 17%

Continuous Rhythm Monitoring is expected to remain the largest application segment, contributing around 30% of the market in 2025, driven by its critical role in detecting intermittent and asymptomatic AFib episodes that often go undiagnosed in routine checkups. The majority of long-term monitoring for at-risk patients is performed through AI-enabled clinical systems, wearables, and remote devices, where accuracy, reliability, and real-time data transmission are operational priorities.

The adoption of continuous monitoring is reinforced by the integration of deep learning models, cloud-based analytics, and seamless connectivity with hospital and telecardiology workflows. Investments in healthcare modernization, particularly in high-volume cardiology networks, are enabling the deployment of advanced monitoring solutions to improve patient outcomes and reduce the risk of stroke. Additionally, favorable reimbursement policies for remote patient monitoring and the growing prevalence of elderly populations worldwide are supporting higher adoption levels, cementing Continuous Rhythm Monitoring as the primary growth driver for AI-based AFib detection solutions globally.

What are the Drivers, Restraints, and Key Trends of the AI-based Atrial Fibrillation (AFib) Detection Market?

Advanced AI Integration into Clinical and Remote Monitoring Systems Driving Precision in Early Atrial Fibrillation Detection

One of the most important growth drivers of the AI-based Atrial Fibrillation (AFib) Detection Market is the rapid integration of advanced deep learning and machine learning models into both hospital-based clinical platforms and remote monitoring devices. These algorithms allow for the real-time identification of arrhythmia episodes, improved accuracy in rhythm classification, and proactive risk prediction. As AFib is often asymptomatic and intermittent, traditional diagnostic methods miss a significant number of cases; AI-driven systems are bridging this gap by continuously analyzing ECG and PPG signals to deliver earlier interventions and reduce stroke-related complications.

Hospitals, cardiology centers, and telehealth providers are compelled to deploy these solutions to streamline workflows, reduce diagnostic errors, and lower the burden of cardiovascular complications on health systems. Regulatory clearances from the FDA, NICE, and European agencies are further reinforcing trust and accelerating procurement decisions. With global AFib prevalence projected to rise sharply over the next decade, AI-based clinical platforms are becoming indispensable in preventive cardiology and represent a core driver of market expansion worldwide.

High System Deployment Costs, Data Integration Challenges, and Infrastructure Limitations Hindering Large-Scale Market Penetration

Despite rapid progress, the high cost and infrastructure demands of AI-based AFib detection systems remain significant barriers to large-scale adoption, particularly in emerging and cost-sensitive regions. Advanced clinical AI systems require substantial upfront investments in compatible ECG/PPG hardware, cloud-based platforms, and ongoing subscription models for algorithm updates and clinical analytics. Furthermore, integration with hospital electronic health records (EHRs) and compliance with data privacy regulations such as HIPAA and GDPR add financial and technical complexity.

Smaller healthcare providers and regional hospitals often face difficulties in retrofitting existing workflows to accommodate AI-based systems, leading to adoption delays. Broadband connectivity gaps and limited availability of trained personnel in rural or developing areas further constrain deployment. For many institutions, staff training and workflow adaptation represent hidden costs that compound the initial expense of technology acquisition. These challenges make affordability, scalability, and regulatory harmonization critical to unlocking the full potential of AI-enabled AFib detection solutions across global healthcare systems.

Convergence of AI-Based Atrial Fibrillation Detection with Comprehensive Digital Health and Preventive Cardiology Ecosystems

A transformative trend reshaping this market is the convergence of AI-based AFib detection solutions with broader digital health ecosystems that integrate remote monitoring, telecardiology, predictive analytics, and cloud-based patient management systems. Rather than adopting detection algorithms as isolated tools, hospitals, health networks, and insurers are embedding AI-based arrhythmia monitoring into comprehensive cardiovascular care pathways. Companies like AliveCor, iRhythm, Philips, Tempus, and Medtronic are actively developing platforms that combine wearable devices, continuous ECG analysis, AI-driven risk stratification, and telehealth consultations into unified service models.

This convergence is shifting procurement decisions away from standalone cost considerations toward long-term value creation based on interoperability, scalability, and clinical outcome improvements. For health systems transitioning toward value-based care models, these integrated platforms provide a compelling solution by enabling continuous patient engagement, proactive disease management, and reduced hospital readmissions. As healthcare infrastructures worldwide modernize, the integration of AI-enabled AFib detection into digital ecosystems is emerging as a defining trend, positioning it as a cornerstone of next-generation cardiovascular healthcare delivery.
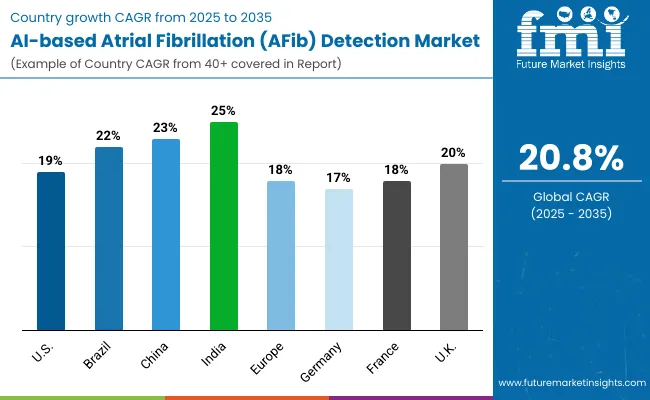
Analysis of AI-based Atrial Fibrillation (AFib) Detection Market by Key Countries

Ai Based Atrial Fibrillation Afib Detection Market By Country

Countries CAGR
USA 19.0%
Brazil 22.0%
China 23.0%
India 25.0%
Europe 18.0%
Germany 17.0%
France 18.0%
UK 20.0%

Asia Pacific is emerging as the fastest-growing region in the AI-based AFib Detection Market, projected to expand at a strong pace between 2025 and 2035. Among its key markets, India is forecast to grow at a 25.0% CAGR, driven by the rapid expansion of advanced cardiac care facilities, increasing deployment of AI-enabled monitoring systems, and growing awareness of arrhythmia detection among clinicians.

China is projected to expand at a 23.0% CAGR, supported by large-scale investments in digital health infrastructure, rising AFib case volumes, and public-private partnerships for AI integration in hospitals and community clinics. The region’s growth is also powered by government-backed digital health initiatives, expanding patient access to wearable monitoring devices, and early adoption of clinical AI platforms in technologically advanced economies such as Japan and South Korea.

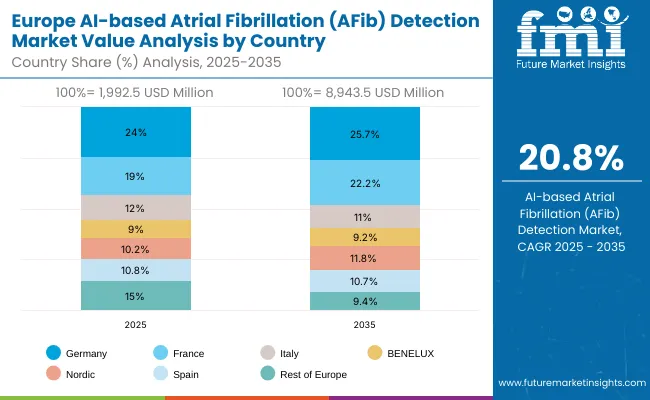
Europe is expected to grow steadily at a 16.2% CAGR through 2035. Germany, contributing 24.0% of regional revenues in 2025, is projected to increase slightly to 25.7% by 2035. France is forecast to grow at an 19.0% CAGR, expanding its share to 22.2% by 2035 through stronger uptake in both public and private hospitals. The UK will expand at a 20.0% CAGR, supported by NHS-backed initiatives to modernize cardiovascular care and incorporate AI-based arrhythmia detection. Italy and the Nordics are also expected to gain traction, collectively driving regional growth alongside broader regulatory support for digital health technologies.

North America remains a mature but innovation-led market, with the USA projected to grow at a 19.7% CAGR between 2025 and 2035. Growth in the USA is driven by the replacement of conventional ECG diagnostics with AI-enabled clinical systems and remote monitoring solutions across hospitals and outpatient cardiology practices. Increasing case volumes of AFib diagnosis and post-treatment monitoring, combined with patient demand for preventive screening, are accelerating adoption. Large health networks are investing in standardized AI protocols to ensure clinical consistency, while FDA approvals for wearable ECGs and smartphone-based detection apps are making adoption more attractive for providers.
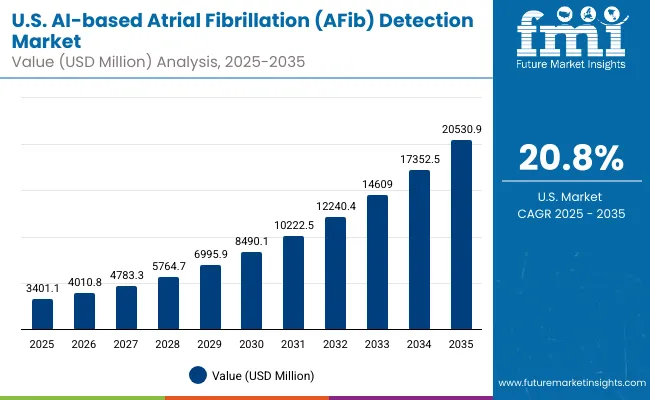
Sales Outlook for AI-based AFib Detection Market in the United States

Ai Based Atrial Fibrillation Afib Detection Market Usa

The AI-based AFib Detection Market in the USA is forecasted to grow at a 19.7% CAGR, primarily driven by the rapid shift from conventional ECG diagnostics to AI-enabled detection platforms. Hospitals, cardiology centers, and large health networks are replacing traditional monitoring protocols with Clinical AI Systems and Remote Monitoring platforms that ensure early detection, predictive accuracy, and workflow efficiency. Adoption is further accelerated by FDA approvals for AI-based wearables, smartphone apps, and predictive risk stratification platforms.

  • Hospitals and cardiology clinics are standardizing AI-driven monitoring protocols to improve patient outcomes and reduce stroke incidence.
  • Health insurers and provider networks are investing in AI-integrated solutions to support preventive care and reduce hospitalization costs.
  • Telecardiology services are deploying AI-enabled wearables to expand access in rural and underserved areas.

Growth and Expansion Outlook for AI-based AFib Detection Market in the United Kingdom

The AI-based AFib Detection Market in the United Kingdom is projected to grow at a 20.0% CAGR through 2035, supported by NHS-backed modernization projects aimed at integrating AI in cardiovascular care. Private hospital groups are also investing in digital health ecosystems that combine AI detection platforms, cloud analytics, and connected wearable monitoring devices. This trend is reinforced by government funding for digital health innovation and rising patient demand for preventive cardiology solutions.

  • NHS teaching hospitals are incorporating AI-based AFib detection into clinical training programs for cardiology specialists.
  • Private healthcare providers are focusing on large-scale deployment of Remote Monitoring solutions to reduce waiting times and support early interventions.
  • AI and medical device suppliers are promoting bundled packages that integrate clinical AI platforms with wearables and smartphone apps to accelerate adoption.

In-depth Analysis of AI-based AFib Detection Market in Germany

The AI-based AFib Detection Market in Germany is forecast to grow at a 17.0% CAGR, driven by the country’s strong cardiology infrastructure and focus on precision medicine. Germany’s high prevalence of cardiovascular diseases and commitment to healthcare digitalization are accelerating the adoption of AI-enabled arrhythmia detection. Professional associations and healthcare providers are actively promoting workshops and research collaborations to strengthen deployment.
  • University hospitals are integrating AI-enabled AFib detection into clinical research and postgraduate training to advance accuracy in preventive cardiology.
  • Large hospital networks are standardizing AI platform use across multiple facilities to ensure uniform treatment protocols.
  • Technology integrators are bundling AI solutions with telehealth platforms and remote monitoring devices to streamline cardiology care delivery.

Europe AI-based Atrial Fibrillation (AFib) Detection MarketValue Analysis by Country

Ai Based Atrial Fibrillation Afib Detection Market Europe

Market Expansion Outlook for AI-based AFib Detection Market in India

The AI-based AFib Detection Market in India is expected to grow at a 25.0% CAGR, positioning it among the fastest-growing global markets. Growth is supported by rapid expansion of advanced cardiac care facilities, rising clinician awareness of asymptomatic AFib, and accelerating deployment of AI-enabled Clinical AI Systems and Remote Monitoring platforms. Tier-1 hospitals are integrating continuous rhythm monitoring and screening & risk prediction into care pathways, while multi-hospital networks scale standardized AI workflows to improve time-to-diagnosis and reduce stroke risk. Increasing patient engagement via wearables and smartphone apps is widening access beyond metro hubs.

  • Private hospital groups are standardizing AI detection protocols across high-volume cardiology units.
  • Teaching institutions are embedding AI-based rhythm analysis in postgraduate cardiology training to upskill specialists.
  • Chain hospitals in Tier-2 cities are adopting cost-efficient remote monitoring + app bundles to scale outreach programs.

Sales Outlook for AI-based AFib Detection Market in China

The AI-based AFib Detection Market in China is projected to grow at a 23.0% CAGR through 2035, driven by large-scale digital-health investments and rising AFib screening volumes in urban centers. Top hospitals and regional networks are shifting to integrated Clinical AI Systems with continuous monitoring and risk-prediction modules, supported by rapid consumer uptake of wearables. Domestic device makers are scaling AI platforms and expanding interoperability with hospital systems, accelerating penetration across provinces.
  • Tier-1 cardiovascular centers are pairing AI screening with long-term remote monitoring for high-risk cohorts.
  • Regional provider groups are rolling out app-led screening campaigns as a cost-effective on-ramp to full clinical AI deployments.
  • Joint-venture clinics are sourcing premium AI platforms to align with international quality benchmarks and multi-site scalability.

Growth Outlook of AI-based AFib Detection Market in Japan

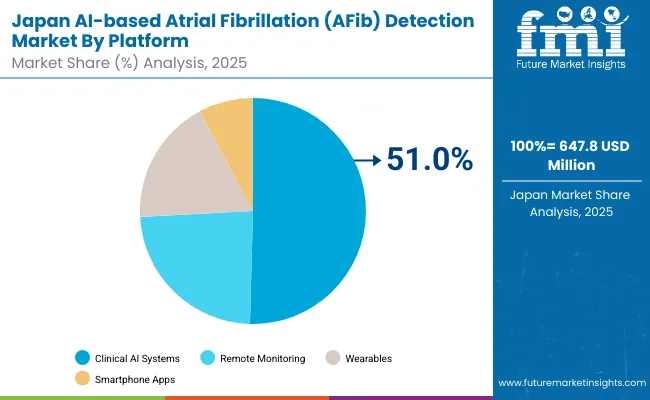
Ai Based Atrial Fibrillation Afib Detection Market Japan

The AI-based AFib Detection Market in Japan is projected to reach USD 647.8 million in 2025,with Clinical AI Systems accounting for around 49.2%. Adoption reflects Japan’s preference for precision cardiology and robust hospital integration, with mature provider networks embedding continuous rhythm monitoring, screening & risk prediction, and post-treatment follow-up into standardized pathways for aging populations. Local solution providers and hospital groups prioritize interoperable AI platforms tightly integrated with device ecosystems and EHRs to ensure consistent clinical outcomes.
  • Japan’s market share accounts for ~8.0% of the global market in 2025.
  • Clinical AI Systems dominate due to high acceptance in premium hospital cardiology units and specialist centers.
  • Growth is driven by advanced clinician training programs and tight integration of AI platforms with hospital IT and device stacks.

Opportunity Analysis of AI-based AFib Detection Market in South Korea

Ai Based Atrial Fibrillation Afib Detection Market South Kroea

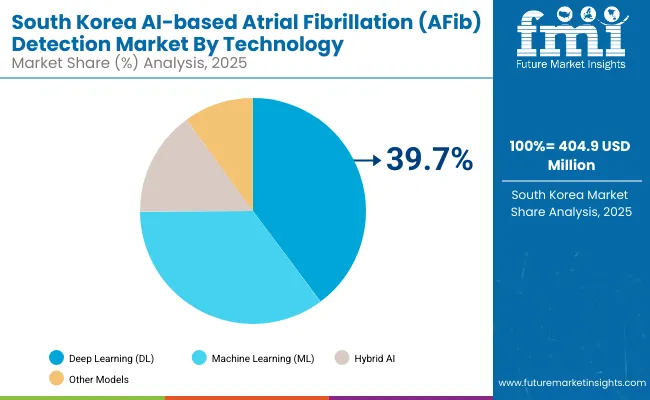
The AI-based AFib Detection Market in South Korea is estimated at USD 404.9 million in 2025, with Deep Learning contributes around 37.0% in technology segment. Early digital-health adoption and strong consumer tech penetration underpin rapid scale, as hospitals and health systems integrate continuous rhythm monitoring with telecardiology to enable same-day triage and follow-up. Multi-hospital networks are rolling out standardized AI pathways for preventive screening and post-treatment management.
  • Market size for South Korea in 2025 is USD 404.9 million
  • South Korea holds about 5.0% of the global market in 2025
  • Provider networks are bundling clinical AI platforms with wearables and apps to expand preventive screening across regions.

Competition Landscape

Ai Based Atrial Fibrillation Afib Detection Market By Company

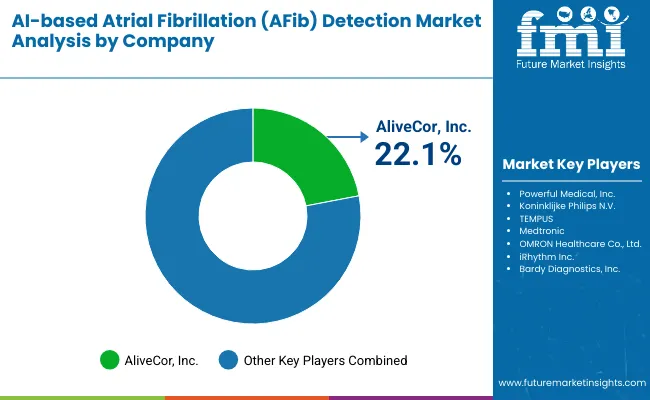
The Global AI-based Atrial Fibrillation (AFib) Detection Market is moderately competitive, with a mix of global leaders, enterprise health-tech vendors, and focused innovators competing across clinical AI systems, remote monitoring, and consumer-connected devices. AliveCor, Inc. leveraging a strong footprint in AI-enabled personal ECG devices and physician dashboards. Multinational incumbents such as Koninklijke Philips N.V. and Medtronic anchor hospital-centric ecosystems, integrating AFib detection into monitoring fleets and cardiology informatics.

TEMPUS and Powerful Medical, Inc. are scaling AI models for risk prediction and ECG interpretation, while OMRON Healthcare Co., Ltd. extends detection to home settings through connected BP devices and app workflows. Competitors are expanding reach via partnerships with health systems, payers, and telecardiology providers, offering bundled solutions that combine clinical AI platforms with wearables, remote monitoring services, and smartphone applications to optimize detection accuracy, throughput, and care coordination.

Established, mid-sized players including iRhythm Inc. and Bardy Diagnostics, Inc. focus on high-yield ambulatory monitoring through multi-day ECG patches, complemented by cloud analytics and clinician review services. Powerful Medical strengthens hospital adoption with scalable AI triage and decision support, while OMRON targets population-level screening programs through retail and provider channels.

Across this tier, vendors emphasize interoperability (EHR integrations and API-first design), configurable clinician dashboards, and outcome-linked service contracts. Commercial models increasingly blend device subscriptions, algorithm licensing, and managed monitoring services to fit the budgets and staffing patterns of integrated delivery networks and regional hospitals.

As the market evolves, competitive differentiation is shifting from device-led detection toward fully integrated cardiovascular AI ecosystems combining deep-learning algorithms, longitudinal data, and workflow automation for screening, continuous rhythm monitoring, and post-treatment follow-up.

Vendors are prioritizing cross-platform compatibility (clinical AI systems + remote monitoring + apps), privacy-by-design data pipelines, and measurable value metrics (stroke-risk reduction, time-to-diagnosis, and readmission avoidance). Portfolio strategies now emphasize modular AI upgrades, multi-condition roadmaps (AFib with hypertension or sleep-related arrhythmias), and scalable deployments across large provider networks positioning integrated, interoperable platforms as the core competitive edge.

Key Developments:

  • In May 2025, AliveCor launched KardiaMobile 6L Max and KardiaAlert, an AI-powered personal ECG and baseline-change alert feature for KardiaCare subscribers. The six-lead device expands arrhythmia detection and pairs with remote cardiologist reviews, enabling earlier identification, ongoing monitoring, and over-the-counter access to precision heart insights for patients and clinicians worldwide.
  • In June 2024, Tempus received FDA 510(k) clearance for Tempus ECG-AF, an AI algorithm analyzing resting 12-lead ECGs from patients 65+ without known AF to flag elevated 12-month atrial fibrillation/flutter risk. The tool augments clinician judgment and must be interpreted with ECGs, symptoms, and other tests; not diagnostic or treatment decision alone.

Scope of the Report

Item Value
Market Value (2025) USD 8,097.9 million
Platform type Clinical AI Systems, Remote Monitoring, Wearables, and Smartphone Apps
Technology Deep Learning (DL), Machine Learning (ML), Hybrid AI, and Other Models
Application Continuous Rhythm Monitoring, Screening & Risk Prediction, Post-treatment Monitoring, and Hospital Workflow Optimization
Regions Covered North America, Latin America, Western & Eastern Europe, East Asia, South Asia & Pacific, Middle East & Africa
Countries Covered USA, Brazil, China, India, Europe, Germany, France, UK
Key Companies Profiled AliveCor, Inc., Powerful Medical, Inc., Koninklijke Philips N.V., TEMPUS, Medtronic, OMRON Healthcare Co., Ltd., iRhythm Inc., Bardy Diagnostics, Inc.
Additional Attributes Dollar sales by application and regions, adoption trends of digitally integrated AI-based AFib detection across Clinical AI Systems, Remote Monitoring, Wearables, and Smartphone Apps, rising demand in Continuous Rhythm Monitoring and Screening & Risk Prediction, growing uptake across hospitals, cardiology networks, and telecardiology providers, increasing integration with EHRs, device connectivity, and cloud analytics for precision cardiology workflows. CAD/CAM, CBCT imaging, and 3D printing for precision implant workflows.

Key Segments

By Platform:

  • Clinical AI Systems
  • Remote Monitoring
  • Wearables
  • Smartphone Apps

By Technology:

  • Deep Learning (DL)
  • Machine Learning (ML)
  • Hybrid AI
  • Other Models

By Application:

  • Continuous Rhythm Monitoring
  • Screening & Risk Prediction
  • Post-treatment Monitoring
  • Hospital Workflow Optimization

By Region:

  • North America
  • Latin America
  • Western Europe
  • Eastern Europe
  • East Asia
  • South Asia
  • MEA

Table of Content

  1. Executive Summary
    • Global Market Outlook
    • Demand-side Trends
    • Supply-side Trends
    • Technology Roadmap Analysis
    • Analysis and Recommendations
  2. Market Overview
    • Market Coverage / Taxonomy
    • Market Definition / Scope / Limitations
  3. Market Background
    • Market Dynamics
      • Drivers
      • Restraints
      • Opportunity
      • Trends
    • Scenario Forecast
      • Demand in Optimistic Scenario
      • Demand in Likely Scenario
      • Demand in Conservative Scenario
    • Opportunity Map Analysis
    • Product Life Cycle Analysis
    • Technological Advancement
    • Investment Feasibility Matrix
    • Value Chain Analysis
      • Profit Margin Analysis
      • Wholesalers and Distributors
      • Retailers
    • PESTLE and Porter’s Analysis
    • Regulatory Landscape
      • By Key Regions
      • By Key Countries
    • Regional Parent Market Outlook
    • Recent Product Launches/Approvals
  4. Global Market Analysis 2020 to 2024 and Forecast, 2025 to 2035
    • Historical Market Size Value (USD Million) & Volume (Units) Analysis, 2020 to 2024
    • Current and Future Market Size Value (USD Million) & Volume (Units) Projections, 2025 to 2035
      • Y-o-Y Growth Trend Analysis
      • Absolute $ Opportunity Analysis
  5. Global Market Analysis 2020 to 2024 and Forecast 2025 to 2035, By Platform
    • Introduction / Key Findings
    • Historical Market Size Value (USD Million) & Volume (Units) Analysis By Platform, 2020 to 2024
    • Current and Future Market Size Value (USD Million) & Volume (Units) Analysis and Forecast By Platform, 2025 to 2035
      • Clinical AI Systems
      • Remote Monitoring
      • Wearables
      • Smartphone Apps
    • Y-o-Y Growth Trend Analysis By Platform, 2020 to 2024
    • Absolute $ Opportunity Analysis By Platform, 2025 to 2035
  6. Global Market Analysis 2020 to 2024 and Forecast 2025 to 2035, By Technology
    • Introduction / Key Findings
    • Historical Market Size Value (USD Million) & Volume (Units) Analysis By Technology, 2020 to 2024
    • Current and Future Market Size Value (USD Million) & Volume (Units) Analysis and Forecast By Technology, 2025 to 2035
      • Deep Learning (DL)
      • Machine Learning (ML)
      • Hybrid AI
      • Other Models
    • Y-o-Y Growth Trend Analysis By Technology, 2020 to 2024
    • Absolute $ Opportunity Analysis By Technology, 2025 to 2035
  7. Global Market Analysis 2020 to 2024 and Forecast 2025 to 2035, By Application
    • Introduction / Key Findings
    • Historical Market Size Value (USD Million) & Volume (Units) Analysis By Application, 2020 to 2024
    • Current and Future Market Size Value (USD Million) & Volume (Units) Analysis and Forecast By Application, 2025 to 2035
      • Continuous Rhythm Monitoring
      • Screening & Risk Prediction
      • Post-treatment Monitoring
      • Hospital Workflow Optimization
    • Y-o-Y Growth Trend Analysis By Application, 2020 to 2024
    • Absolute $ Opportunity Analysis By Application, 2025 to 2035
  8. Global Market Analysis 2020 to 2024 and Forecast 2025 to 2035, By Region
    • Introduction
    • Historical Market Size Value (USD Million) & Volume (Units) Analysis By Region, 2020 to 2024
    • Current Market Size Value (USD Million) & Volume (Units) Analysis and Forecast By Region, 2025 to 2035
      • North America
      • Latin America
      • Western Europe
      • Eastern Europe
      • East Asia
      • South Asia
      • MEA
    • Market Attractiveness Analysis By Region
  9. North America Market Analysis 2020 to 2024 and Forecast 2025 to 2035, By Country
    • Historical Market Size Value (USD Million) & Volume (Units) Trend Analysis By Market Taxonomy, 2020 to 2024
    • Market Size Value (USD Million) & Volume (Units) Forecast By Market Taxonomy, 2025 to 2035
      • By Country
        • USA
        • Canada
        • Mexico
      • By Platform
      • By Technology
      • By Application
    • Market Attractiveness Analysis
      • By Country
      • By Platform
      • By Technology
      • By Application
    • Key Takeaways
  10. Latin America Market Analysis 2020 to 2024 and Forecast 2025 to 2035, By Country
    • Historical Market Size Value (USD Million) & Volume (Units) Trend Analysis By Market Taxonomy, 2020 to 2024
    • Market Size Value (USD Million) & Volume (Units) Forecast By Market Taxonomy, 2025 to 2035
      • By Country
        • Brazil
        • Argentina
        • Rest of Latin America
      • By Platform
      • By Technology
      • By Application
    • Market Attractiveness Analysis
      • By Country
      • By Platform
      • By Technology
      • By Application
    • Key Takeaways
  11. Western Europe Market Analysis 2020 to 2024 and Forecast 2025 to 2035, By Country
    • Historical Market Size Value (USD Million) & Volume (Units) Trend Analysis By Market Taxonomy, 2020 to 2024
    • Market Size Value (USD Million) & Volume (Units) Forecast By Market Taxonomy, 2025 to 2035
      • By Country
        • Germany
        • Italy
        • France
        • UK
        • Spain
        • BENELUX
        • Nordic Countries
        • Rest of Western Europe
      • By Platform
      • By Technology
      • By Application
    • Market Attractiveness Analysis
      • By Country
      • By Platform
      • By Technology
      • By Application
    • Key Takeaways
  12. Eastern Europe Market Analysis 2020 to 2024 and Forecast 2025 to 2035, By Country
    • Historical Market Size Value (USD Million) & Volume (Units) Trend Analysis By Market Taxonomy, 2020 to 2024
    • Market Size Value (USD Million) & Volume (Units) Forecast By Market Taxonomy, 2025 to 2035
      • By Country
        • Russia
        • Hungry
        • Poland
        • Rest of Eastern Europe
      • By Platform
      • By Technology
      • By Application
    • Market Attractiveness Analysis
      • By Country
      • By Platform
      • By Technology
      • By Application
    • Key Takeaways
  13. East Asia Market Analysis 2020 to 2024 and Forecast 2025 to 2035, By Country
    • Historical Market Size Value (USD Million) & Volume (Units) Trend Analysis By Market Taxonomy, 2020 to 2024
    • Market Size Value (USD Million) & Volume (Units) Forecast By Market Taxonomy, 2025 to 2035
      • By Country
        • China
        • Japan
        • South Korea
      • By Platform
      • By Technology
      • By Application
    • Market Attractiveness Analysis
      • By Country
      • By Platform
      • By Technology
      • By Application
    • Key Takeaways
  14. South Asia Market Analysis 2020 to 2024 and Forecast 2025 to 2035, By Country
    • Historical Market Size Value (USD Million) & Volume (Units) Trend Analysis By Market Taxonomy, 2020 to 2024
    • Market Size Value (USD Million) & Volume (Units) Forecast By Market Taxonomy, 2025 to 2035
      • By Country
        • India
        • ASEAN Countries
        • Australia & New Zealand
        • Rest of South Asia
      • By Platform
      • By Technology
      • By Application
    • Market Attractiveness Analysis
      • By Country
      • By Platform
      • By Technology
      • By Application
    • Key Takeaways
  15. MEA Market Analysis 2020 to 2024 and Forecast 2025 to 2035, By Country
    • Historical Market Size Value (USD Million) & Volume (Units) Trend Analysis By Market Taxonomy, 2020 to 2024
    • Market Size Value (USD Million) & Volume (Units) Forecast By Market Taxonomy, 2025 to 2035
      • By Country
        • Saudi Arabia
        • Türkiye
        • South Africa
        • Other African Union
        • Rest of MEA
      • By Platform
      • By Technology
      • By Application
    • Market Attractiveness Analysis
      • By Country
      • By Platform
      • By Technology
      • By Application
    • Key Takeaways
  16. Key Countries Market Analysis
    • USA
      • Pricing Analysis
      • Market Share Analysis, 2024
        • By Platform
        • By Technology
        • By Application
    • Brazil
      • Pricing Analysis
      • Market Share Analysis, 2024
        • By Platform
        • By Technology
        • By Application
    • China
      • Pricing Analysis
      • Market Share Analysis, 2024
        • By Platform
        • By Technology
        • By Application
    • India
      • Pricing Analysis
      • Market Share Analysis, 2024
        • By Platform
        • By Technology
        • By Application
    • Europe
      • Pricing Analysis
      • Market Share Analysis, 2024
        • By Platform
        • By Technology
        • By Application
    • Germany
      • Pricing Analysis
      • Market Share Analysis, 2024
        • By Platform
        • By Technology
        • By Application
    • France
      • Pricing Analysis
      • Market Share Analysis, 2024
        • By Platform
        • By Technology
        • By Application
    • UK
      • Pricing Analysis
      • Market Share Analysis, 2024
        • By Platform
        • By Technology
        • By Application
  17. Market Structure Analysis
    • Competition Dashboard
    • Competition Benchmarking
    • Market Share Analysis of Top Players
      • By Regional
      • By Platform
      • By Technology
      • By Application
  18. Competition Analysis
    • Competition Deep Dive
      • AliveCor, Inc.
        • Overview
        • Product Portfolio
        • Profitability by Market Segments (Product/Age /Sales Channel/Region)
        • Sales Footprint
        • Strategy Overview
          • Marketing Strategy
          • Product Strategy
          • Channel Strategy
      • Powerful Medical, Inc.
        • Overview
        • Product Portfolio
        • Profitability by Market Segments (Product/Age /Sales Channel/Region)
        • Sales Footprint
        • Strategy Overview
          • Marketing Strategy
          • Product Strategy
          • Channel Strategy
      • Koninklijke Philips N.V.
        • Overview
        • Product Portfolio
        • Profitability by Market Segments (Product/Age /Sales Channel/Region)
        • Sales Footprint
        • Strategy Overview
          • Marketing Strategy
          • Product Strategy
          • Channel Strategy
      • TEMPUS
        • Overview
        • Product Portfolio
        • Profitability by Market Segments (Product/Age /Sales Channel/Region)
        • Sales Footprint
        • Strategy Overview
          • Marketing Strategy
          • Product Strategy
          • Channel Strategy
      • Medtronic
        • Overview
        • Product Portfolio
        • Profitability by Market Segments (Product/Age /Sales Channel/Region)
        • Sales Footprint
        • Strategy Overview
          • Marketing Strategy
          • Product Strategy
          • Channel Strategy
      • OMRON Healthcare Co., Ltd.
        • Overview
        • Product Portfolio
        • Profitability by Market Segments (Product/Age /Sales Channel/Region)
        • Sales Footprint
        • Strategy Overview
          • Marketing Strategy
          • Product Strategy
          • Channel Strategy
      • iRhythm Inc.
        • Overview
        • Product Portfolio
        • Profitability by Market Segments (Product/Age /Sales Channel/Region)
        • Sales Footprint
        • Strategy Overview
          • Marketing Strategy
          • Product Strategy
          • Channel Strategy
      • Bardy Diagnostics, Inc.
        • Overview
        • Product Portfolio
        • Profitability by Market Segments (Product/Age /Sales Channel/Region)
        • Sales Footprint
        • Strategy Overview
          • Marketing Strategy
          • Product Strategy
          • Channel Strategy
  19. Assumptions & Acronyms Used
  20. Research Methodology

List of Tables

  • Table 1: Global Market Value (USD Million) Forecast by Region, 2020-2035
  • Table 2: Global Market Volume (Units) Forecast by Region, 2020-2035
  • Table 3: Global Market Value (USD Million) Forecast by Platform, 2020-2035
  • Table 4: Global Market Volume (Units) Forecast by Platform, 2020-2035
  • Table 5: Global Market Value (USD Million) Forecast by Technology, 2020-2035
  • Table 6: Global Market Volume (Units) Forecast by Technology, 2020-2035
  • Table 7: Global Market Value (USD Million) Forecast by Application, 2020-2035
  • Table 8: Global Market Volume (Units) Forecast by Application, 2020-2035
  • Table 9: North America Market Value (USD Million) Forecast by Country, 2020-2035
  • Table 10: North America Market Volume (Units) Forecast by Country, 2020-2035
  • Table 11: North America Market Value (USD Million) Forecast by Platform, 2020-2035
  • Table 12: North America Market Volume (Units) Forecast by Platform, 2020-2035
  • Table 13: North America Market Value (USD Million) Forecast by Technology, 2020-2035
  • Table 14: North America Market Volume (Units) Forecast by Technology, 2020-2035
  • Table 15: North America Market Value (USD Million) Forecast by Application, 2020-2035
  • Table 16: North America Market Volume (Units) Forecast by Application, 2020-2035
  • Table 17: Latin America Market Value (USD Million) Forecast by Country, 2020-2035
  • Table 18: Latin America Market Volume (Units) Forecast by Country, 2020-2035
  • Table 19: Latin America Market Value (USD Million) Forecast by Platform, 2020-2035
  • Table 20: Latin America Market Volume (Units) Forecast by Platform, 2020-2035
  • Table 21: Latin America Market Value (USD Million) Forecast by Technology, 2020-2035
  • Table 22: Latin America Market Volume (Units) Forecast by Technology, 2020-2035
  • Table 23: Latin America Market Value (USD Million) Forecast by Application, 2020-2035
  • Table 24: Latin America Market Volume (Units) Forecast by Application, 2020-2035
  • Table 25: Western Europe Market Value (USD Million) Forecast by Country, 2020-2035
  • Table 26: Western Europe Market Volume (Units) Forecast by Country, 2020-2035
  • Table 27: Western Europe Market Value (USD Million) Forecast by Platform, 2020-2035
  • Table 28: Western Europe Market Volume (Units) Forecast by Platform, 2020-2035
  • Table 29: Western Europe Market Value (USD Million) Forecast by Technology, 2020-2035
  • Table 30: Western Europe Market Volume (Units) Forecast by Technology, 2020-2035
  • Table 31: Western Europe Market Value (USD Million) Forecast by Application, 2020-2035
  • Table 32: Western Europe Market Volume (Units) Forecast by Application, 2020-2035
  • Table 33: Eastern Europe Market Value (USD Million) Forecast by Country, 2020-2035
  • Table 34: Eastern Europe Market Volume (Units) Forecast by Country, 2020-2035
  • Table 35: Eastern Europe Market Value (USD Million) Forecast by Platform, 2020-2035
  • Table 36: Eastern Europe Market Volume (Units) Forecast by Platform, 2020-2035
  • Table 37: Eastern Europe Market Value (USD Million) Forecast by Technology, 2020-2035
  • Table 38: Eastern Europe Market Volume (Units) Forecast by Technology, 2020-2035
  • Table 39: Eastern Europe Market Value (USD Million) Forecast by Application, 2020-2035
  • Table 40: Eastern Europe Market Volume (Units) Forecast by Application, 2020-2035
  • Table 41: East Asia Market Value (USD Million) Forecast by Country, 2020-2035
  • Table 42: East Asia Market Volume (Units) Forecast by Country, 2020-2035
  • Table 43: East Asia Market Value (USD Million) Forecast by Platform, 2020-2035
  • Table 44: East Asia Market Volume (Units) Forecast by Platform, 2020-2035
  • Table 45: East Asia Market Value (USD Million) Forecast by Technology, 2020-2035
  • Table 46: East Asia Market Volume (Units) Forecast by Technology, 2020-2035
  • Table 47: East Asia Market Value (USD Million) Forecast by Application, 2020-2035
  • Table 48: East Asia Market Volume (Units) Forecast by Application, 2020-2035
  • Table 49: South Asia Market Value (USD Million) Forecast by Country, 2020-2035
  • Table 50: South Asia Market Volume (Units) Forecast by Country, 2020-2035
  • Table 51: South Asia Market Value (USD Million) Forecast by Platform, 2020-2035
  • Table 52: South Asia Market Volume (Units) Forecast by Platform, 2020-2035
  • Table 53: South Asia Market Value (USD Million) Forecast by Technology, 2020-2035
  • Table 54: South Asia Market Volume (Units) Forecast by Technology, 2020-2035
  • Table 55: South Asia Market Value (USD Million) Forecast by Application, 2020-2035
  • Table 56: South Asia Market Volume (Units) Forecast by Application, 2020-2035
  • Table 57: MEA Market Value (USD Million) Forecast by Country, 2020-2035
  • Table 58: MEA Market Volume (Units) Forecast by Country, 2020-2035
  • Table 59: MEA Market Value (USD Million) Forecast by Platform, 2020-2035
  • Table 60: MEA Market Volume (Units) Forecast by Platform, 2020-2035
  • Table 61: MEA Market Value (USD Million) Forecast by Technology, 2020-2035
  • Table 62: MEA Market Volume (Units) Forecast by Technology, 2020-2035
  • Table 63: MEA Market Value (USD Million) Forecast by Application, 2020-2035
  • Table 64: MEA Market Volume (Units) Forecast by Application, 2020-2035

List of Figures

  • Figure 1: Global Market Value (USD Million) by Platform, 2025-2035
  • Figure 2: Global Market Value (USD Million) by Technology, 2025-2035
  • Figure 3: Global Market Value (USD Million) by Application, 2025-2035
  • Figure 4: Global Market Value (USD Million) by Region, 2025-2035
  • Figure 5: Global Market Value (USD Million) Analysis by Region, 2020-2035
  • Figure 6: Global Market Volume (Units) Analysis by Region, 2020-2035
  • Figure 7: Global Market Value Share (%) and BPS Analysis by Region, 2025-2035
  • Figure 8: Global Market Y-o-Y Growth (%) Projections by Region, 2025-2035
  • Figure 9: Global Market Value (USD Million) Analysis by Platform, 2020-2035
  • Figure 10: Global Market Volume (Units) Analysis by Platform, 2020-2035
  • Figure 11: Global Market Value Share (%) and BPS Analysis by Platform, 2025-2035
  • Figure 12: Global Market Y-o-Y Growth (%) Projections by Platform, 2025-2035
  • Figure 13: Global Market Value (USD Million) Analysis by Technology, 2020-2035
  • Figure 14: Global Market Volume (Units) Analysis by Technology, 2020-2035
  • Figure 15: Global Market Value Share (%) and BPS Analysis by Technology, 2025-2035
  • Figure 16: Global Market Y-o-Y Growth (%) Projections by Technology, 2025-2035
  • Figure 17: Global Market Value (USD Million) Analysis by Application, 2020-2035
  • Figure 18: Global Market Volume (Units) Analysis by Application, 2020-2035
  • Figure 19: Global Market Value Share (%) and BPS Analysis by Application, 2025-2035
  • Figure 20: Global Market Y-o-Y Growth (%) Projections by Application, 2025-2035
  • Figure 21: Global Market Attractiveness by Platform, 2025-2035
  • Figure 22: Global Market Attractiveness by Technology, 2025-2035
  • Figure 23: Global Market Attractiveness by Application, 2025-2035
  • Figure 24: Global Market Attractiveness by Region, 2025-2035
  • Figure 25: North America Market Value (USD Million) by Platform, 2025-2035
  • Figure 26: North America Market Value (USD Million) by Technology, 2025-2035
  • Figure 27: North America Market Value (USD Million) by Application, 2025-2035
  • Figure 28: North America Market Value (USD Million) by Country, 2025-2035
  • Figure 29: North America Market Value (USD Million) Analysis by Country, 2020-2035
  • Figure 30: North America Market Volume (Units) Analysis by Country, 2020-2035
  • Figure 31: North America Market Value Share (%) and BPS Analysis by Country, 2025-2035
  • Figure 32: North America Market Y-o-Y Growth (%) Projections by Country, 2025-2035
  • Figure 33: North America Market Value (USD Million) Analysis by Platform, 2020-2035
  • Figure 34: North America Market Volume (Units) Analysis by Platform, 2020-2035
  • Figure 35: North America Market Value Share (%) and BPS Analysis by Platform, 2025-2035
  • Figure 36: North America Market Y-o-Y Growth (%) Projections by Platform, 2025-2035
  • Figure 37: North America Market Value (USD Million) Analysis by Technology, 2020-2035
  • Figure 38: North America Market Volume (Units) Analysis by Technology, 2020-2035
  • Figure 39: North America Market Value Share (%) and BPS Analysis by Technology, 2025-2035
  • Figure 40: North America Market Y-o-Y Growth (%) Projections by Technology, 2025-2035
  • Figure 41: North America Market Value (USD Million) Analysis by Application, 2020-2035
  • Figure 42: North America Market Volume (Units) Analysis by Application, 2020-2035
  • Figure 43: North America Market Value Share (%) and BPS Analysis by Application, 2025-2035
  • Figure 44: North America Market Y-o-Y Growth (%) Projections by Application, 2025-2035
  • Figure 45: North America Market Attractiveness by Platform, 2025-2035
  • Figure 46: North America Market Attractiveness by Technology, 2025-2035
  • Figure 47: North America Market Attractiveness by Application, 2025-2035
  • Figure 48: North America Market Attractiveness by Country, 2025-2035
  • Figure 49: Latin America Market Value (USD Million) by Platform, 2025-2035
  • Figure 50: Latin America Market Value (USD Million) by Technology, 2025-2035
  • Figure 51: Latin America Market Value (USD Million) by Application, 2025-2035
  • Figure 52: Latin America Market Value (USD Million) by Country, 2025-2035
  • Figure 53: Latin America Market Value (USD Million) Analysis by Country, 2020-2035
  • Figure 54: Latin America Market Volume (Units) Analysis by Country, 2020-2035
  • Figure 55: Latin America Market Value Share (%) and BPS Analysis by Country, 2025-2035
  • Figure 56: Latin America Market Y-o-Y Growth (%) Projections by Country, 2025-2035
  • Figure 57: Latin America Market Value (USD Million) Analysis by Platform, 2020-2035
  • Figure 58: Latin America Market Volume (Units) Analysis by Platform, 2020-2035
  • Figure 59: Latin America Market Value Share (%) and BPS Analysis by Platform, 2025-2035
  • Figure 60: Latin America Market Y-o-Y Growth (%) Projections by Platform, 2025-2035
  • Figure 61: Latin America Market Value (USD Million) Analysis by Technology, 2020-2035
  • Figure 62: Latin America Market Volume (Units) Analysis by Technology, 2020-2035
  • Figure 63: Latin America Market Value Share (%) and BPS Analysis by Technology, 2025-2035
  • Figure 64: Latin America Market Y-o-Y Growth (%) Projections by Technology, 2025-2035
  • Figure 65: Latin America Market Value (USD Million) Analysis by Application, 2020-2035
  • Figure 66: Latin America Market Volume (Units) Analysis by Application, 2020-2035
  • Figure 67: Latin America Market Value Share (%) and BPS Analysis by Application, 2025-2035
  • Figure 68: Latin America Market Y-o-Y Growth (%) Projections by Application, 2025-2035
  • Figure 69: Latin America Market Attractiveness by Platform, 2025-2035
  • Figure 70: Latin America Market Attractiveness by Technology, 2025-2035
  • Figure 71: Latin America Market Attractiveness by Application, 2025-2035
  • Figure 72: Latin America Market Attractiveness by Country, 2025-2035
  • Figure 73: Western Europe Market Value (USD Million) by Platform, 2025-2035
  • Figure 74: Western Europe Market Value (USD Million) by Technology, 2025-2035
  • Figure 75: Western Europe Market Value (USD Million) by Application, 2025-2035
  • Figure 76: Western Europe Market Value (USD Million) by Country, 2025-2035
  • Figure 77: Western Europe Market Value (USD Million) Analysis by Country, 2020-2035
  • Figure 78: Western Europe Market Volume (Units) Analysis by Country, 2020-2035
  • Figure 79: Western Europe Market Value Share (%) and BPS Analysis by Country, 2025-2035
  • Figure 80: Western Europe Market Y-o-Y Growth (%) Projections by Country, 2025-2035
  • Figure 81: Western Europe Market Value (USD Million) Analysis by Platform, 2020-2035
  • Figure 82: Western Europe Market Volume (Units) Analysis by Platform, 2020-2035
  • Figure 83: Western Europe Market Value Share (%) and BPS Analysis by Platform, 2025-2035
  • Figure 84: Western Europe Market Y-o-Y Growth (%) Projections by Platform, 2025-2035
  • Figure 85: Western Europe Market Value (USD Million) Analysis by Technology, 2020-2035
  • Figure 86: Western Europe Market Volume (Units) Analysis by Technology, 2020-2035
  • Figure 87: Western Europe Market Value Share (%) and BPS Analysis by Technology, 2025-2035
  • Figure 88: Western Europe Market Y-o-Y Growth (%) Projections by Technology, 2025-2035
  • Figure 89: Western Europe Market Value (USD Million) Analysis by Application, 2020-2035
  • Figure 90: Western Europe Market Volume (Units) Analysis by Application, 2020-2035
  • Figure 91: Western Europe Market Value Share (%) and BPS Analysis by Application, 2025-2035
  • Figure 92: Western Europe Market Y-o-Y Growth (%) Projections by Application, 2025-2035
  • Figure 93: Western Europe Market Attractiveness by Platform, 2025-2035
  • Figure 94: Western Europe Market Attractiveness by Technology, 2025-2035
  • Figure 95: Western Europe Market Attractiveness by Application, 2025-2035
  • Figure 96: Western Europe Market Attractiveness by Country, 2025-2035
  • Figure 97: Eastern Europe Market Value (USD Million) by Platform, 2025-2035
  • Figure 98: Eastern Europe Market Value (USD Million) by Technology, 2025-2035
  • Figure 99: Eastern Europe Market Value (USD Million) by Application, 2025-2035
  • Figure 100: Eastern Europe Market Value (USD Million) by Country, 2025-2035
  • Figure 101: Eastern Europe Market Value (USD Million) Analysis by Country, 2020-2035
  • Figure 102: Eastern Europe Market Volume (Units) Analysis by Country, 2020-2035
  • Figure 103: Eastern Europe Market Value Share (%) and BPS Analysis by Country, 2025-2035
  • Figure 104: Eastern Europe Market Y-o-Y Growth (%) Projections by Country, 2025-2035
  • Figure 105: Eastern Europe Market Value (USD Million) Analysis by Platform, 2020-2035
  • Figure 106: Eastern Europe Market Volume (Units) Analysis by Platform, 2020-2035
  • Figure 107: Eastern Europe Market Value Share (%) and BPS Analysis by Platform, 2025-2035
  • Figure 108: Eastern Europe Market Y-o-Y Growth (%) Projections by Platform, 2025-2035
  • Figure 109: Eastern Europe Market Value (USD Million) Analysis by Technology, 2020-2035
  • Figure 110: Eastern Europe Market Volume (Units) Analysis by Technology, 2020-2035
  • Figure 111: Eastern Europe Market Value Share (%) and BPS Analysis by Technology, 2025-2035
  • Figure 112: Eastern Europe Market Y-o-Y Growth (%) Projections by Technology, 2025-2035
  • Figure 113: Eastern Europe Market Value (USD Million) Analysis by Application, 2020-2035
  • Figure 114: Eastern Europe Market Volume (Units) Analysis by Application, 2020-2035
  • Figure 115: Eastern Europe Market Value Share (%) and BPS Analysis by Application, 2025-2035
  • Figure 116: Eastern Europe Market Y-o-Y Growth (%) Projections by Application, 2025-2035
  • Figure 117: Eastern Europe Market Attractiveness by Platform, 2025-2035
  • Figure 118: Eastern Europe Market Attractiveness by Technology, 2025-2035
  • Figure 119: Eastern Europe Market Attractiveness by Application, 2025-2035
  • Figure 120: Eastern Europe Market Attractiveness by Country, 2025-2035
  • Figure 121: East Asia Market Value (USD Million) by Platform, 2025-2035
  • Figure 122: East Asia Market Value (USD Million) by Technology, 2025-2035
  • Figure 123: East Asia Market Value (USD Million) by Application, 2025-2035
  • Figure 124: East Asia Market Value (USD Million) by Country, 2025-2035
  • Figure 125: East Asia Market Value (USD Million) Analysis by Country, 2020-2035
  • Figure 126: East Asia Market Volume (Units) Analysis by Country, 2020-2035
  • Figure 127: East Asia Market Value Share (%) and BPS Analysis by Country, 2025-2035
  • Figure 128: East Asia Market Y-o-Y Growth (%) Projections by Country, 2025-2035
  • Figure 129: East Asia Market Value (USD Million) Analysis by Platform, 2020-2035
  • Figure 130: East Asia Market Volume (Units) Analysis by Platform, 2020-2035
  • Figure 131: East Asia Market Value Share (%) and BPS Analysis by Platform, 2025-2035
  • Figure 132: East Asia Market Y-o-Y Growth (%) Projections by Platform, 2025-2035
  • Figure 133: East Asia Market Value (USD Million) Analysis by Technology, 2020-2035
  • Figure 134: East Asia Market Volume (Units) Analysis by Technology, 2020-2035
  • Figure 135: East Asia Market Value Share (%) and BPS Analysis by Technology, 2025-2035
  • Figure 136: East Asia Market Y-o-Y Growth (%) Projections by Technology, 2025-2035
  • Figure 137: East Asia Market Value (USD Million) Analysis by Application, 2020-2035
  • Figure 138: East Asia Market Volume (Units) Analysis by Application, 2020-2035
  • Figure 139: East Asia Market Value Share (%) and BPS Analysis by Application, 2025-2035
  • Figure 140: East Asia Market Y-o-Y Growth (%) Projections by Application, 2025-2035
  • Figure 141: East Asia Market Attractiveness by Platform, 2025-2035
  • Figure 142: East Asia Market Attractiveness by Technology, 2025-2035
  • Figure 143: East Asia Market Attractiveness by Application, 2025-2035
  • Figure 144: East Asia Market Attractiveness by Country, 2025-2035
  • Figure 145: South Asia Market Value (USD Million) by Platform, 2025-2035
  • Figure 146: South Asia Market Value (USD Million) by Technology, 2025-2035
  • Figure 147: South Asia Market Value (USD Million) by Application, 2025-2035
  • Figure 148: South Asia Market Value (USD Million) by Country, 2025-2035
  • Figure 149: South Asia Market Value (USD Million) Analysis by Country, 2020-2035
  • Figure 150: South Asia Market Volume (Units) Analysis by Country, 2020-2035
  • Figure 151: South Asia Market Value Share (%) and BPS Analysis by Country, 2025-2035
  • Figure 152: South Asia Market Y-o-Y Growth (%) Projections by Country, 2025-2035
  • Figure 153: South Asia Market Value (USD Million) Analysis by Platform, 2020-2035
  • Figure 154: South Asia Market Volume (Units) Analysis by Platform, 2020-2035
  • Figure 155: South Asia Market Value Share (%) and BPS Analysis by Platform, 2025-2035
  • Figure 156: South Asia Market Y-o-Y Growth (%) Projections by Platform, 2025-2035
  • Figure 157: South Asia Market Value (USD Million) Analysis by Technology, 2020-2035
  • Figure 158: South Asia Market Volume (Units) Analysis by Technology, 2020-2035
  • Figure 159: South Asia Market Value Share (%) and BPS Analysis by Technology, 2025-2035
  • Figure 160: South Asia Market Y-o-Y Growth (%) Projections by Technology, 2025-2035
  • Figure 161: South Asia Market Value (USD Million) Analysis by Application, 2020-2035
  • Figure 162: South Asia Market Volume (Units) Analysis by Application, 2020-2035
  • Figure 163: South Asia Market Value Share (%) and BPS Analysis by Application, 2025-2035
  • Figure 164: South Asia Market Y-o-Y Growth (%) Projections by Application, 2025-2035
  • Figure 165: South Asia Market Attractiveness by Platform, 2025-2035
  • Figure 166: South Asia Market Attractiveness by Technology, 2025-2035
  • Figure 167: South Asia Market Attractiveness by Application, 2025-2035
  • Figure 168: South Asia Market Attractiveness by Country, 2025-2035
  • Figure 169: MEA Market Value (USD Million) by Platform, 2025-2035
  • Figure 170: MEA Market Value (USD Million) by Technology, 2025-2035
  • Figure 171: MEA Market Value (USD Million) by Application, 2025-2035
  • Figure 172: MEA Market Value (USD Million) by Country, 2025-2035
  • Figure 173: MEA Market Value (USD Million) Analysis by Country, 2020-2035
  • Figure 174: MEA Market Volume (Units) Analysis by Country, 2020-2035
  • Figure 175: MEA Market Value Share (%) and BPS Analysis by Country, 2025-2035
  • Figure 176: MEA Market Y-o-Y Growth (%) Projections by Country, 2025-2035
  • Figure 177: MEA Market Value (USD Million) Analysis by Platform, 2020-2035
  • Figure 178: MEA Market Volume (Units) Analysis by Platform, 2020-2035
  • Figure 179: MEA Market Value Share (%) and BPS Analysis by Platform, 2025-2035
  • Figure 180: MEA Market Y-o-Y Growth (%) Projections by Platform, 2025-2035
  • Figure 181: MEA Market Value (USD Million) Analysis by Technology, 2020-2035
  • Figure 182: MEA Market Volume (Units) Analysis by Technology, 2020-2035
  • Figure 183: MEA Market Value Share (%) and BPS Analysis by Technology, 2025-2035
  • Figure 184: MEA Market Y-o-Y Growth (%) Projections by Technology, 2025-2035
  • Figure 185: MEA Market Value (USD Million) Analysis by Application, 2020-2035
  • Figure 186: MEA Market Volume (Units) Analysis by Application, 2020-2035
  • Figure 187: MEA Market Value Share (%) and BPS Analysis by Application, 2025-2035
  • Figure 188: MEA Market Y-o-Y Growth (%) Projections by Application, 2025-2035
  • Figure 189: MEA Market Attractiveness by Platform, 2025-2035
  • Figure 190: MEA Market Attractiveness by Technology, 2025-2035
  • Figure 191: MEA Market Attractiveness by Application, 2025-2035
  • Figure 192: MEA Market Attractiveness by Country, 2025-2035

Frequently Asked Questions

How big is the Global AI-based Atrial Fibrillation (AFib) Detection Market in 2025?

The Global AI-based AFib Detection Market is estimated to be valued at USD 8,097.9 million in 2025.

What will be the size of the Global AI-based AFib Detection Market in 2035?

The market size is projected to reach USD 53,477.5 million by 2035.

How much will the Global AI-based AFib Detection Market grow between 2025 and 2035?

The market is expected to grow at a CAGR of 20.8% during this period.

What are the key platform types in the Global AI-based AFib Detection Market?

Key platforms include Clinical AI Systems, Remote Monitoring, Wearables, and Smartphone Apps.

Which application segment will contribute a significant share in the Global AI-based AFib Detection Market in 2025?

Continuous Rhythm Monitoring is projected to command 30% of the market in 2025.

Explore Similar Insights

Future Market Insights

AI-based Atrial Fibrillation AFib Detection Market