Cellulite Reduction Treatments Market Size and Share Forecast Outlook 2025 to 2035

A valuation of USD 3,900.50 Million in 2025 has been projected for the Cellulite Reduction Treatments Market, with expansion expected to push the figure to USD 9,805.40 Million by 2035. Over the ten-year horizon, an absolute increase of nearly USD 5,905 Million is anticipated, reflecting a CAGR of 9.70% and more than a twofold rise in overall market value. The trajectory underscores the category’s resilience as routine-driven beauty care merges with evidence-based approaches, enabling structured long-term adoption.
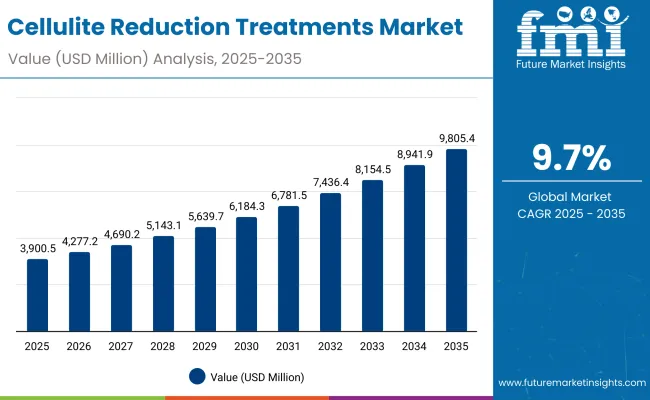
Cellulite Reduction Treatments Market Value Analysis

Quick Stats for Cellulite Reduction Treatments Market

  • Cellulite Reduction Treatments Market Value (2025): USD 3,900.50 Million
  • Cellulite Reduction Treatments Market Forecast Value (2035): USD 9,805.40 Million
  • Cellulite Reduction Treatments Market Forecast CAGR: 9.70%
  • Leading Segment in Cellulite Reduction Treatments Market in 2025: Topical creams and gels (54.10%)
  • Key Growth Regions in the Cellulite Reduction Treatments Market: United States, China, India, Japan, Europe
  • Top Key Players in Cellulite Reduction Treatments Market: Clarins, Nivea, Weleda, Biotherm, Murad, Shiseido, Sisley Paris, Dermalogica, Mustela, Palmer’s

Cellulite Reduction Treatments Market Key Takeaways

Metric Value
Cellulite Reduction Treatments Market Estimated Value in (2025E) USD 3,900.50 Million
Cellulite Reduction Treatments Market Forecast Value in (2035F) USD 9,805.40 Million
Forecast CAGR (2025 to 2035) 9.70%

During the initial five-year period from 2025 to 2030, the market is forecast to climb from USD 3,900.50 Million to USD 6,184.30 Million, generating an additional USD 2,283.80 Million. This phase is expected to account for approximately 39% of the total decade’s growth, underpinned by rising demand for accessible at-home solutions supported by professional recommendations. Growth during this interval is projected to be led by topical creams and gels, which are estimated to contribute 54.10% of market share in 2025, owing to consistent repeat purchase behavior and high consumer acceptance.

From 2030 to 2035, the market is anticipated to accelerate further, expanding from USD 6,184.30 Million to USD 9,805.40 Million. This surge of USD 3,621.10 Million will represent about 61% of total growth, signaling faster adoption of digitally enabled channels and protocol-based regimens combining firming, toning, and complementary formats.

By function, firming/toning solutions are forecast to hold a 49.90% share in 2025, supported by clinical substantiation and consumer preference for visible outcomes. Meanwhile, e-commerce is expected to capture 48.80% share in 2025, with momentum set to intensify as digital discovery and social commerce increasingly drive market expansion.

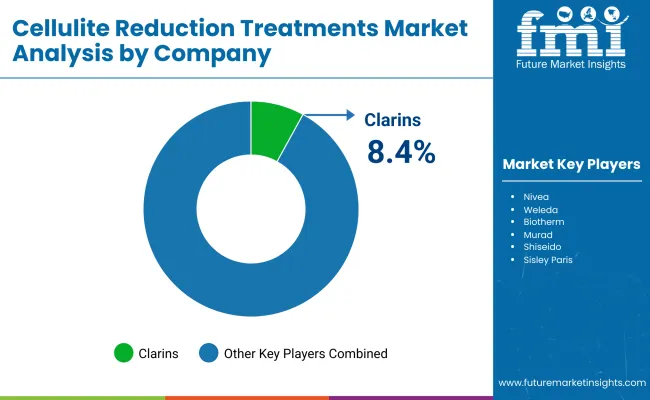
From 2025 to 2035, the market is anticipated to expand strongly, with growth driven by routine-oriented personal care and rising adoption of protocol-based regimens combining topical formats and professional adjuncts. The competitive environment is expected to remain fragmented, as the leading player captures only 8.40% share in 2025, highlighting opportunities for brand differentiation.

Online channels are forecast to strengthen influence, as e-commerce already accounts for 48.80% share in 2025. Regional momentum is projected to be fastest in India and China, with double-digit CAGRs supported by expanding beauty e-commerce ecosystems and rising disposable incomes. Europe and the United States are expected to sustain steady demand, anchored by mature dermatology and pharmacy retail networks. The decade ahead is likely to be defined by innovation in formulation efficacy, digital commerce acceleration, and stronger clinical validation, positioning the category for enduring growth.

Why the Cellulite Reduction Treatments Market is growing?

Growth in the Cellulite Reduction Treatments Market is being supported by evolving consumer behavior, technological improvements, and expanding access to digital retail channels. Rising awareness of body aesthetics and skin health has been reinforced by social media and influencer-driven education, creating sustained demand for visible results.

Clinical validation of firming and toning benefits has been emphasized, strengthening trust in formulations and adjunctive protocols. Expanding e-commerce platforms have accelerated product discovery and routine adoption, while bundled regimens supported by dermatology and aesthetic clinics have been promoted to enhance adherence.

Emerging markets such as China and India are witnessing rapid uptake due to rising disposable incomes and wider access to specialized beauty channels. Demand is also being influenced by innovations in plant extract and caffeine-based formulations, aligning with consumer preference for natural and evidence-backed solutions. As digital commerce matures and clinic-supported offerings become standardized, the category is expected to sustain long-term growth momentum.

Segmental Analysis

The Cellulite Reduction Treatments Market has been segmented by treatment type, function, and channel, each shaping distinct growth pathways. By treatment type, adoption has been driven by topical applications, which continue to dominate due to accessibility and affordability. By function, the market reflects balanced demand, though firming and toning benefits are increasingly emphasized for visible results.

By channel, digital platforms have emerged as critical growth enablers, with e-commerce steadily gaining ground against traditional outlets. Each of these segments is expected to evolve under the influence of clinical validation, consumer preference for convenience, and the growing role of digital discovery in beauty and personal care.
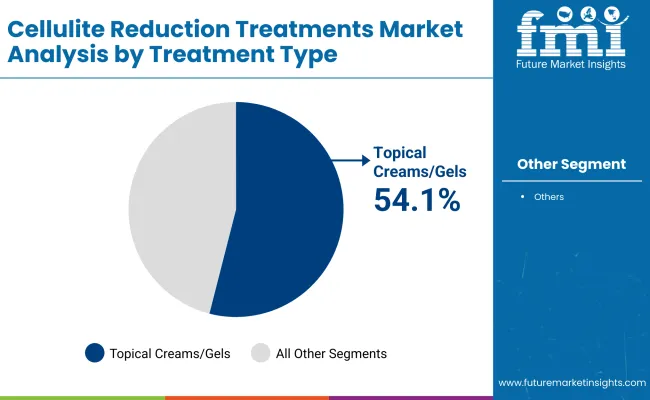
Insights into the Treatment Type Segment with Topical Creams and Gels Leading in Market Share

Cellulite Reduction Treatments Market By Treatment Type

Treatment Type Market Value Share, 2025
Topical creams/gels 54.1%
Others 45.9%

Topical creams and gels are projected to command 54.1% share in 2025, valued at USD 2,127.3 Million, while others are expected to contribute 45.9% at USD 1,789.73 Million. This dominance is anticipated due to their affordability, accessibility, and integration into daily skincare routines. Their role is expected to be reinforced by strong brand loyalty and consistent consumer demand.

Enhanced formulations with clinically supported actives are forecasted to strengthen efficacy perceptions and long-term usage. With repeat purchase cycles supporting revenue stability, this segment is expected to remain the backbone of the category. While the others category will provide meaningful contribution, consumer adoption is expected to be concentrated on topical-led formats, ensuring their continued lead in the treatment landscape.
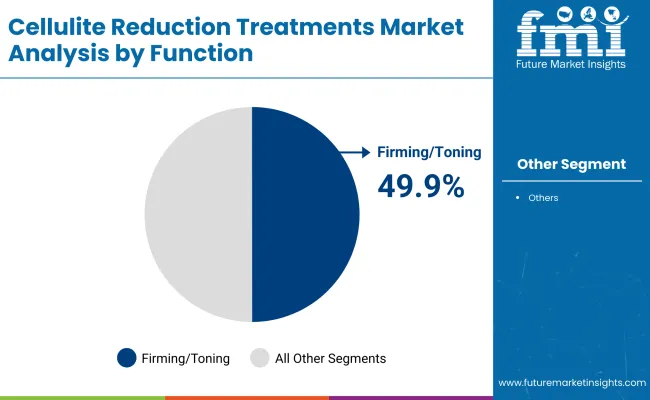
Insights into the Function Segment with Firming and Toning Driving Market Demand

Cellulite Reduction Treatments Market By Function

Function Market Value Share, 2025
Firming/toning 49.9%
Others 50.1%

Firming and toning are estimated to hold 49.9% share in 2025 at USD 1,930.3 Million, while others are projected to account for 50.1% at USD 1,952.22 Million. Despite near parity, the firming and toning category is expected to emerge as a core driver of market expansion, supported by consumer interest in visibly improved skin elasticity and texture.

Adoption is anticipated to strengthen as clinical evidence and targeted messaging increase trust in outcomes. The category is expected to gain further traction through protocol-based routines that combine firming benefits with hydration or anti-inflammatory effects. Meanwhile, the others category is projected to deliver stable growth, broadening market scope through diversified benefits, though its appeal is expected to be more fragmented compared to firming-led solutions.
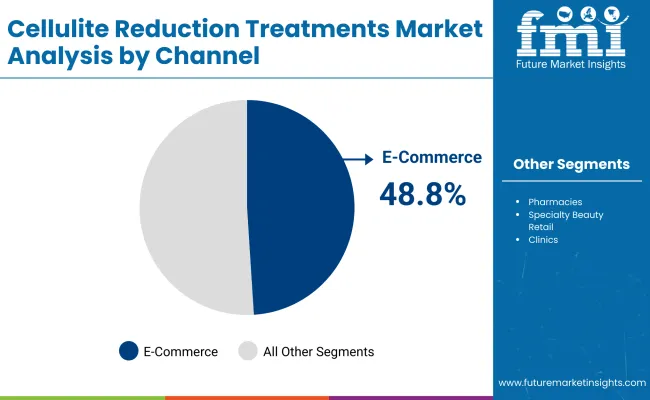
Insights into the Channel Segment with E-commerce Rising as a Key Driver

Cellulite Reduction Treatments Market By Channel

Channel Market Value Share, 2025
E-commerce 48.8%
Others 51.2%

E-commerce is anticipated to represent 48.8% of value in 2025 at USD 1,890.9 Million, while others are projected to contribute 51.2% at USD 1,995.16 Million. Digital platforms are expected to shape consumer behavior through convenience, personalization, and influencer-driven campaigns. Online sales are projected to grow as mobile penetration, subscription services, and social commerce accelerate engagement.

Greater reliance on virtual consultations, authentic reviews, and clinical content is forecasted to enhance trust in digital-first purchases. While pharmacies and specialty stores within the others category will continue to hold importance, their share is expected to gradually decline as consumers increasingly prefer flexible, digital-first purchase pathways. This dynamic positions e-commerce as the structural growth engine of the market over the coming decade.

What are the Drivers, Restraints, and Key Trends of the Cellulite Reduction Treatments Market?

Complex consumer expectations, heightened scrutiny of clinical efficacy, and digital transformation pressures are reshaping the Cellulite Reduction Treatments Market, where adoption is being influenced as much by regulatory vigilance and channel evolution as by functional innovation and consumer willingness to experiment.

Convergence of Clinical Validation and Consumer Marketing A critical driver is expected to be the merging of clinical validation with consumer-facing communication. Treatments supported by dermatologist-led trials, imaging-based outcomes, or peer-reviewed endorsements are projected to command greater credibility in an environment where trust remains decisive.

This validation is anticipated to not only reassure consumers but also encourage repeat adoption by aligning aesthetic aspirations with scientific substantiation. Strategic messaging that translates complex clinical data into digestible consumer narratives is expected to bridge gaps in understanding and sustain differentiation. Over the next decade, growth momentum is likely to favor brands that can standardize outcome evidence and pair it with accessible digital storytelling, positioning clinical rigor as a marketing asset rather than a regulatory obligation.

Fragmentation of Standards Across Global Markets A major restraint is expected to stem from fragmented regulatory and marketing standards across geographies. Requirements for labeling, permissible claims, and ingredient approvals vary significantly between the United States, Europe, and Asia, complicating cross-border scalability. This lack of uniformity is anticipated to slow multinational expansion and elevate compliance costs.

While consumers in some markets prioritize natural actives, others emphasize clinically proven synthetic compounds, further challenging global portfolio harmonization. The absence of standardized benchmarks for outcome measurement also risks inconsistent consumer experiences, potentially eroding confidence. Unless harmonized frameworks or self-regulated industry standards emerge, the category is projected to face slower international rollout, with fragmentation acting as a barrier to economies of scale and seamless global branding.
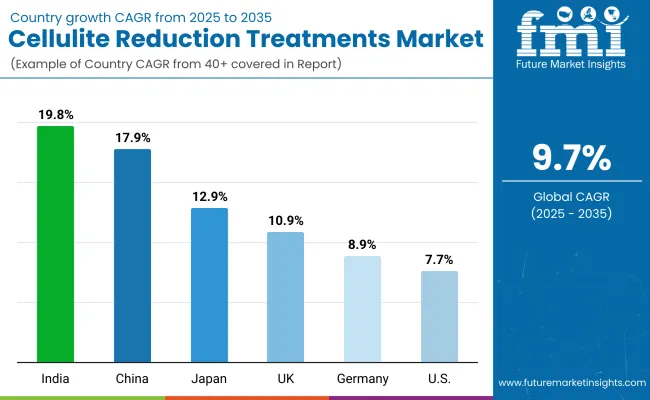
Analysis of Cellulite Reduction Treatments Market By Key Countries

Cellulite Reduction Treatments Market Country Wise Analysis

Country CAGR
China 17.9%
USA 7.7%
India 19.8%
UK 10.9%
Germany 8.9%
Japan 12.9%

The global Cellulite Reduction Treatments Market is expected to display varied growth momentum across countries, shaped by healthcare access, beauty retail maturity, and consumer readiness for evidence-based body treatments. India is projected to emerge as the fastest-growing market with a CAGR of 19.8%, supported by rapid digital commerce penetration, expanding middle-class incomes, and increasing acceptance of advanced skincare routines.

China, with a CAGR of 17.9%, is anticipated to follow closely, as digital-first ecosystems and clinic-led beauty protocols reinforce adoption. Japan is expected to grow at 12.9%, benefiting from its established consumer culture around routine-driven beauty care and integration of device-friendly solutions.

In Europe, moderate yet steady expansion is anticipated, led by the UK at 10.9%, Germany at 8.9%, and the broader European market at 8.3%. Growth in these regions is expected to be underpinned by pharmacy and specialty retail networks, combined with regulatory emphasis on product safety and transparency.

The USA, while showing a more mature profile at 7.7% CAGR, is projected to sustain demand through premiumization, oMillioni-channel dermatology, and steady clinical endorsements. This geographic divergence reflects how cultural preferences, digital sophistication, and clinical frameworks are expected to determine the pace and direction of cellulite reduction adoption worldwide.
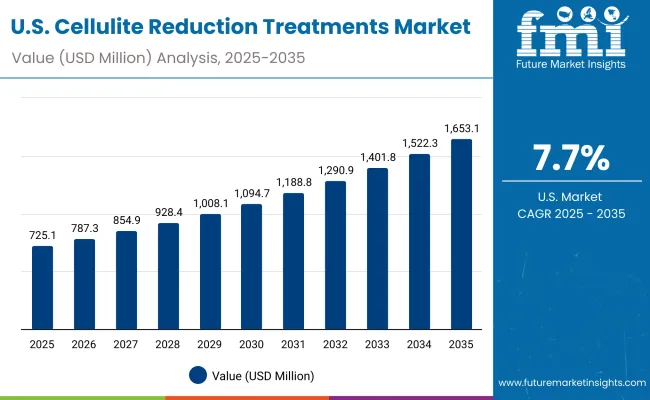
Sales Outlook for Cellulite Reduction Treatments in the United States

Usa Cellulite Reduction Treatments Market

Year USA Cellulite Reduction Treatments Market (USD Million)
2025 725.06
2026 787.34
2027 854.98
2028 928.43
2029 1,008.19
2030 1,094.79
2031 1,188.84
2032 1,290.97
2033 1,401.87
2034 1,522.30
2035 1,653.08

The United States Cellulite Reduction Treatments Market is projected to grow at a CAGR of 8.9% from 2025 to 2035, expanding from USD 725.06 Million in 2025 to USD 1,653.08 Million by 2035. Growth is expected to be reinforced by the rising influence of e-commerce platforms, combined with clinic-led endorsements that enhance credibility and long-term adherence.

Premiumization trends are forecast to encourage higher per capita spending, as topical creams and gels remain dominant within treatment preferences. Integration of clinical validation with consumer-facing retail strategies is anticipated to sustain adoption, particularly as demand shifts toward evidence-backed, protocol-based regimens. Digital-first engagement, subscription models, and influencer-led marketing are projected to further accelerate uptake.

  • Premium positioning of topical-based treatments is expected to anchor revenue expansion across the decade.
  • OMillioni-channel distribution, combining e-commerce with specialty retail and dermatology clinics, is projected to secure strong consumer trust and repeat purchasing cycles.
  • Digital discovery and personalized shopping journeys are anticipated to drive incremental growth, positioning the USA as a mature yet resilient market.

Growth and Expansion Outlook for Cellulite Reduction Treatments Market in the United Kingdom

The United Kingdom Cellulite Reduction Treatments Market is projected to grow at a CAGR of 10.9% between 2025 and 2035, supported by steady consumer engagement with premium skincare and established retail pharmacy networks. Growth is expected to be shaped by strong demand for clinically validated topical regimens and digital-first purchase behavior. The shift toward evidence-based messaging in beauty care is anticipated to strengthen trust, while the expansion of subscription-based online retail models is likely to reinforce adherence. Regulatory clarity on product labeling and claims is projected to maintain consumer confidence.

  • Premium body-care categories are expected to capture consumer interest through enhanced efficacy positioning.
  • Digital retail platforms are anticipated to drive channel diversification beyond traditional outlets.
  • Clinic endorsements are projected to expand demand for evidence-supported treatment routines.
  • Regulatory frameworks are expected to preserve consumer trust and brand credibility.

Growth and Expansion Outlook for Cellulite Reduction Treatments Market in India

The India Cellulite Reduction Treatments Market is forecast to expand at a CAGR of 19.8% from 2025 to 2035, making it the fastest-growing country market globally. Growth is anticipated to be driven by rapid e-commerce penetration, rising disposable incomes, and increased urban adoption of advanced body-care routines.

The integration of locally relevant ingredients with international formulations is expected to enhance resonance among consumers. Social commerce platforms are projected to accelerate awareness and conversion, particularly in tier-II and tier-III cities. Clinic-based partnerships are anticipated to expand reach, reinforcing evidence-backed adoption and aspirational purchasing.

  • Digital-first commerce ecosystems are expected to define adoption pathways.
  • Localized formulations with natural actives are anticipated to enhance consumer affinity.
  • Clinic partnerships are projected to strengthen credibility in emerging urban clusters.
  • High-income millennial and Gen Z cohorts are expected to sustain premiumization momentum.

Sales Outlook for Cellulite Reduction Treatments in China

The China Cellulite Reduction Treatments Market is projected to grow at a CAGR of 17.9% during 2025 to 2035, driven by strong digital ecosystems and expanding aesthetic clinic networks. The country’s advanced e-commerce infrastructure is anticipated to play a central role in shaping awareness and sustained adoption.

Clinical protocols embedded within beauty ecosystems are expected to reinforce trust, with integration of advanced actives likely to secure wider adoption. The convergence of social media, live commerce, and dermatologist-led endorsements is forecast to maintain high engagement levels. International and domestic brands are expected to compete through differentiated positioning and localized campaigns.
  • Social commerce and influencer ecosystems are expected to accelerate consumer education.
  • Aesthetic clinic integration is anticipated to sustain evidence-based demand.
  • Local and global brand competition is projected to intensify through digital-first campaigns.
  • Strong urban middle-class spending is expected to drive premium adoption.

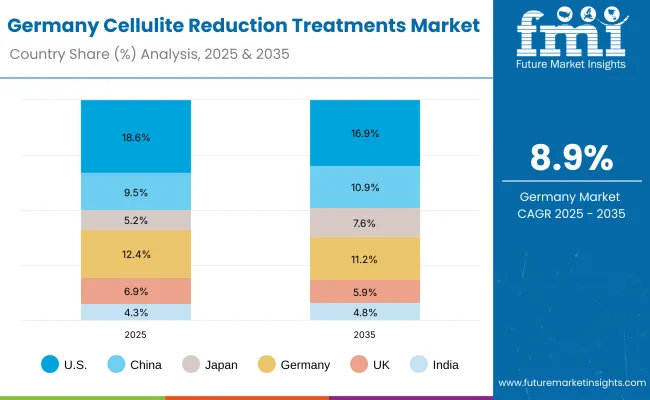
In-depth Analysis of Cellulite Reduction Treatments in Germany

Germany Cellulite Reduction Treatments Market

Countries 2025
USA 18.6%
China 9.5%
Japan 5.2%
Germany 12.4%
UK 6.9%
India 4.3%
Countries 2035
USA 16.9%
China 10.9%
Japan 7.6%
Germany 11.2%
UK 5.9%
India 4.8%

The Germany Cellulite Reduction Treatments Market is forecast to register a CAGR of 8.9% between 2025 and 2035, anchored by the strength of pharmacy channels and consumer preference for safety-certified formulations. Growth is expected to be steady, supported by regulatory alignment with EU-wide standards and rising interest in dermo-cosmetic solutions.

A growing focus on clinically endorsed products is anticipated to encourage long-term adoption, while e-commerce is projected to gradually expand its role alongside established specialty retailers. The market outlook is expected to be influenced by conservative consumer behavior, favoring transparency, efficacy, and incremental innovation.
  • Regulatory rigor is projected to sustain brand trust and compliance-led growth.
  • Pharmacy and dermo-cosmetic channels are expected to remain influential distribution nodes.
  • Clinical substantiation is anticipated to guide consumer preference for effective treatments.
  • E-commerce adoption is projected to steadily expand, though traditional channels will remain dominant.

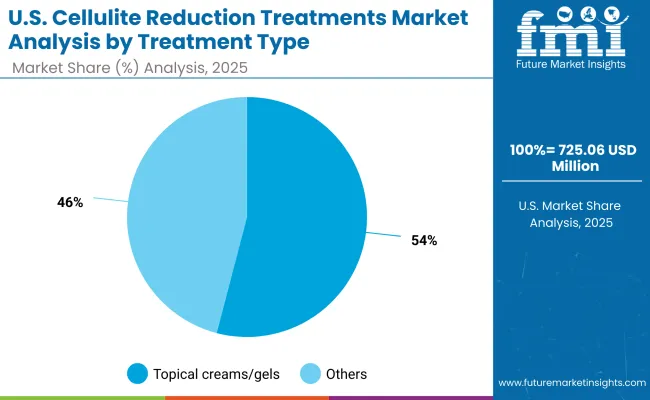
Growth Outlook for Cellulite Reduction Treatments Market in USA

Usa Cellulite Reduction Treatments Market By Treatment Type

USA by Treatment Type Market Value Share, 2025
Topical creams/gels 54.1%
Others 45.9%

The United States Cellulite Reduction Treatments Market is projected at USD 725.06 Million in 2025. Topical creams and gels contribute 54.1% with USD 392.4 Million, while other formats account for 45.9% with USD 332.69 Million. This clear topical dominance reflects consumer preference for accessible, routine-friendly products supported by strong brand trust and ease of integration into daily care.

Formulation innovation with clinically validated actives such as caffeine and plant extracts is expected to reinforce topical leadership. Unlike device-based or procedural formats, topical solutions offer recurring revenue potential through high-frequency purchases, ensuring sustained category momentum.

Others, although significant, are projected to capture secondary adoption, often linked to adjunctive or experimental use cases. Over the coming decade, competitive positioning in the USA market is expected to be defined by how effectively brands align evidence-based efficacy with consumer convenience and digital-first engagement.
  • USA market valued at USD 725.06 Million in 2025 within global landscape
  • Topical creams and gels lead with 54.1% share against 45.9% for others
  • Clinical validation and daily use convenience expected to drive topical expansion
  • High repeat purchase potential reinforces resilience of topical-led growth

Opportunity Analysis of China Cellulite Reduction Treatments Market

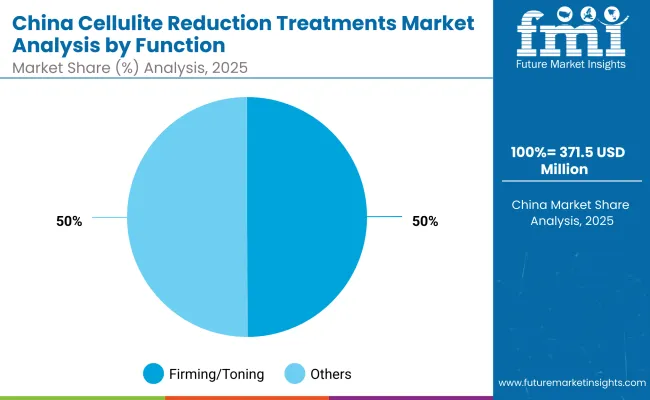
China Cellulite Reduction Treatments Market By Function

China by Function Market Value Share, 2025
Firming/toning 49.9%
Others 50.1%

The China Cellulite Reduction Treatments Market is projected at USD 371.53 Million in 2025. Firming and toning solutions contribute 49.9% with USD 185.6 Million, while other functions hold 50.1% with USD 185.95 Million, indicating a near-balanced functional split. The close distribution highlights a market where both visible toning outcomes and broader skin-health benefits are valued equally by consumers.

Firming and toning products are expected to gain traction due to strong alignment with aspirations for body confidence and smoothness, supported by clinic-led education and dermatologist-backed messaging. The others category, incorporating hydration, smoothing, and complementary benefits, is anticipated to remain critical as multi-benefit regimens become more common.

With China’s strong digital commerce ecosystem, both categories are forecast to expand rapidly, but firming-led solutions are expected to achieve greater brand loyalty through outcome-oriented positioning.
  • China market projected at USD 371.53 Million in 2025
  • Firming and toning functions at 49.9% (USD 185.6 Million) vs. others at 50.1% (USD 185.95 Million)
  • Functional parity expected, but firming benefits likely to build stronger repeat adoption
  • Growth reinforced by digital-first beauty ecosystems and clinic endorsements

Competitive Landscape of Cellulite Reduction Treatments Market

Cellulite Reduction Treatments Market By Company

Company Global Value Share 2025
Clarins 8.4%
Others 91.6%

The Cellulite Reduction Treatments Market is moderately fragmented, with premium beauty houses, dermo-cosmetic specialists, and clinic-affiliated brands competing across consumer and professional channels. Global beauty leaders such as Clarins, Shiseido, and Nivea are understood to hold meaningful shares, aided by extensive retail footprints, consistent brand equity, and clinically communicated claims.

Their strategies are expected to emphasize evidence-backed formulations, regimen bundling, and oMillionichannel activation that links e-commerce with pharmacy and specialty beauty retail.Established mid-tier players-including Murad, Dermalogica, Sisley Paris, Biotherm, Mustela, Palmer’s, and Weleda-are projected to scale through targeted benefits (firming, smoothing) and dermatologist-endorsed education.

Portfolio refreshes with caffeine and plant-extract actives, plus subscription and loyalty mechanics, are anticipated to lift repeat purchase.Clinic-adjacent propositions and niche brands are expected to expand through protocol integration, where at-home topicals are paired with in-clinic guidance or device-assisted regimens.

Differentiation is shifting from single-product claims toward program design-measurable outcomes, safe-use guidance, and digital coaching-supported by authentic reviews and creator education.Competitive intensity is likely to increase as Asia-focused challengers deploy social commerce and localized campaigns. Over the decade, winners are expected to be those that couple credible clinical evidence with convenient routines and seamless online replenishment.

Key Developments in Cellulite Reduction Treatments Market

  • On March 12, 2025, Clarins introduced its reformulated Body Fit Active Skin Smoothing Expert for cellulite reduction. The launch featured a new botanical complex with caffeine and matcha tea, positioned to deliver visible contouring and smoother skin outcomes in daily routines.
  • On May 28, 2025, a GMI Insights report emphasized rising adoption of non-invasive cellulite treatments such as radiofrequency and ultrasound. The trend was highlighted as a key growth catalyst, with clinics increasingly offering low-downtime protocols to meet consumer demand for safer, evidence-backed results.

Scope of the Report

Item Value
Market Size (2025) USD 3,900.50 Million
Market Size (2035) USD 9,805.40 Million
Growth (2025 to 2035) USD 5,904.90 Million absolute increase
Forecast CAGR (2025 to 2035) 9.70%
Treatment Type Topical creams/gels; Others
Treatment Type Leader (2025) Topical creams/gels - 54.10% share (USD 2,127.30 Million )
Function Firming/toning; Others
Function Split (2025) Firming/toning - 49.90% (USD 1,930.30 Million ); Others - 50.10% (USD 1,952.22 Million )
Channel E-commerce; Others (pharmacies, specialty beauty retail, clinics)
Channel Split (2025) E-commerce - 48.80% (USD 1,890.90 Million ); Others - 51.20% (USD 1,995.16 Million )
Regions Covered North America; Europe; Asia-Pacific; Latin America; Middle East & Africa
Countries Covered United States; Canada; Germany; France; United Kingdom; China; Japan; India; Brazil; South Africa
Key Companies Profiled Clarins; Nivea; Weleda; Biotherm; Murad; Shiseido; Sisley Paris; Dermalogica; Mustela; Palmer’s
Competitive Snapshot (2025) Market leader: Cl arins - 8.40% global value share; Others - 91.60%
USA Market Trajectory USD 725.06 Million (2025) → USD 1,653.08 Million (2035)
China 2025 Functional Split Firming/toning - 49.90% (USD 185.60 Million ); Others - 50.10% (USD 185.95 Million )
Additional Attributes Dollar sales by treatment type, function, and channel; protocol-based adoption with clinic support; digital commerce acceleration and subscription replenishment; evidence-backed formulations (e.g., caffeine, plant extracts); fragmented competition with premiumization; regional growth led by India (19.80% CAGR) and China (17.90% CAGR).

Key Segments

By Treatment Type:

  • Topical creams/gels
  • Massage oils/serums
  • Device-based adjuncts (rollers, massagers)
  • Clinic procedures support (RF/laser adjuncts)

By Function:

  • Firming/toning
  • Fat metabolism boost
  • Hydration & smoothing
  • Anti-inflammatory

By Active Ingredient:

  • Caffeine
  • Retinol
  • Aminophylline
  • Plant extracts (centella, ginkgo)

By Channel:

  • E-commerce
  • Pharmacies
  • Specialty beauty retail
  • Clinics

By Region:

  • North America
  • Latin America
  • Europe
  • East Asia
  • South Asia & Pacific
  • Middle East and Africa

Table of Content

  1. Executive Summary
    • Global Market Outlook
    • Demand-side Trends
    • Supply-side Trends
    • Technology Roadmap Analysis
    • Analysis and Recommendations
  2. Market Overview
    • Market Coverage / Taxonomy
    • Market Definition / Scope / Limitations
  3. Market Background
    • Market Dynamics
      • Drivers
      • Restraints
      • Opportunity
      • Trends
    • Scenario Forecast
      • Demand in Optimistic Scenario
      • Demand in Likely Scenario
      • Demand in Conservative Scenario
    • Opportunity Map Analysis
    • Product Life Cycle Analysis
    • Supply Chain Analysis
      • Supply Side Participants and their Roles
        • Producers
        • Mid-Level Participants (Traders/ Agents/ Brokers)
        • Wholesalers and Distributors
      • Value Added and Value Created at Node in the Supply Chain
      • List of Raw Material Suppliers
      • List of Existing and Potential Buyer’s
    • Investment Feasibility Matrix
    • Value Chain Analysis
      • Profit Margin Analysis
      • Wholesalers and Distributors
      • Retailers
    • PESTLE and Porter’s Analysis
    • Regulatory Landscape
      • By Key Regions
      • By Key Countries
    • Regional Parent Market Outlook
    • Production and Consumption Statistics
    • Import and Export Statistics
  4. Global Market Analysis 2020 to 2024 and Forecast, 2025 to 2035
    • Historical Market Size Value (USD Million) & Volume (Units) Analysis, 2020 to 2024
    • Current and Future Market Size Value (USD Million) & Volume (Units) Projections, 2025 to 2035
      • Y-o-Y Growth Trend Analysis
      • Absolute $ Opportunity Analysis
  5. Global Market Analysis 2020 to 2024 and Forecast 2025 to 2035, By Treatment Type
    • Introduction / Key Findings
    • Historical Market Size Value (USD Million) & Volume (Units) Analysis By Treatment Type, 2020 to 2024
    • Current and Future Market Size Value (USD Million) & Volume (Units) Analysis and Forecast By Treatment Type, 2025 to 2035
      • Topical creams/gels
      • Massage oils/serums
      • Device-based adjuncts (rollers, massagers)
      • Clinic procedures support (RF/laser adjuncts)
    • Y-o-Y Growth Trend Analysis By Treatment Type, 2020 to 2024
    • Absolute $ Opportunity Analysis By Treatment Type, 2025 to 2035
  6. Global Market Analysis 2020 to 2024 and Forecast 2025 to 2035, By Function
    • Introduction / Key Findings
    • Historical Market Size Value (USD Million) & Volume (Units) Analysis By Function, 2020 to 2024
    • Current and Future Market Size Value (USD Million) & Volume (Units) Analysis and Forecast By Function, 2025 to 2035
      • Firming/toning
      • Fat metabolism boost
      • Hydration & smoothing
      • Anti-inflammatory
    • Y-o-Y Growth Trend Analysis By Function, 2020 to 2024
    • Absolute $ Opportunity Analysis By Function, 2025 to 2035
  7. Global Market Analysis 2020 to 2024 and Forecast 2025 to 2035, By Active Ingredient
    • Introduction / Key Findings
    • Historical Market Size Value (USD Million) & Volume (Units) Analysis By Active Ingredient, 2020 to 2024
    • Current and Future Market Size Value (USD Million) & Volume (Units) Analysis and Forecast By Active Ingredient, 2025 to 2035
      • Caffeine
      • Retinol
      • Aminophylline
      • Plant extracts (centella, ginkgo)
    • Y-o-Y Growth Trend Analysis By Active Ingredient, 2020 to 2024
    • Absolute $ Opportunity Analysis By Active Ingredient, 2025 to 2035
  8. Global Market Analysis 2020 to 2024 and Forecast 2025 to 2035, By Channel
    • Introduction / Key Findings
    • Historical Market Size Value (USD Million) & Volume (Units) Analysis By Channel, 2020 to 2024
    • Current and Future Market Size Value (USD Million) & Volume (Units) Analysis and Forecast By Channel, 2025 to 2035
      • E-commerce
      • Pharmacies
      • Specialty beauty retail
      • Clinics
    • Y-o-Y Growth Trend Analysis By Channel, 2020 to 2024
    • Absolute $ Opportunity Analysis By Channel, 2025 to 2035
  9. Global Market Analysis 2020 to 2024 and Forecast 2025 to 2035, By Region
    • Introduction
    • Historical Market Size Value (USD Million) & Volume (Units) Analysis By Region, 2020 to 2024
    • Current Market Size Value (USD Million) & Volume (Units) Analysis and Forecast By Region, 2025 to 2035
      • North America
      • Latin America
      • Europe
      • East Asia
      • South Asia & Pacific
      • Middle East and Africa
    • Market Attractiveness Analysis By Region
  10. North America Market Analysis 2020 to 2024 and Forecast 2025 to 2035, By Country
    • Historical Market Size Value (USD Million) & Volume (Units) Trend Analysis By Market Taxonomy, 2020 to 2024
    • Market Size Value (USD Million) & Volume (Units) Forecast By Market Taxonomy, 2025 to 2035
      • By Country
        • USA
        • Canada
      • By Treatment Type
      • By Function
      • By Active Ingredient
      • By Channel
    • Market Attractiveness Analysis
      • By Country
      • By Treatment Type
      • By Function
      • By Active Ingredient
      • By Channel
    • Key Takeaways
  11. Latin America Market Analysis 2020 to 2024 and Forecast 2025 to 2035, By Country
    • Historical Market Size Value (USD Million) & Volume (Units) Trend Analysis By Market Taxonomy, 2020 to 2024
    • Market Size Value (USD Million) & Volume (Units) Forecast By Market Taxonomy, 2025 to 2035
      • By Country
        • Brazil
        • Mexico
        • Colombia
        • Rest of Latin America
      • By Treatment Type
      • By Function
      • By Active Ingredient
      • By Channel
    • Market Attractiveness Analysis
      • By Country
      • By Treatment Type
      • By Function
      • By Active Ingredient
      • By Channel
    • Key Takeaways
  12. Europe Market Analysis 2020 to 2024 and Forecast 2025 to 2035, By Country
    • Historical Market Size Value (USD Million) & Volume (Units) Trend Analysis By Market Taxonomy, 2020 to 2024
    • Market Size Value (USD Million) & Volume (Units) Forecast By Market Taxonomy, 2025 to 2035
      • By Country
        • Germany
        • UK
        • France
        • Italy
        • Spain
        • Belgium
        • Netherlands
        • Nordic
        • Switzerland
        • Russia
        • Poland
        • Rest of Europe
      • By Treatment Type
      • By Function
      • By Active Ingredient
      • By Channel
    • Market Attractiveness Analysis
      • By Country
      • By Treatment Type
      • By Function
      • By Active Ingredient
      • By Channel
    • Key Takeaways
  13. East Asia Market Analysis 2020 to 2024 and Forecast 2025 to 2035, By Country
    • Historical Market Size Value (USD Million) & Volume (Units) Trend Analysis By Market Taxonomy, 2020 to 2024
    • Market Size Value (USD Million) & Volume (Units) Forecast By Market Taxonomy, 2025 to 2035
      • By Country
        • China
        • Japan
        • South Korea
      • By Treatment Type
      • By Function
      • By Active Ingredient
      • By Channel
    • Market Attractiveness Analysis
      • By Country
      • By Treatment Type
      • By Function
      • By Active Ingredient
      • By Channel
    • Key Takeaways
  14. South Asia & Pacific Market Analysis 2020 to 2024 and Forecast 2025 to 2035, By Country
    • Historical Market Size Value (USD Million) & Volume (Units) Trend Analysis By Market Taxonomy, 2020 to 2024
    • Market Size Value (USD Million) & Volume (Units) Forecast By Market Taxonomy, 2025 to 2035
      • By Country
        • India
        • Thailand
        • Malaysia
        • Indonesia
        • Singapore
        • Vietnam
        • Australia
        • New Zealand
        • Rest of South Asia
      • By Treatment Type
      • By Function
      • By Active Ingredient
      • By Channel
    • Market Attractiveness Analysis
      • By Country
      • By Treatment Type
      • By Function
      • By Active Ingredient
      • By Channel
    • Key Takeaways
  15. Middle East and Africa Market Analysis 2020 to 2024 and Forecast 2025 to 2035, By Country
    • Historical Market Size Value (USD Million) & Volume (Units) Trend Analysis By Market Taxonomy, 2020 to 2024
    • Market Size Value (USD Million) & Volume (Units) Forecast By Market Taxonomy, 2025 to 2035
      • By Country
        • Turkey
        • UAE
        • Saudi Arabia
        • Israel
        • Other GCC Countries
        • North Africa
        • South Africa
      • By Treatment Type
      • By Function
      • By Active Ingredient
      • By Channel
    • Market Attractiveness Analysis
      • By Country
      • By Treatment Type
      • By Function
      • By Active Ingredient
      • By Channel
    • Key Takeaways
  16. Key Countries Market Analysis
    • USA
      • Pricing Analysis
      • Market Share Analysis, 2024
        • By Treatment Type
        • By Function
        • By Active Ingredient
        • By Channel
    • Canada
      • Pricing Analysis
      • Market Share Analysis, 2024
        • By Treatment Type
        • By Function
        • By Active Ingredient
        • By Channel
    • Brazil
      • Pricing Analysis
      • Market Share Analysis, 2024
        • By Treatment Type
        • By Function
        • By Active Ingredient
        • By Channel
    • Mexico
      • Pricing Analysis
      • Market Share Analysis, 2024
        • By Treatment Type
        • By Function
        • By Active Ingredient
        • By Channel
    • Colombia
      • Pricing Analysis
      • Market Share Analysis, 2024
        • By Treatment Type
        • By Function
        • By Active Ingredient
        • By Channel
    • Germany
      • Pricing Analysis
      • Market Share Analysis, 2024
        • By Treatment Type
        • By Function
        • By Active Ingredient
        • By Channel
    • UK
      • Pricing Analysis
      • Market Share Analysis, 2024
        • By Treatment Type
        • By Function
        • By Active Ingredient
        • By Channel
    • France
      • Pricing Analysis
      • Market Share Analysis, 2024
        • By Treatment Type
        • By Function
        • By Active Ingredient
        • By Channel
    • Italy
      • Pricing Analysis
      • Market Share Analysis, 2024
        • By Treatment Type
        • By Function
        • By Active Ingredient
        • By Channel
    • Spain
      • Pricing Analysis
      • Market Share Analysis, 2024
        • By Treatment Type
        • By Function
        • By Active Ingredient
        • By Channel
    • Belgium
      • Pricing Analysis
      • Market Share Analysis, 2024
        • By Treatment Type
        • By Function
        • By Active Ingredient
        • By Channel
    • Netherlands
      • Pricing Analysis
      • Market Share Analysis, 2024
        • By Treatment Type
        • By Function
        • By Active Ingredient
        • By Channel
    • Nordic
      • Pricing Analysis
      • Market Share Analysis, 2024
        • By Treatment Type
        • By Function
        • By Active Ingredient
        • By Channel
    • Switzerland
      • Pricing Analysis
      • Market Share Analysis, 2024
        • By Treatment Type
        • By Function
        • By Active Ingredient
        • By Channel
    • Russia
      • Pricing Analysis
      • Market Share Analysis, 2024
        • By Treatment Type
        • By Function
        • By Active Ingredient
        • By Channel
    • Poland
      • Pricing Analysis
      • Market Share Analysis, 2024
        • By Treatment Type
        • By Function
        • By Active Ingredient
        • By Channel
    • China
      • Pricing Analysis
      • Market Share Analysis, 2024
        • By Treatment Type
        • By Function
        • By Active Ingredient
        • By Channel
    • Japan
      • Pricing Analysis
      • Market Share Analysis, 2024
        • By Treatment Type
        • By Function
        • By Active Ingredient
        • By Channel
    • South Korea
      • Pricing Analysis
      • Market Share Analysis, 2024
        • By Treatment Type
        • By Function
        • By Active Ingredient
        • By Channel
    • India
      • Pricing Analysis
      • Market Share Analysis, 2024
        • By Treatment Type
        • By Function
        • By Active Ingredient
        • By Channel
    • Thailand
      • Pricing Analysis
      • Market Share Analysis, 2024
        • By Treatment Type
        • By Function
        • By Active Ingredient
        • By Channel
    • Indonesia
      • Pricing Analysis
      • Market Share Analysis, 2024
        • By Treatment Type
        • By Function
        • By Active Ingredient
        • By Channel
    • Australia
      • Pricing Analysis
      • Market Share Analysis, 2024
        • By Treatment Type
        • By Function
        • By Active Ingredient
        • By Channel
    • New Zealand
      • Pricing Analysis
      • Market Share Analysis, 2024
        • By Treatment Type
        • By Function
        • By Active Ingredient
        • By Channel
    • Turkey
      • Pricing Analysis
      • Market Share Analysis, 2024
        • By Treatment Type
        • By Function
        • By Active Ingredient
        • By Channel
    • UAE
      • Pricing Analysis
      • Market Share Analysis, 2024
        • By Treatment Type
        • By Function
        • By Active Ingredient
        • By Channel
    • Saudi Arabia
      • Pricing Analysis
      • Market Share Analysis, 2024
        • By Treatment Type
        • By Function
        • By Active Ingredient
        • By Channel
    • Israel
      • Pricing Analysis
      • Market Share Analysis, 2024
        • By Treatment Type
        • By Function
        • By Active Ingredient
        • By Channel
    • North Africa
      • Pricing Analysis
      • Market Share Analysis, 2024
        • By Treatment Type
        • By Function
        • By Active Ingredient
        • By Channel
    • South Africa
      • Pricing Analysis
      • Market Share Analysis, 2024
        • By Treatment Type
        • By Function
        • By Active Ingredient
        • By Channel
  17. Market Structure Analysis
    • Competition Dashboard
    • Competition Benchmarking
    • Market Share Analysis of Top Players
      • By Regional
      • By Treatment Type
      • By Function
      • By Active Ingredient
      • By Channel
  18. Competition Analysis
    • Competition Deep Dive
      • Clarins
        • Overview
        • Product Portfolio
        • Profitability by Market Segments (Product/Age /Sales Channel/Region)
        • Sales Footprint
        • Strategy Overview
          • Marketing Strategy
          • Product Strategy
          • Channel Strategy
      • Nivea
        • Overview
        • Product Portfolio
        • Profitability by Market Segments (Product/Age /Sales Channel/Region)
        • Sales Footprint
        • Strategy Overview
          • Marketing Strategy
          • Product Strategy
          • Channel Strategy
      • Weleda
        • Overview
        • Product Portfolio
        • Profitability by Market Segments (Product/Age /Sales Channel/Region)
        • Sales Footprint
        • Strategy Overview
          • Marketing Strategy
          • Product Strategy
          • Channel Strategy
      • Biotherm
        • Overview
        • Product Portfolio
        • Profitability by Market Segments (Product/Age /Sales Channel/Region)
        • Sales Footprint
        • Strategy Overview
          • Marketing Strategy
          • Product Strategy
          • Channel Strategy
      • Murad
        • Overview
        • Product Portfolio
        • Profitability by Market Segments (Product/Age /Sales Channel/Region)
        • Sales Footprint
        • Strategy Overview
          • Marketing Strategy
          • Product Strategy
          • Channel Strategy
      • Shiseido
        • Overview
        • Product Portfolio
        • Profitability by Market Segments (Product/Age /Sales Channel/Region)
        • Sales Footprint
        • Strategy Overview
          • Marketing Strategy
          • Product Strategy
          • Channel Strategy
      • Sisley Paris
        • Overview
        • Product Portfolio
        • Profitability by Market Segments (Product/Age /Sales Channel/Region)
        • Sales Footprint
        • Strategy Overview
          • Marketing Strategy
          • Product Strategy
          • Channel Strategy
      • Dermalogica
        • Overview
        • Product Portfolio
        • Profitability by Market Segments (Product/Age /Sales Channel/Region)
        • Sales Footprint
        • Strategy Overview
          • Marketing Strategy
          • Product Strategy
          • Channel Strategy
      • Mustela
        • Overview
        • Product Portfolio
        • Profitability by Market Segments (Product/Age /Sales Channel/Region)
        • Sales Footprint
        • Strategy Overview
          • Marketing Strategy
          • Product Strategy
          • Channel Strategy
      • Palmer’s
        • Overview
        • Product Portfolio
        • Profitability by Market Segments (Product/Age /Sales Channel/Region)
        • Sales Footprint
        • Strategy Overview
          • Marketing Strategy
          • Product Strategy
          • Channel Strategy
      • Others
        • Overview
        • Product Portfolio
        • Profitability by Market Segments (Product/Age /Sales Channel/Region)
        • Sales Footprint
        • Strategy Overview
          • Marketing Strategy
          • Product Strategy
          • Channel Strategy
  19. Assumptions & Acronyms Used
  20. Research Methodology

List of Tables

  • Table 1: Global Market Value (USD Million) Forecast by Region, 2020-2035
  • Table 2: Global Market Volume (Units) Forecast by Region, 2020-2035
  • Table 3: Global Market Value (USD Million) Forecast by Treatment Type, 2020-2035
  • Table 4: Global Market Volume (Units) Forecast by Treatment Type, 2020-2035
  • Table 5: Global Market Value (USD Million) Forecast by Function, 2020-2035
  • Table 6: Global Market Volume (Units) Forecast by Function, 2020-2035
  • Table 7: Global Market Value (USD Million) Forecast by Active Ingredient, 2020-2035
  • Table 8: Global Market Volume (Units) Forecast by Active Ingredient, 2020-2035
  • Table 9: Global Market Value (USD Million) Forecast by Channel, 2020-2035
  • Table 10: Global Market Volume (Units) Forecast by Channel, 2020-2035
  • Table 11: North America Market Value (USD Million) Forecast by Country, 2020-2035
  • Table 12: North America Market Volume (Units) Forecast by Country, 2020-2035
  • Table 13: North America Market Value (USD Million) Forecast by Treatment Type, 2020-2035
  • Table 14: North America Market Volume (Units) Forecast by Treatment Type, 2020-2035
  • Table 15: North America Market Value (USD Million) Forecast by Function, 2020-2035
  • Table 16: North America Market Volume (Units) Forecast by Function, 2020-2035
  • Table 17: North America Market Value (USD Million) Forecast by Active Ingredient, 2020-2035
  • Table 18: North America Market Volume (Units) Forecast by Active Ingredient, 2020-2035
  • Table 19: North America Market Value (USD Million) Forecast by Channel, 2020-2035
  • Table 20: North America Market Volume (Units) Forecast by Channel, 2020-2035
  • Table 21: Latin America Market Value (USD Million) Forecast by Country, 2020-2035
  • Table 22: Latin America Market Volume (Units) Forecast by Country, 2020-2035
  • Table 23: Latin America Market Value (USD Million) Forecast by Treatment Type, 2020-2035
  • Table 24: Latin America Market Volume (Units) Forecast by Treatment Type, 2020-2035
  • Table 25: Latin America Market Value (USD Million) Forecast by Function, 2020-2035
  • Table 26: Latin America Market Volume (Units) Forecast by Function, 2020-2035
  • Table 27: Latin America Market Value (USD Million) Forecast by Active Ingredient, 2020-2035
  • Table 28: Latin America Market Volume (Units) Forecast by Active Ingredient, 2020-2035
  • Table 29: Latin America Market Value (USD Million) Forecast by Channel, 2020-2035
  • Table 30: Latin America Market Volume (Units) Forecast by Channel, 2020-2035
  • Table 31: Europe Market Value (USD Million) Forecast by Country, 2020-2035
  • Table 32: Europe Market Volume (Units) Forecast by Country, 2020-2035
  • Table 33: Europe Market Value (USD Million) Forecast by Treatment Type, 2020-2035
  • Table 34: Europe Market Volume (Units) Forecast by Treatment Type, 2020-2035
  • Table 35: Europe Market Value (USD Million) Forecast by Function, 2020-2035
  • Table 36: Europe Market Volume (Units) Forecast by Function, 2020-2035
  • Table 37: Europe Market Value (USD Million) Forecast by Active Ingredient, 2020-2035
  • Table 38: Europe Market Volume (Units) Forecast by Active Ingredient, 2020-2035
  • Table 39: Europe Market Value (USD Million) Forecast by Channel, 2020-2035
  • Table 40: Europe Market Volume (Units) Forecast by Channel, 2020-2035
  • Table 41: East Asia Market Value (USD Million) Forecast by Country, 2020-2035
  • Table 42: East Asia Market Volume (Units) Forecast by Country, 2020-2035
  • Table 43: East Asia Market Value (USD Million) Forecast by Treatment Type, 2020-2035
  • Table 44: East Asia Market Volume (Units) Forecast by Treatment Type, 2020-2035
  • Table 45: East Asia Market Value (USD Million) Forecast by Function, 2020-2035
  • Table 46: East Asia Market Volume (Units) Forecast by Function, 2020-2035
  • Table 47: East Asia Market Value (USD Million) Forecast by Active Ingredient, 2020-2035
  • Table 48: East Asia Market Volume (Units) Forecast by Active Ingredient, 2020-2035
  • Table 49: East Asia Market Value (USD Million) Forecast by Channel, 2020-2035
  • Table 50: East Asia Market Volume (Units) Forecast by Channel, 2020-2035
  • Table 51: South Asia & Pacific Market Value (USD Million) Forecast by Country, 2020-2035
  • Table 52: South Asia & Pacific Market Volume (Units) Forecast by Country, 2020-2035
  • Table 53: South Asia & Pacific Market Value (USD Million) Forecast by Treatment Type, 2020-2035
  • Table 54: South Asia & Pacific Market Volume (Units) Forecast by Treatment Type, 2020-2035
  • Table 55: South Asia & Pacific Market Value (USD Million) Forecast by Function, 2020-2035
  • Table 56: South Asia & Pacific Market Volume (Units) Forecast by Function, 2020-2035
  • Table 57: South Asia & Pacific Market Value (USD Million) Forecast by Active Ingredient, 2020-2035
  • Table 58: South Asia & Pacific Market Volume (Units) Forecast by Active Ingredient, 2020-2035
  • Table 59: South Asia & Pacific Market Value (USD Million) Forecast by Channel, 2020-2035
  • Table 60: South Asia & Pacific Market Volume (Units) Forecast by Channel, 2020-2035
  • Table 61: Middle East and Africa Market Value (USD Million) Forecast by Country, 2020-2035
  • Table 62: Middle East and Africa Market Volume (Units) Forecast by Country, 2020-2035
  • Table 63: Middle East and Africa Market Value (USD Million) Forecast by Treatment Type, 2020-2035
  • Table 64: Middle East and Africa Market Volume (Units) Forecast by Treatment Type, 2020-2035
  • Table 65: Middle East and Africa Market Value (USD Million) Forecast by Function, 2020-2035
  • Table 66: Middle East and Africa Market Volume (Units) Forecast by Function, 2020-2035
  • Table 67: Middle East and Africa Market Value (USD Million) Forecast by Active Ingredient, 2020-2035
  • Table 68: Middle East and Africa Market Volume (Units) Forecast by Active Ingredient, 2020-2035
  • Table 69: Middle East and Africa Market Value (USD Million) Forecast by Channel, 2020-2035
  • Table 70: Middle East and Africa Market Volume (Units) Forecast by Channel, 2020-2035

List of Figures

  • Figure 1: Global Market Value (USD Million) by Treatment Type, 2025-2035
  • Figure 2: Global Market Value (USD Million) by Function, 2025-2035
  • Figure 3: Global Market Value (USD Million) by Active Ingredient, 2025-2035
  • Figure 4: Global Market Value (USD Million) by Channel, 2025-2035
  • Figure 5: Global Market Value (USD Million) by Region, 2025-2035
  • Figure 6: Global Market Value (USD Million) Analysis by Region, 2020-2035
  • Figure 7: Global Market Volume (Units) Analysis by Region, 2020-2035
  • Figure 8: Global Market Value Share (%) and BPS Analysis by Region, 2025-2035
  • Figure 9: Global Market Y-o-Y Growth (%) Projections by Region, 2025-2035
  • Figure 10: Global Market Value (USD Million) Analysis by Treatment Type, 2020-2035
  • Figure 11: Global Market Volume (Units) Analysis by Treatment Type, 2020-2035
  • Figure 12: Global Market Value Share (%) and BPS Analysis by Treatment Type, 2025-2035
  • Figure 13: Global Market Y-o-Y Growth (%) Projections by Treatment Type, 2025-2035
  • Figure 14: Global Market Value (USD Million) Analysis by Function, 2020-2035
  • Figure 15: Global Market Volume (Units) Analysis by Function, 2020-2035
  • Figure 16: Global Market Value Share (%) and BPS Analysis by Function, 2025-2035
  • Figure 17: Global Market Y-o-Y Growth (%) Projections by Function, 2025-2035
  • Figure 18: Global Market Value (USD Million) Analysis by Active Ingredient, 2020-2035
  • Figure 19: Global Market Volume (Units) Analysis by Active Ingredient, 2020-2035
  • Figure 20: Global Market Value Share (%) and BPS Analysis by Active Ingredient, 2025-2035
  • Figure 21: Global Market Y-o-Y Growth (%) Projections by Active Ingredient, 2025-2035
  • Figure 22: Global Market Value (USD Million) Analysis by Channel, 2020-2035
  • Figure 23: Global Market Volume (Units) Analysis by Channel, 2020-2035
  • Figure 24: Global Market Value Share (%) and BPS Analysis by Channel, 2025-2035
  • Figure 25: Global Market Y-o-Y Growth (%) Projections by Channel, 2025-2035
  • Figure 26: Global Market Attractiveness by Treatment Type, 2025-2035
  • Figure 27: Global Market Attractiveness by Function, 2025-2035
  • Figure 28: Global Market Attractiveness by Active Ingredient, 2025-2035
  • Figure 29: Global Market Attractiveness by Channel, 2025-2035
  • Figure 30: Global Market Attractiveness by Region, 2025-2035
  • Figure 31: North America Market Value (USD Million) by Treatment Type, 2025-2035
  • Figure 32: North America Market Value (USD Million) by Function, 2025-2035
  • Figure 33: North America Market Value (USD Million) by Active Ingredient, 2025-2035
  • Figure 34: North America Market Value (USD Million) by Channel, 2025-2035
  • Figure 35: North America Market Value (USD Million) by Country, 2025-2035
  • Figure 36: North America Market Value (USD Million) Analysis by Country, 2020-2035
  • Figure 37: North America Market Volume (Units) Analysis by Country, 2020-2035
  • Figure 38: North America Market Value Share (%) and BPS Analysis by Country, 2025-2035
  • Figure 39: North America Market Y-o-Y Growth (%) Projections by Country, 2025-2035
  • Figure 40: North America Market Value (USD Million) Analysis by Treatment Type, 2020-2035
  • Figure 41: North America Market Volume (Units) Analysis by Treatment Type, 2020-2035
  • Figure 42: North America Market Value Share (%) and BPS Analysis by Treatment Type, 2025-2035
  • Figure 43: North America Market Y-o-Y Growth (%) Projections by Treatment Type, 2025-2035
  • Figure 44: North America Market Value (USD Million) Analysis by Function, 2020-2035
  • Figure 45: North America Market Volume (Units) Analysis by Function, 2020-2035
  • Figure 46: North America Market Value Share (%) and BPS Analysis by Function, 2025-2035
  • Figure 47: North America Market Y-o-Y Growth (%) Projections by Function, 2025-2035
  • Figure 48: North America Market Value (USD Million) Analysis by Active Ingredient, 2020-2035
  • Figure 49: North America Market Volume (Units) Analysis by Active Ingredient, 2020-2035
  • Figure 50: North America Market Value Share (%) and BPS Analysis by Active Ingredient, 2025-2035
  • Figure 51: North America Market Y-o-Y Growth (%) Projections by Active Ingredient, 2025-2035
  • Figure 52: North America Market Value (USD Million) Analysis by Channel, 2020-2035
  • Figure 53: North America Market Volume (Units) Analysis by Channel, 2020-2035
  • Figure 54: North America Market Value Share (%) and BPS Analysis by Channel, 2025-2035
  • Figure 55: North America Market Y-o-Y Growth (%) Projections by Channel, 2025-2035
  • Figure 56: North America Market Attractiveness by Treatment Type, 2025-2035
  • Figure 57: North America Market Attractiveness by Function, 2025-2035
  • Figure 58: North America Market Attractiveness by Active Ingredient, 2025-2035
  • Figure 59: North America Market Attractiveness by Channel, 2025-2035
  • Figure 60: North America Market Attractiveness by Country, 2025-2035
  • Figure 61: Latin America Market Value (USD Million) by Treatment Type, 2025-2035
  • Figure 62: Latin America Market Value (USD Million) by Function, 2025-2035
  • Figure 63: Latin America Market Value (USD Million) by Active Ingredient, 2025-2035
  • Figure 64: Latin America Market Value (USD Million) by Channel, 2025-2035
  • Figure 65: Latin America Market Value (USD Million) by Country, 2025-2035
  • Figure 66: Latin America Market Value (USD Million) Analysis by Country, 2020-2035
  • Figure 67: Latin America Market Volume (Units) Analysis by Country, 2020-2035
  • Figure 68: Latin America Market Value Share (%) and BPS Analysis by Country, 2025-2035
  • Figure 69: Latin America Market Y-o-Y Growth (%) Projections by Country, 2025-2035
  • Figure 70: Latin America Market Value (USD Million) Analysis by Treatment Type, 2020-2035
  • Figure 71: Latin America Market Volume (Units) Analysis by Treatment Type, 2020-2035
  • Figure 72: Latin America Market Value Share (%) and BPS Analysis by Treatment Type, 2025-2035
  • Figure 73: Latin America Market Y-o-Y Growth (%) Projections by Treatment Type, 2025-2035
  • Figure 74: Latin America Market Value (USD Million) Analysis by Function, 2020-2035
  • Figure 75: Latin America Market Volume (Units) Analysis by Function, 2020-2035
  • Figure 76: Latin America Market Value Share (%) and BPS Analysis by Function, 2025-2035
  • Figure 77: Latin America Market Y-o-Y Growth (%) Projections by Function, 2025-2035
  • Figure 78: Latin America Market Value (USD Million) Analysis by Active Ingredient, 2020-2035
  • Figure 79: Latin America Market Volume (Units) Analysis by Active Ingredient, 2020-2035
  • Figure 80: Latin America Market Value Share (%) and BPS Analysis by Active Ingredient, 2025-2035
  • Figure 81: Latin America Market Y-o-Y Growth (%) Projections by Active Ingredient, 2025-2035
  • Figure 82: Latin America Market Value (USD Million) Analysis by Channel, 2020-2035
  • Figure 83: Latin America Market Volume (Units) Analysis by Channel, 2020-2035
  • Figure 84: Latin America Market Value Share (%) and BPS Analysis by Channel, 2025-2035
  • Figure 85: Latin America Market Y-o-Y Growth (%) Projections by Channel, 2025-2035
  • Figure 86: Latin America Market Attractiveness by Treatment Type, 2025-2035
  • Figure 87: Latin America Market Attractiveness by Function, 2025-2035
  • Figure 88: Latin America Market Attractiveness by Active Ingredient, 2025-2035
  • Figure 89: Latin America Market Attractiveness by Channel, 2025-2035
  • Figure 90: Latin America Market Attractiveness by Country, 2025-2035
  • Figure 91: Europe Market Value (USD Million) by Treatment Type, 2025-2035
  • Figure 92: Europe Market Value (USD Million) by Function, 2025-2035
  • Figure 93: Europe Market Value (USD Million) by Active Ingredient, 2025-2035
  • Figure 94: Europe Market Value (USD Million) by Channel, 2025-2035
  • Figure 95: Europe Market Value (USD Million) by Country, 2025-2035
  • Figure 96: Europe Market Value (USD Million) Analysis by Country, 2020-2035
  • Figure 97: Europe Market Volume (Units) Analysis by Country, 2020-2035
  • Figure 98: Europe Market Value Share (%) and BPS Analysis by Country, 2025-2035
  • Figure 99: Europe Market Y-o-Y Growth (%) Projections by Country, 2025-2035
  • Figure 100: Europe Market Value (USD Million) Analysis by Treatment Type, 2020-2035
  • Figure 101: Europe Market Volume (Units) Analysis by Treatment Type, 2020-2035
  • Figure 102: Europe Market Value Share (%) and BPS Analysis by Treatment Type, 2025-2035
  • Figure 103: Europe Market Y-o-Y Growth (%) Projections by Treatment Type, 2025-2035
  • Figure 104: Europe Market Value (USD Million) Analysis by Function, 2020-2035
  • Figure 105: Europe Market Volume (Units) Analysis by Function, 2020-2035
  • Figure 106: Europe Market Value Share (%) and BPS Analysis by Function, 2025-2035
  • Figure 107: Europe Market Y-o-Y Growth (%) Projections by Function, 2025-2035
  • Figure 108: Europe Market Value (USD Million) Analysis by Active Ingredient, 2020-2035
  • Figure 109: Europe Market Volume (Units) Analysis by Active Ingredient, 2020-2035
  • Figure 110: Europe Market Value Share (%) and BPS Analysis by Active Ingredient, 2025-2035
  • Figure 111: Europe Market Y-o-Y Growth (%) Projections by Active Ingredient, 2025-2035
  • Figure 112: Europe Market Value (USD Million) Analysis by Channel, 2020-2035
  • Figure 113: Europe Market Volume (Units) Analysis by Channel, 2020-2035
  • Figure 114: Europe Market Value Share (%) and BPS Analysis by Channel, 2025-2035
  • Figure 115: Europe Market Y-o-Y Growth (%) Projections by Channel, 2025-2035
  • Figure 116: Europe Market Attractiveness by Treatment Type, 2025-2035
  • Figure 117: Europe Market Attractiveness by Function, 2025-2035
  • Figure 118: Europe Market Attractiveness by Active Ingredient, 2025-2035
  • Figure 119: Europe Market Attractiveness by Channel, 2025-2035
  • Figure 120: Europe Market Attractiveness by Country, 2025-2035
  • Figure 121: East Asia Market Value (USD Million) by Treatment Type, 2025-2035
  • Figure 122: East Asia Market Value (USD Million) by Function, 2025-2035
  • Figure 123: East Asia Market Value (USD Million) by Active Ingredient, 2025-2035
  • Figure 124: East Asia Market Value (USD Million) by Channel, 2025-2035
  • Figure 125: East Asia Market Value (USD Million) by Country, 2025-2035
  • Figure 126: East Asia Market Value (USD Million) Analysis by Country, 2020-2035
  • Figure 127: East Asia Market Volume (Units) Analysis by Country, 2020-2035
  • Figure 128: East Asia Market Value Share (%) and BPS Analysis by Country, 2025-2035
  • Figure 129: East Asia Market Y-o-Y Growth (%) Projections by Country, 2025-2035
  • Figure 130: East Asia Market Value (USD Million) Analysis by Treatment Type, 2020-2035
  • Figure 131: East Asia Market Volume (Units) Analysis by Treatment Type, 2020-2035
  • Figure 132: East Asia Market Value Share (%) and BPS Analysis by Treatment Type, 2025-2035
  • Figure 133: East Asia Market Y-o-Y Growth (%) Projections by Treatment Type, 2025-2035
  • Figure 134: East Asia Market Value (USD Million) Analysis by Function, 2020-2035
  • Figure 135: East Asia Market Volume (Units) Analysis by Function, 2020-2035
  • Figure 136: East Asia Market Value Share (%) and BPS Analysis by Function, 2025-2035
  • Figure 137: East Asia Market Y-o-Y Growth (%) Projections by Function, 2025-2035
  • Figure 138: East Asia Market Value (USD Million) Analysis by Active Ingredient, 2020-2035
  • Figure 139: East Asia Market Volume (Units) Analysis by Active Ingredient, 2020-2035
  • Figure 140: East Asia Market Value Share (%) and BPS Analysis by Active Ingredient, 2025-2035
  • Figure 141: East Asia Market Y-o-Y Growth (%) Projections by Active Ingredient, 2025-2035
  • Figure 142: East Asia Market Value (USD Million) Analysis by Channel, 2020-2035
  • Figure 143: East Asia Market Volume (Units) Analysis by Channel, 2020-2035
  • Figure 144: East Asia Market Value Share (%) and BPS Analysis by Channel, 2025-2035
  • Figure 145: East Asia Market Y-o-Y Growth (%) Projections by Channel, 2025-2035
  • Figure 146: East Asia Market Attractiveness by Treatment Type, 2025-2035
  • Figure 147: East Asia Market Attractiveness by Function, 2025-2035
  • Figure 148: East Asia Market Attractiveness by Active Ingredient, 2025-2035
  • Figure 149: East Asia Market Attractiveness by Channel, 2025-2035
  • Figure 150: East Asia Market Attractiveness by Country, 2025-2035
  • Figure 151: South Asia & Pacific Market Value (USD Million) by Treatment Type, 2025-2035
  • Figure 152: South Asia & Pacific Market Value (USD Million) by Function, 2025-2035
  • Figure 153: South Asia & Pacific Market Value (USD Million) by Active Ingredient, 2025-2035
  • Figure 154: South Asia & Pacific Market Value (USD Million) by Channel, 2025-2035
  • Figure 155: South Asia & Pacific Market Value (USD Million) by Country, 2025-2035
  • Figure 156: South Asia & Pacific Market Value (USD Million) Analysis by Country, 2020-2035
  • Figure 157: South Asia & Pacific Market Volume (Units) Analysis by Country, 2020-2035
  • Figure 158: South Asia & Pacific Market Value Share (%) and BPS Analysis by Country, 2025-2035
  • Figure 159: South Asia & Pacific Market Y-o-Y Growth (%) Projections by Country, 2025-2035
  • Figure 160: South Asia & Pacific Market Value (USD Million) Analysis by Treatment Type, 2020-2035
  • Figure 161: South Asia & Pacific Market Volume (Units) Analysis by Treatment Type, 2020-2035
  • Figure 162: South Asia & Pacific Market Value Share (%) and BPS Analysis by Treatment Type, 2025-2035
  • Figure 163: South Asia & Pacific Market Y-o-Y Growth (%) Projections by Treatment Type, 2025-2035
  • Figure 164: South Asia & Pacific Market Value (USD Million) Analysis by Function, 2020-2035
  • Figure 165: South Asia & Pacific Market Volume (Units) Analysis by Function, 2020-2035
  • Figure 166: South Asia & Pacific Market Value Share (%) and BPS Analysis by Function, 2025-2035
  • Figure 167: South Asia & Pacific Market Y-o-Y Growth (%) Projections by Function, 2025-2035
  • Figure 168: South Asia & Pacific Market Value (USD Million) Analysis by Active Ingredient, 2020-2035
  • Figure 169: South Asia & Pacific Market Volume (Units) Analysis by Active Ingredient, 2020-2035
  • Figure 170: South Asia & Pacific Market Value Share (%) and BPS Analysis by Active Ingredient, 2025-2035
  • Figure 171: South Asia & Pacific Market Y-o-Y Growth (%) Projections by Active Ingredient, 2025-2035
  • Figure 172: South Asia & Pacific Market Value (USD Million) Analysis by Channel, 2020-2035
  • Figure 173: South Asia & Pacific Market Volume (Units) Analysis by Channel, 2020-2035
  • Figure 174: South Asia & Pacific Market Value Share (%) and BPS Analysis by Channel, 2025-2035
  • Figure 175: South Asia & Pacific Market Y-o-Y Growth (%) Projections by Channel, 2025-2035
  • Figure 176: South Asia & Pacific Market Attractiveness by Treatment Type, 2025-2035
  • Figure 177: South Asia & Pacific Market Attractiveness by Function, 2025-2035
  • Figure 178: South Asia & Pacific Market Attractiveness by Active Ingredient, 2025-2035
  • Figure 179: South Asia & Pacific Market Attractiveness by Channel, 2025-2035
  • Figure 180: South Asia & Pacific Market Attractiveness by Country, 2025-2035
  • Figure 181: Middle East and Africa Market Value (USD Million) by Treatment Type, 2025-2035
  • Figure 182: Middle East and Africa Market Value (USD Million) by Function, 2025-2035
  • Figure 183: Middle East and Africa Market Value (USD Million) by Active Ingredient, 2025-2035
  • Figure 184: Middle East and Africa Market Value (USD Million) by Channel, 2025-2035
  • Figure 185: Middle East and Africa Market Value (USD Million) by Country, 2025-2035
  • Figure 186: Middle East and Africa Market Value (USD Million) Analysis by Country, 2020-2035
  • Figure 187: Middle East and Africa Market Volume (Units) Analysis by Country, 2020-2035
  • Figure 188: Middle East and Africa Market Value Share (%) and BPS Analysis by Country, 2025-2035
  • Figure 189: Middle East and Africa Market Y-o-Y Growth (%) Projections by Country, 2025-2035
  • Figure 190: Middle East and Africa Market Value (USD Million) Analysis by Treatment Type, 2020-2035
  • Figure 191: Middle East and Africa Market Volume (Units) Analysis by Treatment Type, 2020-2035
  • Figure 192: Middle East and Africa Market Value Share (%) and BPS Analysis by Treatment Type, 2025-2035
  • Figure 193: Middle East and Africa Market Y-o-Y Growth (%) Projections by Treatment Type, 2025-2035
  • Figure 194: Middle East and Africa Market Value (USD Million) Analysis by Function, 2020-2035
  • Figure 195: Middle East and Africa Market Volume (Units) Analysis by Function, 2020-2035
  • Figure 196: Middle East and Africa Market Value Share (%) and BPS Analysis by Function, 2025-2035
  • Figure 197: Middle East and Africa Market Y-o-Y Growth (%) Projections by Function, 2025-2035
  • Figure 198: Middle East and Africa Market Value (USD Million) Analysis by Active Ingredient, 2020-2035
  • Figure 199: Middle East and Africa Market Volume (Units) Analysis by Active Ingredient, 2020-2035
  • Figure 200: Middle East and Africa Market Value Share (%) and BPS Analysis by Active Ingredient, 2025-2035
  • Figure 201: Middle East and Africa Market Y-o-Y Growth (%) Projections by Active Ingredient, 2025-2035
  • Figure 202: Middle East and Africa Market Value (USD Million) Analysis by Channel, 2020-2035
  • Figure 203: Middle East and Africa Market Volume (Units) Analysis by Channel, 2020-2035
  • Figure 204: Middle East and Africa Market Value Share (%) and BPS Analysis by Channel, 2025-2035
  • Figure 205: Middle East and Africa Market Y-o-Y Growth (%) Projections by Channel, 2025-2035
  • Figure 206: Middle East and Africa Market Attractiveness by Treatment Type, 2025-2035
  • Figure 207: Middle East and Africa Market Attractiveness by Function, 2025-2035
  • Figure 208: Middle East and Africa Market Attractiveness by Active Ingredient, 2025-2035
  • Figure 209: Middle East and Africa Market Attractiveness by Channel, 2025-2035
  • Figure 210: Middle East and Africa Market Attractiveness by Country, 2025-2035

Frequently Asked Questions

How big is the Cellulite Reduction Treatments Market in 2025?

The global Cellulite Reduction Treatments Market is estimated to be valued at USD 3,900.50 Million in 2025.

What will be the size of the Cellulite Reduction Treatments Market in 2035?

The market size for the Cellulite Reduction Treatments Market is projected to reach USD 9,805.40 Million by 2035.

How much will be the Cellulite Reduction Treatments Market growth between 2025 and 2035?

The Cellulite Reduction Treatments Market is expected to expand at a CAGR of 9.70% between 2025 and 2035.

What are the key treatment types in the Cellulite Reduction Treatments Market?

The key treatment types in the Cellulite Reduction Treatments Market are topical creams/gels and other formats such as oils, serums, and device-linked adjuncts.

Which treatment type will contribute significant share in the Cellulite Reduction Treatments Market in 2025?

In terms of treatment type, topical creams and gels are expected to command 54.10% share of the Cellulite Reduction Treatments Market in 2025.

Explore Similar Insights

Future Market Insights

Cellulite Reduction Treatments Market

Chat With

MaRIA

Hi There, I am MaRIA, Your Market Research Intelligence Assistant. How may I help you?