Methane Reduction Additives Market Size and Share Forecast Outlook 2025 to 2035

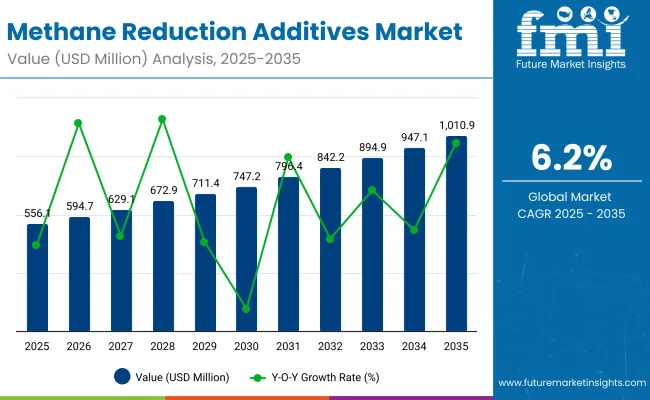
The Methane Reduction Additives Market is expected to record a valuation of USD 0.56 billion in 2025 and USD 1.01 billion in 2035, with an increase of USD 0.45 billion, which equals a growth of nearly 82% over the decade. The overall expansion represents a CAGR of 6.2% and close to a 2X increase in market size.
Quick Stats for Methane Reduction Additives Market

  • Methane Reduction Additives Market Value (2025): USD 0.56 billion
  • Methane Reduction Additives Market Forecast Value (2035): USD 1.01 billion
  • Methane Reduction Additives Market Forecast CAGR (2025 to 2035): 6.2%
  • Leading Segment in 2025: Chemical Inhibitors (55%)
  • Key Growth Regions: North America, Europe, Asia-Pacific
  • Top Key Players: DSM-Firmenich, Elanco Animal Health, CH4 Global, Symbrosia, Blue Ocean Barns, FutureFeed Pty Ltd, Volta Greentech, Mootral, Sea Forest Pty Ltd, Agolin SA

Methane Reduction Additives Market

Methane Reduction Additives Market Key Takeaways

Metric Value
Market Estimated Value in (2025E) USD 0.56 billion
Market Forecast Value in (2035F) USD 1.01 billion
Forecast CAGR (2025 to 2035) 6.2%

During the first five-year period from 2025 to 2030, the market increases from USD 0.56 billion to USD 0.75 billion, adding USD 0.19 billion, which accounts for 42% of the total decade growth. This phase records steady adoption in dairy and beef cattle production, driven by the need to reduce enteric methane emissions and improve feed efficiency. Feed additive formats such as direct TMR inclusion dominate this phase as they cater to large-scale farm systems requiring consistent dosing.

The second half from 2030 to 2035 contributes USD 0.26 billion, equal to 58% of total growth, as the market jumps from USD 0.75 billion to USD 1.01 billion. This acceleration is powered by widespread deployment of seaweed-based solutions (particularly Asparagopsis), probiotics, and microbial-based additives, along with regulatory mandates across North America and Europe. Adoption expands into sheep, goats, and other ruminants, while global sustainability programs and carbon-credit monetization further push demand. Software-enabled monitoring platforms bundled with additive use enhance traceability, strengthening adoption among large-scale integrators.

From 2020 to 2024, the Methane Reduction Additives Market scaled up gradually as early-stage trials transitioned into commercial adoption. The market expanded from pilot volumes to nearly USD 0.50 billion by 2024, primarily driven by feed additive applications in dairy cattle. During this period, competitive dynamics were led by multinational feed additive manufacturers and emerging algae-based solution developers, who jointly commanded the majority share. Differentiation was centered on scientific validation, regulatory approvals, and proven methane reduction efficacy, while distribution relied heavily on partnerships with feed integrators and cooperatives.

By 2025, the market reaches USD 0.56 billion, marking the start of a decade of scaling. The revenue mix begins shifting toward seaweed-based and microbial-based additives, alongside synthetic compounds like 3-Nitrooxypropanol (3-NOP). Looking ahead, by 2035 the industry is expected to exceed USD 1.0 billion, with growth underpinned by carbon-credit monetization, regulatory mandates in Europe and North America, and adoption in beef cattle and small ruminants. Traditional leaders such as DSM-Firmenich and Elanco are adapting by broadening into algae and microbial solutions, while startups like Symbrosia, Blue Ocean Barns, and FutureFeed accelerate commercialization. Competitive advantage is evolving from individual additive performance to ecosystem integration, traceability platforms, and scalable supply chains that ensure consistent efficacy at global scale.

Why the Methane Reduction Additives Market is Growing ?

Rising global pressure to reduce greenhouse gas emissions from the livestock sector is the primary driver of the Methane Reduction Additives Market. Advances in feed science and biotechnology have enabled the development of additives such as 3-Nitrooxypropanol (3-NOP), seaweed-based compounds, and microbial cultures that directly inhibit methane formation in the rumen. These innovations improve feed conversion efficiency while simultaneously lowering methane output, offering farmers both environmental and productivity gains. Early commercial trials have validated emission reduction rates of up to 80% with seaweed additives, significantly boosting interest and investment in scalable solutions.

The introduction of regulatory mandates and incentive mechanisms, particularly in Europe and North America, is fueling adoption. Carbon-credit programs are creating financial returns for farmers and integrators who adopt methane reduction strategies, transforming these additives from a compliance tool into a revenue opportunity. In parallel, consumer demand for sustainably produced dairy and beef products is pushing food companies to secure lower-emission supply chains, reinforcing uptake across the value chain.

Growth is further supported by diverse additive platforms. While chemical inhibitors like 3-NOP dominate current usage, algae-based, plant-based, and microbial solutions are expanding application areas across dairy cattle, beef cattle, and small ruminants. The scalability of powdered and pelletized formats, along with integration through feed manufacturers and premix suppliers, ensures compatibility with existing farm operations. As the decade progresses, the strongest growth is expected from algae-based additives, propelled by advancements in aquaculture cultivation and commercialization by startups and large ingredient players.

Segmental Analysis

The Methane Reduction Additives Market is segmented across multiple dimensions reflecting diverse technological approaches and adoption pathways. By additive type, the market includes chemical inhibitors such as 3-Nitrooxypropanol, natural bioactives like essential oils, saponins, and tannins, seaweed-based solutions including Asparagopsis and other red and brown seaweeds, as well as probiotics, microbial strains, yeast cultures, enzymes, and other emerging additives. Sources are categorized into synthetic, plant-based, algae-based, and microbial-based platforms, with synthetic dominating early adoption while algae-based and microbial solutions are gaining traction. In terms of livestock, dairy and beef cattle lead current applications, while sheep, goats, and other ruminants are gradually adopting these solutions.

Application methods span feed inclusion in TMR systems, water-soluble additives, and pasture-based supplements such as lick blocks, ensuring flexibility for various farm operations. Functionally, the additives target methane emission inhibition, rumen microbiome modulation, and feed conversion efficiency improvement. Formulations include powders, granules or pellets, and liquids to enhance compatibility with existing feed systems. Distribution occurs through direct-to-farm sales, feed manufacturers and premix suppliers, and third-party distributors, with feed integrators playing a crucial role in scaling adoption.

Regionally, the market spans North America, Europe, Asia-Pacific, Latin America, and the Middle East & Africa, with the USA, Germany, the UK, China, and India emerging as leading growth markets.
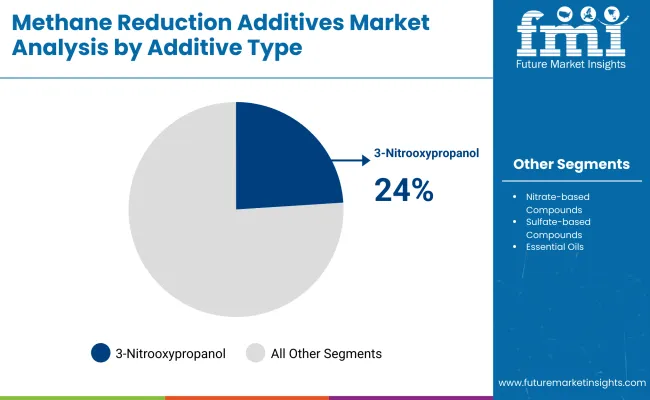
Insights into the Additive Type Segment with Chemical Inhibitors (3-Nitrooxypropanol (3-NOP))Leading in Market Share

Methane Reduction Additives Market By Additive

Additive Type Segment Market Value Share, 2025
3-Nitrooxypropanol (3-NOP) 24%
Nitrate-based Compounds 12%
Sulfate-based Compounds 5%
Essential Oils 10%
Saponins 7%
Tannins 8%
Flavonoids 3%
Asparagopsis taxiformis 9%
Other Red Seaweeds 4%
Brown Seaweeds 4%
Specific Rumen Bacteria Strains 5%
Yeast Cultures 3%
Enzyme-based Additives 2%
Fat & Oil Supplements 2%
Other Emerging Additives 2%

Chemical inhibitors, led by 3-Nitrooxypropanol (3-NOP), dominate the Methane Reduction Additives Market Share 24% in 2025, capturing more than half of the global market value. This leadership is driven by their scientifically validated efficacy, ability to integrate seamlessly into total mixed ration (TMR) systems, and proven consistency across large-scale dairy and beef operations. Farmers and feed integrators continue to prioritize chemical inhibitors due to their reliable methane suppression rates and compatibility with existing feeding practices.

Growth in this segment is also supported by ongoing R&D investments to refine formulations and reduce costs, making adoption more feasible in price-sensitive markets. As sustainability-linked financing and carbon-credit monetization expand, demand for proven and measurable reduction solutions further reinforces the dominance of chemical inhibitors. Although seaweed, microbial, and plant-based additives are emerging as competitive alternatives, the chemical inhibitor segment is expected to remain the backbone of methane reduction strategies throughout the forecast period, providing the industry with a scalable and effective pathway to lower emissions.
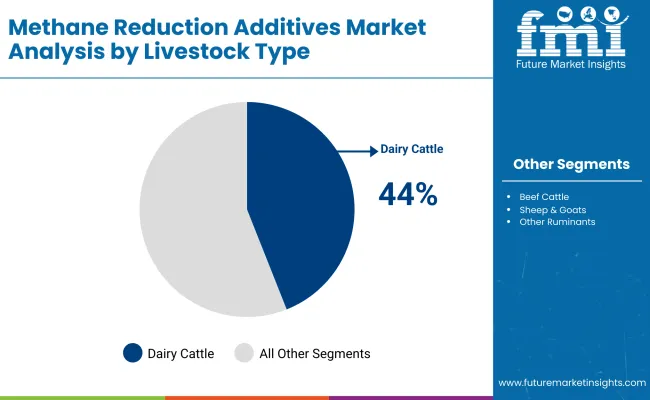
Insights into the Livestock Segment with Dairy Cattle Leading in Market Share

Methane Reduction Additives Market By Livesock

Livestock Type 2025 Share
Dairy Cattle 44%
Beef Cattle 33%
Sheep & Goats 15%
Other Ruminants 8%

The dairy cattle segment is forecasted to hold 44% of the Methane Reduction Additives Market share in 2025, led by its application in large-scale milk production systems where enteric methane emissions are highest. Adoption is driven by the dual benefits of lowering greenhouse gas output while improving feed efficiency and overall herd productivity. Dairy operations, particularly in regions such as North America and Europe, are under increasing regulatory and consumer pressure to reduce emissions, positioning additives as an essential part of sustainability strategies.

The segment’s leadership is reinforced by consistent feed delivery through TMR systems, which ensures accurate dosing and reliable performance of additives like chemical inhibitors and algae-based supplements. In addition, partnerships between dairy cooperatives, feed manufacturers, and sustainability certification programs are accelerating uptake across both developed and emerging markets. While beef cattle and small ruminants are projected to expand adoption over the decade, dairy cattle will remain the primary driver of volume demand due to their higher methane output intensity and established integration of feed additives into daily farm operations.
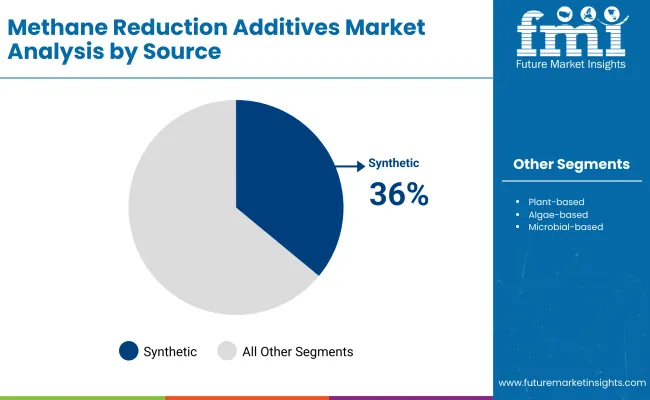
Insights into the Source Segment with Synthetic Leading in Market Share

Methane Reduction Additives Market By Source

Source Segment 2025 Share
Synthetic 36%
Plant-based 27%
Algae-based 21%
Microbial-based 16%

The synthetic source segment is forecasted to hold 36% of the Methane Reduction Additives Market share in 2025, making it the largest contributor, followed by plant-based at 27%, algae-based at 21%, and microbial-based at 16%. Synthetic additives, particularly chemical inhibitors such as 3-Nitrooxypropanol (3-NOP), lead adoption due to their strong scientific validation, clear regulatory pathways, and proven ability to consistently reduce methane emissions in dairy and beef cattle. Their scalability and integration into existing feed systems make them highly attractive for commercial farms seeking measurable and immediate results.

The dominance of synthetic solutions is also supported by large-scale production capacity and distribution networks, which ensure reliable supply across major markets such as North America and Europe. At the same time, governments and industry players are prioritizing synthetic additives for early rollout under sustainability and carbon-credit frameworks because of their validated reduction potential.

What are the Drivers, Restraints, and Key Trends of the Methane Reduction Additives Market?

Precision-Driven Sustainability Adoption and Industry Integration

The Methane Reduction Additives Market is expanding as livestock producers, feed companies, and policymakers prioritize sustainability and emission reduction. Additives such as 3-Nitrooxypropanol (3-NOP), seaweed-based compounds, and microbial solutions have demonstrated proven reductions in enteric methane emissions, making them central to climate strategies. Adoption is particularly strong in dairy and beef cattle production, where methane intensity is highest.

Integration into feed manufacturer supply chains and carbon-credit programs is streamlining adoption and creating new revenue opportunities for farmers. In addition, global food and beverage companies are partnering with suppliers to secure low-carbon dairy and meat for environmentally conscious consumers. As regulators set stricter emission targets, methane reduction additives are positioned as a scalable and science-backed pathway to meet compliance while improving herd productivity.

Cost Barriers and Supply Constraints

Despite clear benefits, adoption is limited by cost challenges and supply scalability. Many methane reduction additives, particularly seaweed-based and microbial formulations, remain expensive to produce at commercial volumes. Farmers in cost-sensitive regions find it difficult to adopt without subsidies or carbon-credit incentives. In addition, feed manufacturers face logistical and formulation challenges in ensuring consistent dosing, stability, and palatability across livestock systems.

Limited infrastructure for large-scale seaweed cultivation and fermentation-based production also constrains supply. Moreover, regulatory approval processes vary widely across regions, creating delays in commercialization and adoption. For smaller farms, the added complexity of incorporating these additives into existing routines poses further barriers, slowing widespread uptake.
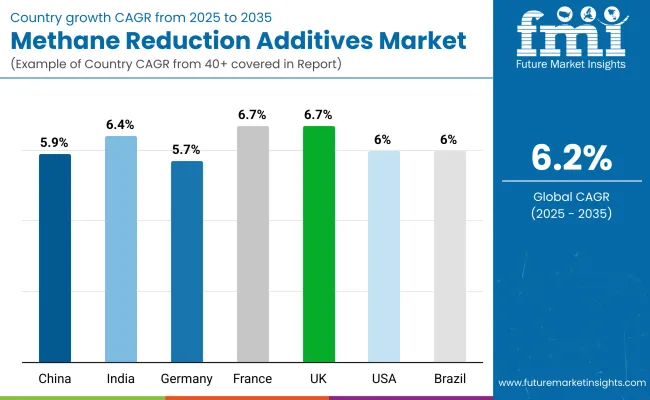
Analysis of Methane Reduction Additives Market By Key Countries

Methane Reduction Additives Market By Country

Countries CAGR
China 5.90%
India 6.48%
Germany 5.71%
France 6.79%
UK 6.78%
USA 5.36%
Brazil 6.01%

The global Methane Reduction Additives Market shows a pronounced regional disparity in adoption speed, strongly influenced by livestock intensity, sustainability regulations, and carbon-credit integration. Asia-Pacific emerges as the fastest-growing region, anchored by China at 5.9% CAGR and India at 6.5% CAGR. This acceleration is driven by the scale of dairy and beef production systems, rising investments in sustainable agriculture, and government-backed mandates to curb agricultural emissions. China’s regulatory framework promoting green livestock practices further accelerates adoption, while India’s trajectory reflects rapid integration of additives in its expanding dairy sector, supported by feed manufacturers and international sustainability programs.

Europe maintains a strong growth profile, led by Germany at 5.7%, France at 6.8%, and the UK at 6.8% CAGR, supported by stringent EU climate targets, methane reduction policies, and sustainability certification requirements in livestock supply chains. High penetration of cooperative dairy structures and government funding for climate-smart agriculture keep Europe ahead of North America, particularly in the early rollout of algae-based and microbial additives. North America shows moderate expansion, with the USA at 5.4% CAGR, reflecting maturity in feed systems and slower regulatory pressure compared to Europe.

Growth here is more market-driven, supported by carbon-credit monetization and partnerships between innovators and dairy cooperatives. Adoption is increasingly tied to sustainability branding in beef and dairy exports rather than regulatory compliance. Latin America, anchored by Brazil at 6.0% CAGR, benefits from its vast ruminant population and growing demand for low-carbon beef and dairy exports. Government-backed climate commitments and partnerships with global food companies are reinforcing adoption, positioning the region as a rising growth hub by 2035.
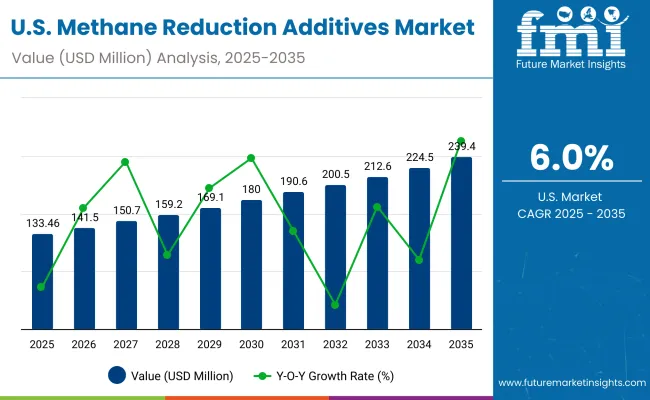
Sales Outlook for Methane Reduction Additives in the United States

Methane Reduction Additives Market Usa

Year USA Methane Reduction Additives Market (USD Million)
)2025 133.46
2026 141.5
2027 150.7
2028 159.2
2029 169.1
2030 180.0
2031 190.6
2032 200.5
2033 212.6
2034 224.5
2035 239.4

The Methane Reduction Additives Market in the United States is projected to grow at a CAGR of 5.4%, supported by adoption in dairy cooperatives and beef supply chains. Early uptake is driven by carbon-credit monetization programs and partnerships between additive developers and large-scale feed manufacturers. Regulatory pressure is lighter compared to Europe, but market-driven sustainability initiatives by food and beverage companies are accelerating trials and adoption. Dairy producers are adopting chemical inhibitors such as 3-NOP for consistent methane suppression, while startups are piloting seaweed-based additives in beef operations. Cloud-based traceability platforms are also being integrated to validate emission reductions for buyers and regulators.

  • Dairy cooperatives are trialing additives to meet sustainability branding demands.
  • Beef operations are exploring algae-based additives for scalable methane reduction.
  • Carbon-credit monetization is creating new financial incentives for adoption.

Growth and Expansion Outlook for the Methane Reduction Additives Market in the United Kingdom

The Methane Reduction Additives Market in the United Kingdom is expected to grow at a CAGR of 6.8%, backed by strong regulatory alignment with EU climate goals and sustainability certifications. Government-backed innovation programs and grants are incentivizing additive trials across dairy and beef herds. The country’s dairy sector has been an early adopter of synthetic inhibitors and is now expanding into algae-based platforms, supported by collaborations between startups and academic institutions. Retailers and food companies are also beginning to demand methane disclosure from suppliers, pushing producers to integrate additives into their supply chains.

  • Dairy farmers are adopting 3-NOP to comply with sustainability certifications.
  • Startups and research institutions are advancing seaweed cultivation for feed.
  • Retailers are pushing upstream suppliers toward low-methane certification.

Growth and Expansion Outlook for the Methane Reduction Additives Market in India

India is witnessing rapid growth in the Methane Reduction Additives Market, projected at a CAGR of 6.5% through 2035. Growth is fueled by the expansion of the country’s massive dairy sector and increasing collaborations with multinational feed suppliers. Pilot programs supported by international sustainability funds are helping small and medium farms test algae- and microbial-based additives. Educational institutions and veterinary extension programs are introducing farmers to the productivity and environmental benefits of feed interventions. Cost sensitivity remains a restraint, but falling prices and carbon-credit access are gradually improving affordability.

  • Large-scale dairy cooperatives are integrating methane additives into TMR systems.
  • Pilot projects are testing algae-based additives in regional dairy hubs.
  • Education and extension services are building awareness among smallholder farmers.

Sales Outlook for the Methane Reduction Additives Market in China

The Methane Reduction Additives Market in China is expected to grow at a CAGR of 5.9%, among the highest globally. Momentum is driven by government-backed climate action plans, rapid modernization of dairy farms, and investments in seaweed cultivation. The dairy and beef sectors are integrating synthetic additives as part of sustainability reporting, while regional governments are piloting algae-based supplements to align with emission-reduction targets. Local startups are collaborating with global innovators to scale production and lower costs, creating opportunities for mass adoption.

  • Dairy modernization programs are accelerating additive uptake.
  • Provincial pilots are testing seaweed additives for methane reduction.
  • Domestic startups are scaling affordable solutions for national distribution.

In-depth Analysis of Methane Reduction Additives in Germany

Countries 2025
UK 19.74%
Germany 21.22%
Italy 10.77%
France 13.84%
Spain 11.22%
BNELUX 6.27%
Nordic 5.22%
Rest of Europe 12%
Countries 2035
UK 19.36%
Germany 21.61%
Italy 9.72%
France 12.83%
Spain 10.44%
BNELUX 5.39%
Nordic 5.32%
Rest of Europe 15%

The Methane Reduction Additives Market in Germany is projected to grow at a CAGR of 5.7%, supported by the country’s strong commitment to climate goals and precision in agricultural practices. Dairy cooperatives and beef producers are integrating additives such as 3-Nitrooxypropanol (3-NOP) into feed systems to comply with EU methane reduction mandates. Pilot programs using seaweed-based additives are expanding, backed by government research grants and partnerships with academic institutions. Sustainability certifications tied to livestock exports are also reinforcing adoption, particularly in the premium dairy segment. Germany’s role as a leader in agricultural technology ensures early integration of additives with digital farm management and traceability systems, aligning with EU climate reporting standards.
  • Dairy cooperatives are adopting 3-NOP to meet EU methane reduction mandates.
  • Seaweed-based pilot projects are scaling with government and academic support.
  • Sustainability certifications are driving additive use in premium dairy exports.

Growth Outlook for Methane Reduction Additives Market in Japan

Methane Reduction Additives Market Japan

Source Segment 2025 Share
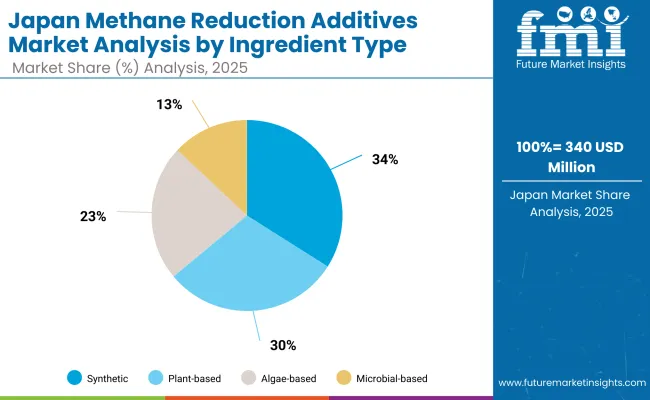
Synthetic 34%
Plant-based 30%
Algae-based 23%
Microbial-based 13%

The Methane Reduction Additives Market in Japan is projected at USD 0.34 billion in 2025, with a balanced source mix that highlights the country’s focus on sustainable agriculture. Synthetic additives contribute 34% of the market, while plant-based holds 30%, algae-based 23%, and microbial-based 13%. This distribution reflects Japan’s dual approach: leveraging proven synthetic solutions for immediate methane reduction while rapidly expanding investment into natural platforms to align with consumer preferences and environmental goals.

Japan’s dairy and beef sectors are under increasing sustainability scrutiny, with government-backed initiatives encouraging the adoption of low-carbon practices. The growing role of algae-based additives, particularly Asparagopsis, is supported by academic collaborations and innovation programs aimed at scaling aquaculture production. Similarly, plant-based solutions such as saponins and tannins are being integrated into premium livestock feed as part of clean-label strategies.
  • Japan holds 34% share from synthetic additives in 2025, followed by plant-based (30%), algae-based (23%), and microbial-based (13%).
  • Government-backed sustainability programs are driving adoption across dairy and beef operations.
  • Academic and aquaculture collaborations are accelerating algae-based additive commercialization.

Opportunity Analysis of the Methane Reduction Additives Market in South Korea

Methane Reduction Additives Market South Korea

Livestock Type Segment 2025 Share
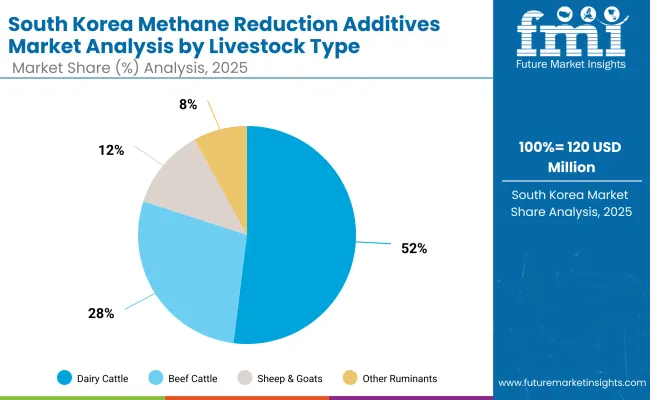
Dairy Cattle 52%
Beef Cattle 28%
Sheep & Goats 12%
Other Ruminants 8%

The Methane Reduction Additives Market in South Korea is valued at USD 0.12 billion in 2025, with the dairy cattle segment leading at 52%, followed by beef cattle at 28%, sheep & goats at 12%, and other ruminants at 8%. The dominance of dairy reflects the country’s strong focus on improving milk productivity and aligning with sustainability commitments in the livestock sector. Government incentives for emission reduction and industry-led initiatives to enhance feed efficiency are driving rapid adoption of additives, particularly synthetic inhibitors and microbial-based solutions.

This leadership is reinforced by South Korea’s highly industrialized farming systems, where precision feeding practices and cooperative structures make integration of additives easier compared to fragmented markets. Dairy producers are increasingly adopting traceability tools and carbon reporting frameworks, creating opportunities for additive suppliers to bundle solutions with sustainability verification. While beef and small ruminants remain secondary segments, their share is expected to expand as awareness grows and carbon markets reward broader adoption.
  • Market size for South Korea in 2025 is USD 0.12 billion.
  • Global market share is approximately 5%.
  • Dairy cattle lead at 52%, supported by strong policy and cooperative-driven adoption.

Competitive Landscape of the Methane Reduction Additives Market

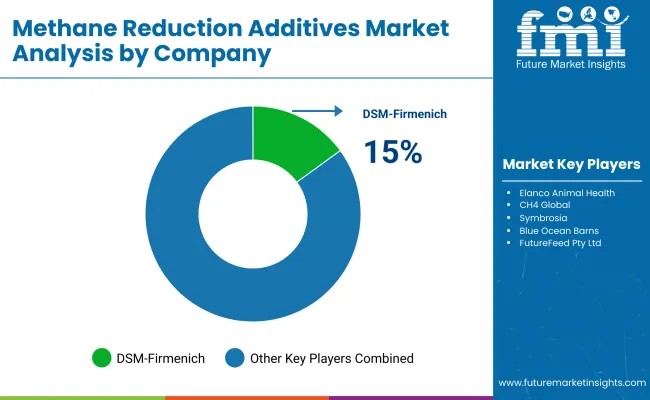
Methane Reduction Additives Market By Company

The Methane Reduction Additives Market is moderately fragmented, with established global feed and animal health leaders competing alongside innovative startups and regional specialists. Global leaders such as DSM-Firmenich and Elanco Animal Health hold significant market share, driven by their established portfolios in animal nutrition and early commercialization of methane inhibitors like 3-NOP. Their strategies emphasize scaling synthetic solutions, securing regulatory approvals, and expanding partnerships with feed manufacturers and dairy cooperatives to accelerate adoption.

Emerging mid-sized players including CH4 Global, Symbrosia, Blue Ocean Barns, FutureFeed Pty Ltd, Volta Greentech, and Sea Forest Pty Ltd are spearheading algae-based solutions, particularly Asparagopsis-based feed additives, which have demonstrated high methane reduction potential. These firms are building aquaculture capacity, partnering with dairy and beef producers, and leveraging sustainability programs to expand pilot trials into commercial-scale production.

Specialized providers such as Mootral and Agolin SA focus on plant-based and microbial solutions, catering to regions where natural and clean-label feed additives are in high demand. Their strength lies in targeted R&D, agility in product innovation, and alignment with consumer-driven sustainability preferences.

Competitive differentiation is shifting from the additive’s methane reduction efficacy alone toward ecosystem strength including supply chain scalability, carbon-credit integration, and traceability platforms. Companies that can deliver not just a product but a complete sustainability package spanning verified emission reductions, digital monitoring, and certification support are best positioned to secure long-term leadership.

Key Developments in the Methane Reduction Additives Market

  • On March 5, 2024, DSM-Firmenich and Elanco Animal Health announced a strategic collaboration to accelerate the global rollout of Bovaer® (3-NOP), expanding access across the USA and Asia. This partnership marked one of the largest scale-up initiatives for methane-reducing additives in dairy and beef cattle.
  • On September 18, 2024, CH4 Global and Blue Ocean Barns secured major funding to expand Asparagopsis seaweed cultivation in Australia and Hawaii. This development was critical for building a commercial-scale supply chain for algae-based additives.

Scope of the Report

Item Value
Quantitative Units USD 0.56 Billion
Additive Type Chemical Inhibitors (3-NOP, Nitrate & Sulfate Compounds), Seaweed & Algal Additives (Asparagopsis, Red & Brown Seaweeds), Probiotics, Specific Rumen Bacteria, Yeast Cultures, Enzyme-based, Fat & Oils, Others
Source Synthetic, Plant-based, Algae-based, Microbial-based
Livestock Type Dairy Cattle, Beef Cattle, Sheep & Goats, Other Ruminants
Application Method Feed Additive (TMR Inclusion), Water-soluble Additive, Pasture-based Supplements (Lick Blocks)
Functionality Methane Emission Inhibition, Rumen Microbiome Modulation, Feed Conversion Efficiency Improvement
Form Powder, Granules/Pellets, Liquid
Sales Channel Direct to Farms (B2B), Through Feed Manufacturers & Premix Suppliers, Distributors & Agents
Regions Covered North America, Europe, Asia-Pacific, Latin America, Middle East & Africa
Countries Covered United States, Canada, Germany, France, United Kingdom, China, Japan, India, Brazil, South Korea
Key Companies Profiled DSM- Firmenich, Elanco Animal Health, CH4 Global, Symbrosia, Blue Ocean Barns, FutureFeed Pty Ltd, Volta Greentech, Mootral, Sea Forest Pty Ltd, Agolin SA, Others
Additional Attributes Dollar sales by additive type, source, and livestock type; adoption trends in dairy and beef systems; rising demand for algae-based and microbial platforms; carbon-credit monetization; regulatory influences; innovation in aquaculture & fermentation

Key Segments

By Additive Type:

  • Chemical Inhibitors
    • 3-Nitrooxypropanol (3-NOP)
    • Nitrate-based Compounds
    • Sulfate-based Compounds
  • Natural Bioactives
    • Essential Oils (e.g., Garlic Oil, Oregano Oil)
    • Saponins
    • Tannins
    • Flavonoids
  • Seaweed & Algal Additives
    • Asparagopsis taxiformis
    • Other Red Seaweeds
    • Brown Seaweeds
  • Probiotics & Direct-fed Microbials
    • Specific Rumen Bacteria Strains
    • Yeast Cultures
  • Enzyme-based Additives
  • Fat & Oil Supplements
  • Other Emerging Additives

By Source:

  • Synthetic
  • Plant-based
  • Algae-based
  • Microbial-based

By Livestock Type:

  • Dairy Cattle
  • Beef Cattle
  • Sheep & Goats
  • Other Ruminants

By Application Method:

  • Feed Additive (TMR Inclusion)
  • Water-soluble Additive
  • Pasture-based Supplement / Lick Blocks

By Functionality:

  • Methane Emission Inhibition
  • Rumen Microbiome Modulation
  • Feed Conversion Efficiency Improvement

By Form:

  • Powder
  • Granules / Pellets
  • Liquid

By Sales Channel:

  • Direct to Farms (B2B)
  • Through Feed Manufacturers / Premix Suppliers
  • Distributors & Agents

By Region:

  • North America
  • Latin America
  • Europe
  • East Asia
  • South Asia & Pacific
  • Middle East and Africa

Table of Content

  1. Executive Summary
    • Global Market Outlook
    • Demand-side Trends
    • Supply-side Trends
    • Technology Roadmap Analysis
    • Analysis and Recommendations
  2. Market Overview
    • Market Coverage / Taxonomy
    • Market Definition / Scope / Limitations
  3. Market Background
    • Market Dynamics
      • Drivers
      • Restraints
      • Opportunity
      • Trends
    • Scenario Forecast
      • Demand in Optimistic Scenario
      • Demand in Likely Scenario
      • Demand in Conservative Scenario
    • Opportunity Map Analysis
    • Product Life Cycle Analysis
    • Supply Chain Analysis
    • Investment Feasibility Matrix
    • Value Chain Analysis
    • PESTLE and Porter’s Analysis
    • Regulatory Landscape
    • Regional Parent Market Outlook
    • Production and Consumption Statistics
    • Import and Export Statistics
  4. Global Market Analysis 2020 to 2024 and Forecast, 2025 to 2035
    • Historical Market Size Value (USD Million) Analysis, 2020 to 2024
    • Current and Future Market Size Value (USD Million) Projections, 2025 to 2035
      • Y-o-Y Growth Trend Analysis
      • Absolute $ Opportunity Analysis
  5. Global Market Pricing Analysis 2020 to 2024 and Forecast 2025 to 2035
  6. Global Market Analysis 2020 to 2024 and Forecast 2025 to 2035, By Additive Type
    • Introduction / Key Findings
    • Historical Market Size Value (USD Million) Analysis By Additive Type, 2020 to 2024
    • Current and Future Market Size Value (USD Million) Analysis and Forecast By Additive Type, 2025 to 2035
      • Chemical Inhibitors
        • 3-Nitrooxypropanol (3-NOP)
        • Nitrate-based Compounds
        • Sulfate-based Compounds
      • Natural Bioactives
        • Essential Oils (e.g., Garlic Oil, Oregano Oil)
        • Saponins
        • Tannins
        • Flavonoids
      • Seaweed & Algal Additives
        • Asparagopsis taxiformis
        • Other Red Seaweeds
        • Brown Seaweeds
      • Probiotics & Direct-fed Microbials
        • Specific Rumen Bacteria Strains
        • Yeast Cultures
      • Enzyme-based Additives
      • Fat & Oil Supplements
      • Other Emerging Additives
    • Y-o-Y Growth Trend Analysis By Additive Type, 2020 to 2024
    • Absolute $ Opportunity Analysis By Additive Type, 2025 to 2035
  7. Global Market Analysis 2020 to 2024 and Forecast 2025 to 2035, By Source
    • Introduction / Key Findings
    • Historical Market Size Value (USD Million) Analysis By Source, 2020 to 2024
    • Current and Future Market Size Value (USD Million) Analysis and Forecast By Source, 2025 to 2035
      • Synthetic
      • Plant-based
      • Algae-based
      • Microbial-based
    • Y-o-Y Growth Trend Analysis By Source, 2020 to 2024
    • Absolute $ Opportunity Analysis By Source, 2025 to 2035
  8. Global Market Analysis 2020 to 2024 and Forecast 2025 to 2035, By Livestock Type
    • Introduction / Key Findings
    • Historical Market Size Value (USD Million) Analysis By Livestock Type, 2020 to 2024
    • Current and Future Market Size Value (USD Million) Analysis and Forecast By Livestock Type, 2025 to 2035
      • Dairy Cattle
      • Beef Cattle
      • Sheep & Goats
      • Other Ruminants
    • Y-o-Y Growth Trend Analysis By Livestock Type, 2020 to 2024
    • Absolute $ Opportunity Analysis By Livestock Type, 2025 to 2035
  9. Global Market Analysis 2020 to 2024 and Forecast 2025 to 2035, By Application Method
    • Introduction / Key Findings
    • Historical Market Size Value (USD Million) Analysis By Application Method, 2020 to 2024
    • Current and Future Market Size Value (USD Million) Analysis and Forecast By Application Method, 2025 to 2035
      • Feed Additive (TMR Inclusion)
      • Water-soluble Additive
      • Pasture-based Supplement / Lick Blocks
    • Y-o-Y Growth Trend Analysis By Application Method, 2020 to 2024
    • Absolute $ Opportunity Analysis By Application Method, 2025 to 2035
  10. Global Market Analysis 2020 to 2024 and Forecast 2025 to 2035, By Functionality
    • Introduction / Key Findings
    • Historical Market Size Value (USD Million) Analysis By Functionality, 2020 to 2024
    • Current and Future Market Size Value (USD Million) Analysis and Forecast By Functionality, 2025 to 2035
      • Methane Emission Inhibition
      • Rumen Microbiome Modulation
      • Feed Conversion Efficiency Improvement
    • Y-o-Y Growth Trend Analysis By Functionality, 2020 to 2024
    • Absolute $ Opportunity Analysis By Functionality, 2025 to 2035
  11. Global Market Analysis 2020 to 2024 and Forecast 2025 to 2035, By Form
    • Introduction / Key Findings
    • Historical Market Size Value (USD Million) Analysis By Form, 2020 to 2024
    • Current and Future Market Size Value (USD Million) Analysis and Forecast By Form, 2025 to 2035
      • Powder
      • Granules / Pellets
      • Liquid
    • Y-o-Y Growth Trend Analysis By Form, 2020 to 2024
    • Absolute $ Opportunity Analysis By Form, 2025 to 2035
  12. Global Market Analysis 2020 to 2024 and Forecast 2025 to 2035, By Sales Channel
    • Introduction / Key Findings
    • Historical Market Size Value (USD Million) Analysis By Sales Channel, 2020 to 2024
    • Current and Future Market Size Value (USD Million) Analysis and Forecast By Sales Channel, 2025 to 2035
      • Direct to Farms (B2B)
      • Through Feed Manufacturers / Premix Suppliers
      • Distributors & Agents
    • Y-o-Y Growth Trend Analysis By Sales Channel, 2020 to 2024
    • Absolute $ Opportunity Analysis By Sales Channel, 2025 to 2035
  13. Global Market Analysis 2020 to 2024 and Forecast 2025 to 2035, By Region
    • Introduction
    • Historical Market Size Value (USD Million) Analysis By Region, 2020 to 2024
    • Current Market Size Value (USD Million) Analysis and Forecast By Region, 2025 to 2035
      • North America
      • Latin America
      • Europe
      • East Asia
      • South Asia & Pacific
      • Middle East and Africa
    • Market Attractiveness Analysis By Region
  14. North America Market Analysis 2020 to 2024 and Forecast 2025 to 2035, By Country
    • Historical Market Size Value (USD Million) Trend Analysis By Market Taxonomy, 2020 to 2024
    • Market Size Value (USD Million) Forecast By Market Taxonomy, 2025 to 2035
      • By Country
        • USA
        • Canada
      • By Additive Type
      • By Source
      • By Livestock Type
      • By Application Method
      • By Functionality
      • By Form
      • By Sales Channel
    • Market Attractiveness Analysis
      • By Country
      • By Additive Type
      • By Source
      • By Livestock Type
      • By Application Method
      • By Functionality
      • By Form
      • By Sales Channel
    • Key Takeaways
  15. Latin America Market Analysis 2020 to 2024 and Forecast 2025 to 2035, By Country
    • Historical Market Size Value (USD Million) Trend Analysis By Market Taxonomy, 2020 to 2024
    • Market Size Value (USD Million) Forecast By Market Taxonomy, 2025 to 2035
      • By Country
        • Brazil
        • Mexico
        • Colombia
        • Rest of Latin America
      • By Additive Type
      • By Source
      • By Livestock Type
      • By Application Method
      • By Functionality
      • By Form
      • By Sales Channel
    • Market Attractiveness Analysis
      • By Country
      • By Additive Type
      • By Source
      • By Livestock Type
      • By Application Method
      • By Functionality
      • By Form
      • By Sales Channel
    • Key Takeaways
  16. Europe Market Analysis 2020 to 2024 and Forecast 2025 to 2035, By Country
    • Historical Market Size Value (USD Million) Trend Analysis By Market Taxonomy, 2020 to 2024
    • Market Size Value (USD Million) Forecast By Market Taxonomy, 2025 to 2035
      • By Country
        • Germany
        • UK
        • France
        • Italy
        • Spain
        • Belgium
        • Netherlands
        • Nordic
        • Switzerland
        • Russia
        • Poland
        • Rest of Europe
      • By Additive Type
      • By Source
      • By Livestock Type
      • By Application Method
      • By Functionality
      • By Form
      • By Sales Channel
    • Market Attractiveness Analysis
      • By Country
      • By Additive Type
      • By Source
      • By Livestock Type
      • By Application Method
      • By Functionality
      • By Form
      • By Sales Channel
    • Key Takeaways
  17. East Asia Market Analysis 2020 to 2024 and Forecast 2025 to 2035, By Country
    • Historical Market Size Value (USD Million) Trend Analysis By Market Taxonomy, 2020 to 2024
    • Market Size Value (USD Million) Forecast By Market Taxonomy, 2025 to 2035
      • By Country
        • China
        • Japan
        • South Korea
      • By Additive Type
      • By Source
      • By Livestock Type
      • By Application Method
      • By Functionality
      • By Form
      • By Sales Channel
    • Market Attractiveness Analysis
      • By Country
      • By Additive Type
      • By Source
      • By Livestock Type
      • By Application Method
      • By Functionality
      • By Form
      • By Sales Channel
    • Key Takeaways
  18. South Asia & Pacific Market Analysis 2020 to 2024 and Forecast 2025 to 2035, By Country
    • Historical Market Size Value (USD Million) Trend Analysis By Market Taxonomy, 2020 to 2024
    • Market Size Value (USD Million) Forecast By Market Taxonomy, 2025 to 2035
      • By Country
        • India
        • Thailand
        • Malaysia
        • Indonesia
        • Singapore
        • Vietnam
        • Australia
        • New Zealand
        • Rest of South Asia
      • By Additive Type
      • By Source
      • By Livestock Type
      • By Application Method
      • By Functionality
      • By Form
      • By Sales Channel
    • Market Attractiveness Analysis
      • By Country
      • By Additive Type
      • By Source
      • By Livestock Type
      • By Application Method
      • By Functionality
      • By Form
      • By Sales Channel
    • Key Takeaways
  19. Middle East and Africa Market Analysis 2020 to 2024 and Forecast 2025 to 2035, By Country
    • Historical Market Size Value (USD Million) Trend Analysis By Market Taxonomy, 2020 to 2024
    • Market Size Value (USD Million) Forecast By Market Taxonomy, 2025 to 2035
      • By Country
        • Turkey
        • UAE
        • Saudi Arabia
        • Israel
        • Other GCC Countries
        • North Africa
        • South Africa
      • By Additive Type
      • By Source
      • By Livestock Type
      • By Application Method
      • By Functionality
      • By Form
      • By Sales Channel
    • Market Attractiveness Analysis
      • By Country
      • By Additive Type
      • By Source
      • By Livestock Type
      • By Application Method
      • By Functionality
      • By Form
      • By Sales Channel
    • Key Takeaways
  20. Key Countries Market Analysis
    • USA
      • Pricing Analysis
      • Market Share Analysis, 2024
        • By Additive Type
        • By Source
        • By Livestock Type
        • By Application Method
        • By Functionality
        • By Form
        • By Sales Channel
    • Canada
      • Pricing Analysis
      • Market Share Analysis, 2024
        • By Additive Type
        • By Source
        • By Livestock Type
        • By Application Method
        • By Functionality
        • By Form
        • By Sales Channel
    • Brazil
      • Pricing Analysis
      • Market Share Analysis, 2024
        • By Additive Type
        • By Source
        • By Livestock Type
        • By Application Method
        • By Functionality
        • By Form
        • By Sales Channel
    • Mexico
      • Pricing Analysis
      • Market Share Analysis, 2024
        • By Additive Type
        • By Source
        • By Livestock Type
        • By Application Method
        • By Functionality
        • By Form
        • By Sales Channel
    • Colombia
      • Pricing Analysis
      • Market Share Analysis, 2024
        • By Additive Type
        • By Source
        • By Livestock Type
        • By Application Method
        • By Functionality
        • By Form
        • By Sales Channel
    • Rest of Latin America
      • Pricing Analysis
      • Market Share Analysis, 2024
        • By Additive Type
        • By Source
        • By Livestock Type
        • By Application Method
        • By Functionality
        • By Form
        • By Sales Channel
    • Germany
      • Pricing Analysis
      • Market Share Analysis, 2024
        • By Additive Type
        • By Source
        • By Livestock Type
        • By Application Method
        • By Functionality
        • By Form
        • By Sales Channel
    • UK
      • Pricing Analysis
      • Market Share Analysis, 2024
        • By Additive Type
        • By Source
        • By Livestock Type
        • By Application Method
        • By Functionality
        • By Form
        • By Sales Channel
    • France
      • Pricing Analysis
      • Market Share Analysis, 2024
        • By Additive Type
        • By Source
        • By Livestock Type
        • By Application Method
        • By Functionality
        • By Form
        • By Sales Channel
    • Italy
      • Pricing Analysis
      • Market Share Analysis, 2024
        • By Additive Type
        • By Source
        • By Livestock Type
        • By Application Method
        • By Functionality
        • By Form
        • By Sales Channel
    • Spain
      • Pricing Analysis
      • Market Share Analysis, 2024
        • By Additive Type
        • By Source
        • By Livestock Type
        • By Application Method
        • By Functionality
        • By Form
        • By Sales Channel
    • Belgium
      • Pricing Analysis
      • Market Share Analysis, 2024
        • By Additive Type
        • By Source
        • By Livestock Type
        • By Application Method
        • By Functionality
        • By Form
        • By Sales Channel
    • Netherlands
      • Pricing Analysis
      • Market Share Analysis, 2024
        • By Additive Type
        • By Source
        • By Livestock Type
        • By Application Method
        • By Functionality
        • By Form
        • By Sales Channel
    • Nordic
      • Pricing Analysis
      • Market Share Analysis, 2024
        • By Additive Type
        • By Source
        • By Livestock Type
        • By Application Method
        • By Functionality
        • By Form
        • By Sales Channel
    • Switzerland
      • Pricing Analysis
      • Market Share Analysis, 2024
        • By Additive Type
        • By Source
        • By Livestock Type
        • By Application Method
        • By Functionality
        • By Form
        • By Sales Channel
    • Russia
      • Pricing Analysis
      • Market Share Analysis, 2024
        • By Additive Type
        • By Source
        • By Livestock Type
        • By Application Method
        • By Functionality
        • By Form
        • By Sales Channel
    • Poland
      • Pricing Analysis
      • Market Share Analysis, 2024
        • By Additive Type
        • By Source
        • By Livestock Type
        • By Application Method
        • By Functionality
        • By Form
        • By Sales Channel
    • Rest of Europe
      • Pricing Analysis
      • Market Share Analysis, 2024
        • By Additive Type
        • By Source
        • By Livestock Type
        • By Application Method
        • By Functionality
        • By Form
        • By Sales Channel
    • China
      • Pricing Analysis
      • Market Share Analysis, 2024
        • By Additive Type
        • By Source
        • By Livestock Type
        • By Application Method
        • By Functionality
        • By Form
        • By Sales Channel
    • Japan
      • Pricing Analysis
      • Market Share Analysis, 2024
        • By Additive Type
        • By Source
        • By Livestock Type
        • By Application Method
        • By Functionality
        • By Form
        • By Sales Channel
    • South Korea
      • Pricing Analysis
      • Market Share Analysis, 2024
        • By Additive Type
        • By Source
        • By Livestock Type
        • By Application Method
        • By Functionality
        • By Form
        • By Sales Channel
    • India
      • Pricing Analysis
      • Market Share Analysis, 2024
        • By Additive Type
        • By Source
        • By Livestock Type
        • By Application Method
        • By Functionality
        • By Form
        • By Sales Channel
    • Thailand
      • Pricing Analysis
      • Market Share Analysis, 2024
        • By Additive Type
        • By Source
        • By Livestock Type
        • By Application Method
        • By Functionality
        • By Form
        • By Sales Channel
    • Malaysia
      • Pricing Analysis
      • Market Share Analysis, 2024
        • By Additive Type
        • By Source
        • By Livestock Type
        • By Application Method
        • By Functionality
        • By Form
        • By Sales Channel
    • Indonesia
      • Pricing Analysis
      • Market Share Analysis, 2024
        • By Additive Type
        • By Source
        • By Livestock Type
        • By Application Method
        • By Functionality
        • By Form
        • By Sales Channel
    • Singapore
      • Pricing Analysis
      • Market Share Analysis, 2024
        • By Additive Type
        • By Source
        • By Livestock Type
        • By Application Method
        • By Functionality
        • By Form
        • By Sales Channel
    • Vietnam
      • Pricing Analysis
      • Market Share Analysis, 2024
        • By Additive Type
        • By Source
        • By Livestock Type
        • By Application Method
        • By Functionality
        • By Form
        • By Sales Channel
    • Australia
      • Pricing Analysis
      • Market Share Analysis, 2024
        • By Additive Type
        • By Source
        • By Livestock Type
        • By Application Method
        • By Functionality
        • By Form
        • By Sales Channel
    • New Zealand
      • Pricing Analysis
      • Market Share Analysis, 2024
        • By Additive Type
        • By Source
        • By Livestock Type
        • By Application Method
        • By Functionality
        • By Form
        • By Sales Channel
    • Rest of South Asia
      • Pricing Analysis
      • Market Share Analysis, 2024
        • By Additive Type
        • By Source
        • By Livestock Type
        • By Application Method
        • By Functionality
        • By Form
        • By Sales Channel
  21. Market Structure Analysis
    • Competition Dashboard
    • Competition Benchmarking
    • Market Share Analysis of Top Players
      • By Regional
      • By Additive Type
      • By Source
      • By Livestock Type
      • By Application Method
      • By Functionality
      • By Form
      • By Sales Channel
  22. Competition Analysis
    • Competition Deep Dive
      • DSM-Firmenich
        • Overview
        • Product Portfolio
        • Profitability by Market Segments (Product/Age /Sales Channel/Region)
        • Sales Footprint
        • Strategy Overview
        • Elanco Animal Health
        • CH4 Global
        • Symbrosia
        • Blue Ocean Barns
        • FutureFeed Pty Ltd
        • Volta Greentech
        • Mootral
        • Sea Forest Pty Ltd
        • Agolin SA
        • Others
    • Assumptions & Acronyms Used
    • Research Methodology

List of Tables

  • Table 1: Global Market Value (USD Million) Forecast by Region, 2020-2035
  • Table 2: Global Market Value (USD Million) Forecast by Additive Type, 2020-2035
  • Table 3: Global Market Value (USD Million) Forecast by Source, 2020-2035
  • Table 4: Global Market Value (USD Million) Forecast by Livestock Type, 2020-2035
  • Table 5: Global Market Value (USD Million) Forecast by Application Method, 2020-2035
  • Table 6: Global Market Value (USD Million) Forecast by Functionality, 2020-2035
  • Table 7: Global Market Value (USD Million) Forecast by Form, 2020-2035
  • Table 8: Global Market Value (USD Million) Forecast by Sales Channel, 2020-2035
  • Table 9: North America Market Value (USD Million) Forecast by Country, 2020-2035
  • Table 10: North America Market Value (USD Million) Forecast by Additive Type, 2020-2035
  • Table 11: North America Market Value (USD Million) Forecast by Source, 2020-2035
  • Table 12: North America Market Value (USD Million) Forecast by Livestock Type, 2020-2035
  • Table 13: North America Market Value (USD Million) Forecast by Application Method, 2020-2035
  • Table 14: North America Market Value (USD Million) Forecast by Functionality, 2020-2035
  • Table 15: North America Market Value (USD Million) Forecast by Form, 2020-2035
  • Table 16: North America Market Value (USD Million) Forecast by Sales Channel, 2020-2035
  • Table 17: Latin America Market Value (USD Million) Forecast by Country, 2020-2035
  • Table 18: Latin America Market Value (USD Million) Forecast by Additive Type, 2020-2035
  • Table 19: Latin America Market Value (USD Million) Forecast by Source, 2020-2035
  • Table 20: Latin America Market Value (USD Million) Forecast by Livestock Type, 2020-2035
  • Table 21: Latin America Market Value (USD Million) Forecast by Application Method, 2020-2035
  • Table 22: Latin America Market Value (USD Million) Forecast by Functionality, 2020-2035
  • Table 23: Latin America Market Value (USD Million) Forecast by Form, 2020-2035
  • Table 24: Latin America Market Value (USD Million) Forecast by Sales Channel, 2020-2035
  • Table 25: Europe Market Value (USD Million) Forecast by Country, 2020-2035
  • Table 26: Europe Market Value (USD Million) Forecast by Additive Type, 2020-2035
  • Table 27: Europe Market Value (USD Million) Forecast by Source, 2020-2035
  • Table 28: Europe Market Value (USD Million) Forecast by Livestock Type, 2020-2035
  • Table 29: Europe Market Value (USD Million) Forecast by Application Method, 2020-2035
  • Table 30: Europe Market Value (USD Million) Forecast by Functionality, 2020-2035
  • Table 31: Europe Market Value (USD Million) Forecast by Form, 2020-2035
  • Table 32: Europe Market Value (USD Million) Forecast by Sales Channel, 2020-2035
  • Table 33: East Asia Market Value (USD Million) Forecast by Country, 2020-2035
  • Table 34: East Asia Market Value (USD Million) Forecast by Additive Type, 2020-2035
  • Table 35: East Asia Market Value (USD Million) Forecast by Source, 2020-2035
  • Table 36: East Asia Market Value (USD Million) Forecast by Livestock Type, 2020-2035
  • Table 37: East Asia Market Value (USD Million) Forecast by Application Method, 2020-2035
  • Table 38: East Asia Market Value (USD Million) Forecast by Functionality, 2020-2035
  • Table 39: East Asia Market Value (USD Million) Forecast by Form, 2020-2035
  • Table 40: East Asia Market Value (USD Million) Forecast by Sales Channel, 2020-2035
  • Table 41: South Asia & Pacific Market Value (USD Million) Forecast by Country, 2020-2035
  • Table 42: South Asia & Pacific Market Value (USD Million) Forecast by Additive Type, 2020-2035
  • Table 43: South Asia & Pacific Market Value (USD Million) Forecast by Source, 2020-2035
  • Table 44: South Asia & Pacific Market Value (USD Million) Forecast by Livestock Type, 2020-2035
  • Table 45: South Asia & Pacific Market Value (USD Million) Forecast by Application Method, 2020-2035
  • Table 46: South Asia & Pacific Market Value (USD Million) Forecast by Functionality, 2020-2035
  • Table 47: South Asia & Pacific Market Value (USD Million) Forecast by Form, 2020-2035
  • Table 48: South Asia & Pacific Market Value (USD Million) Forecast by Sales Channel, 2020-2035
  • Table 49: Middle East and Africa Market Value (USD Million) Forecast by Country, 2020-2035
  • Table 50: Middle East and Africa Market Value (USD Million) Forecast by Additive Type, 2020-2035
  • Table 51: Middle East and Africa Market Value (USD Million) Forecast by Source, 2020-2035
  • Table 52: Middle East and Africa Market Value (USD Million) Forecast by Livestock Type, 2020-2035
  • Table 53: Middle East and Africa Market Value (USD Million) Forecast by Application Method, 2020-2035
  • Table 54: Middle East and Africa Market Value (USD Million) Forecast by Functionality, 2020-2035
  • Table 55: Middle East and Africa Market Value (USD Million) Forecast by Form, 2020-2035
  • Table 56: Middle East and Africa Market Value (USD Million) Forecast by Sales Channel, 2020-2035

List of Figures

  • Figure 1: Global Market Pricing Analysis
  • Figure 2: Global Market Value (USD Million) Forecast 2020-2035
  • Figure 3: Global Market Value Share and BPS Analysis by Additive Type, 2025 and 2035
  • Figure 4: Global Market Y-o-Y Growth Comparison by Additive Type, 2025-2035
  • Figure 5: Global Market Attractiveness Analysis by Additive Type
  • Figure 6: Global Market Value Share and BPS Analysis by Source, 2025 and 2035
  • Figure 7: Global Market Y-o-Y Growth Comparison by Source, 2025-2035
  • Figure 8: Global Market Attractiveness Analysis by Source
  • Figure 9: Global Market Value Share and BPS Analysis by Livestock Type, 2025 and 2035
  • Figure 10: Global Market Y-o-Y Growth Comparison by Livestock Type, 2025-2035
  • Figure 11: Global Market Attractiveness Analysis by Livestock Type
  • Figure 12: Global Market Value Share and BPS Analysis by Application Method, 2025 and 2035
  • Figure 13: Global Market Y-o-Y Growth Comparison by Application Method, 2025-2035
  • Figure 14: Global Market Attractiveness Analysis by Application Method
  • Figure 15: Global Market Value Share and BPS Analysis by Functionality, 2025 and 2035
  • Figure 16: Global Market Y-o-Y Growth Comparison by Functionality, 2025-2035
  • Figure 17: Global Market Attractiveness Analysis by Functionality
  • Figure 18: Global Market Value Share and BPS Analysis by Form, 2025 and 2035
  • Figure 19: Global Market Y-o-Y Growth Comparison by Form, 2025-2035
  • Figure 20: Global Market Attractiveness Analysis by Form
  • Figure 21: Global Market Value Share and BPS Analysis by Sales Channel, 2025 and 2035
  • Figure 22: Global Market Y-o-Y Growth Comparison by Sales Channel, 2025-2035
  • Figure 23: Global Market Attractiveness Analysis by Sales Channel
  • Figure 24: Global Market Value (USD Million) Share and BPS Analysis by Region, 2025 and 2035
  • Figure 25: Global Market Y-o-Y Growth Comparison by Region, 2025-2035
  • Figure 26: Global Market Attractiveness Analysis by Region
  • Figure 27: North America Market Incremental $ Opportunity, 2025-2035
  • Figure 28: Latin America Market Incremental $ Opportunity, 2025-2035
  • Figure 29: Europe Market Incremental $ Opportunity, 2025-2035
  • Figure 30: East Asia Market Incremental $ Opportunity, 2025-2035
  • Figure 31: South Asia & Pacific Market Incremental $ Opportunity, 2025-2035
  • Figure 32: Middle East and Africa Market Incremental $ Opportunity, 2025-2035
  • Figure 33: North America Market Value Share and BPS Analysis by Country, 2025 and 2035
  • Figure 34: North America Market Value Share and BPS Analysis by Additive Type, 2025 and 2035
  • Figure 35: North America Market Y-o-Y Growth Comparison by Additive Type, 2025-2035
  • Figure 36: North America Market Attractiveness Analysis by Additive Type
  • Figure 37: North America Market Value Share and BPS Analysis by Source, 2025 and 2035
  • Figure 38: North America Market Y-o-Y Growth Comparison by Source, 2025-2035
  • Figure 39: North America Market Attractiveness Analysis by Source
  • Figure 40: North America Market Value Share and BPS Analysis by Livestock Type, 2025 and 2035
  • Figure 41: North America Market Y-o-Y Growth Comparison by Livestock Type, 2025-2035
  • Figure 42: North America Market Attractiveness Analysis by Livestock Type
  • Figure 43: North America Market Value Share and BPS Analysis by Application Method, 2025 and 2035
  • Figure 44: North America Market Y-o-Y Growth Comparison by Application Method, 2025-2035
  • Figure 45: North America Market Attractiveness Analysis by Application Method
  • Figure 46: North America Market Value Share and BPS Analysis by Functionality, 2025 and 2035
  • Figure 47: North America Market Y-o-Y Growth Comparison by Functionality, 2025-2035
  • Figure 48: North America Market Attractiveness Analysis by Functionality
  • Figure 49: North America Market Value Share and BPS Analysis by Form, 2025 and 2035
  • Figure 50: North America Market Y-o-Y Growth Comparison by Form, 2025-2035
  • Figure 51: North America Market Attractiveness Analysis by Form
  • Figure 52: North America Market Value Share and BPS Analysis by Sales Channel, 2025 and 2035
  • Figure 53: North America Market Y-o-Y Growth Comparison by Sales Channel, 2025-2035
  • Figure 54: North America Market Attractiveness Analysis by Sales Channel
  • Figure 55: Latin America Market Value Share and BPS Analysis by Country, 2025 and 2035
  • Figure 56: Latin America Market Value Share and BPS Analysis by Additive Type, 2025 and 2035
  • Figure 57: Latin America Market Y-o-Y Growth Comparison by Additive Type, 2025-2035
  • Figure 58: Latin America Market Attractiveness Analysis by Additive Type
  • Figure 59: Latin America Market Value Share and BPS Analysis by Source, 2025 and 2035
  • Figure 60: Latin America Market Y-o-Y Growth Comparison by Source, 2025-2035
  • Figure 61: Latin America Market Attractiveness Analysis by Source
  • Figure 62: Latin America Market Value Share and BPS Analysis by Livestock Type, 2025 and 2035
  • Figure 63: Latin America Market Y-o-Y Growth Comparison by Livestock Type, 2025-2035
  • Figure 64: Latin America Market Attractiveness Analysis by Livestock Type
  • Figure 65: Latin America Market Value Share and BPS Analysis by Application Method, 2025 and 2035
  • Figure 66: Latin America Market Y-o-Y Growth Comparison by Application Method, 2025-2035
  • Figure 67: Latin America Market Attractiveness Analysis by Application Method
  • Figure 68: Latin America Market Value Share and BPS Analysis by Functionality, 2025 and 2035
  • Figure 69: Latin America Market Y-o-Y Growth Comparison by Functionality, 2025-2035
  • Figure 70: Latin America Market Attractiveness Analysis by Functionality
  • Figure 71: Latin America Market Value Share and BPS Analysis by Form, 2025 and 2035
  • Figure 72: Latin America Market Y-o-Y Growth Comparison by Form, 2025-2035
  • Figure 73: Latin America Market Attractiveness Analysis by Form
  • Figure 74: Latin America Market Value Share and BPS Analysis by Sales Channel, 2025 and 2035
  • Figure 75: Latin America Market Y-o-Y Growth Comparison by Sales Channel, 2025-2035
  • Figure 76: Latin America Market Attractiveness Analysis by Sales Channel
  • Figure 77: Europe Market Value Share and BPS Analysis by Country, 2025 and 2035
  • Figure 78: Europe Market Value Share and BPS Analysis by Additive Type, 2025 and 2035
  • Figure 79: Europe Market Y-o-Y Growth Comparison by Additive Type, 2025-2035
  • Figure 80: Europe Market Attractiveness Analysis by Additive Type
  • Figure 81: Europe Market Value Share and BPS Analysis by Source, 2025 and 2035
  • Figure 82: Europe Market Y-o-Y Growth Comparison by Source, 2025-2035
  • Figure 83: Europe Market Attractiveness Analysis by Source
  • Figure 84: Europe Market Value Share and BPS Analysis by Livestock Type, 2025 and 2035
  • Figure 85: Europe Market Y-o-Y Growth Comparison by Livestock Type, 2025-2035
  • Figure 86: Europe Market Attractiveness Analysis by Livestock Type
  • Figure 87: Europe Market Value Share and BPS Analysis by Application Method, 2025 and 2035
  • Figure 88: Europe Market Y-o-Y Growth Comparison by Application Method, 2025-2035
  • Figure 89: Europe Market Attractiveness Analysis by Application Method
  • Figure 90: Europe Market Value Share and BPS Analysis by Functionality, 2025 and 2035
  • Figure 91: Europe Market Y-o-Y Growth Comparison by Functionality, 2025-2035
  • Figure 92: Europe Market Attractiveness Analysis by Functionality
  • Figure 93: Europe Market Value Share and BPS Analysis by Form, 2025 and 2035
  • Figure 94: Europe Market Y-o-Y Growth Comparison by Form, 2025-2035
  • Figure 95: Europe Market Attractiveness Analysis by Form
  • Figure 96: Europe Market Value Share and BPS Analysis by Sales Channel, 2025 and 2035
  • Figure 97: Europe Market Y-o-Y Growth Comparison by Sales Channel, 2025-2035
  • Figure 98: Europe Market Attractiveness Analysis by Sales Channel
  • Figure 99: East Asia Market Value Share and BPS Analysis by Country, 2025 and 2035
  • Figure 100: East Asia Market Value Share and BPS Analysis by Additive Type, 2025 and 2035
  • Figure 101: East Asia Market Y-o-Y Growth Comparison by Additive Type, 2025-2035
  • Figure 102: East Asia Market Attractiveness Analysis by Additive Type
  • Figure 103: East Asia Market Value Share and BPS Analysis by Source, 2025 and 2035
  • Figure 104: East Asia Market Y-o-Y Growth Comparison by Source, 2025-2035
  • Figure 105: East Asia Market Attractiveness Analysis by Source
  • Figure 106: East Asia Market Value Share and BPS Analysis by Livestock Type, 2025 and 2035
  • Figure 107: East Asia Market Y-o-Y Growth Comparison by Livestock Type, 2025-2035
  • Figure 108: East Asia Market Attractiveness Analysis by Livestock Type
  • Figure 109: East Asia Market Value Share and BPS Analysis by Application Method, 2025 and 2035
  • Figure 110: East Asia Market Y-o-Y Growth Comparison by Application Method, 2025-2035
  • Figure 111: East Asia Market Attractiveness Analysis by Application Method
  • Figure 112: East Asia Market Value Share and BPS Analysis by Functionality, 2025 and 2035
  • Figure 113: East Asia Market Y-o-Y Growth Comparison by Functionality, 2025-2035
  • Figure 114: East Asia Market Attractiveness Analysis by Functionality
  • Figure 115: East Asia Market Value Share and BPS Analysis by Form, 2025 and 2035
  • Figure 116: East Asia Market Y-o-Y Growth Comparison by Form, 2025-2035
  • Figure 117: East Asia Market Attractiveness Analysis by Form
  • Figure 118: East Asia Market Value Share and BPS Analysis by Sales Channel, 2025 and 2035
  • Figure 119: East Asia Market Y-o-Y Growth Comparison by Sales Channel, 2025-2035
  • Figure 120: East Asia Market Attractiveness Analysis by Sales Channel
  • Figure 121: South Asia & Pacific Market Value Share and BPS Analysis by Country, 2025 and 2035
  • Figure 122: South Asia & Pacific Market Value Share and BPS Analysis by Additive Type, 2025 and 2035
  • Figure 123: South Asia & Pacific Market Y-o-Y Growth Comparison by Additive Type, 2025-2035
  • Figure 124: South Asia & Pacific Market Attractiveness Analysis by Additive Type
  • Figure 125: South Asia & Pacific Market Value Share and BPS Analysis by Source, 2025 and 2035
  • Figure 126: South Asia & Pacific Market Y-o-Y Growth Comparison by Source, 2025-2035
  • Figure 127: South Asia & Pacific Market Attractiveness Analysis by Source
  • Figure 128: South Asia & Pacific Market Value Share and BPS Analysis by Livestock Type, 2025 and 2035
  • Figure 129: South Asia & Pacific Market Y-o-Y Growth Comparison by Livestock Type, 2025-2035
  • Figure 130: South Asia & Pacific Market Attractiveness Analysis by Livestock Type
  • Figure 131: South Asia & Pacific Market Value Share and BPS Analysis by Application Method, 2025 and 2035
  • Figure 132: South Asia & Pacific Market Y-o-Y Growth Comparison by Application Method, 2025-2035
  • Figure 133: South Asia & Pacific Market Attractiveness Analysis by Application Method
  • Figure 134: South Asia & Pacific Market Value Share and BPS Analysis by Functionality, 2025 and 2035
  • Figure 135: South Asia & Pacific Market Y-o-Y Growth Comparison by Functionality, 2025-2035
  • Figure 136: South Asia & Pacific Market Attractiveness Analysis by Functionality
  • Figure 137: South Asia & Pacific Market Value Share and BPS Analysis by Form, 2025 and 2035
  • Figure 138: South Asia & Pacific Market Y-o-Y Growth Comparison by Form, 2025-2035
  • Figure 139: South Asia & Pacific Market Attractiveness Analysis by Form
  • Figure 140: South Asia & Pacific Market Value Share and BPS Analysis by Sales Channel, 2025 and 2035
  • Figure 141: South Asia & Pacific Market Y-o-Y Growth Comparison by Sales Channel, 2025-2035
  • Figure 142: South Asia & Pacific Market Attractiveness Analysis by Sales Channel
  • Figure 143: Middle East and Africa Market Value Share and BPS Analysis by Country, 2025 and 2035
  • Figure 144: Middle East and Africa Market Value Share and BPS Analysis by Additive Type, 2025 and 2035
  • Figure 145: Middle East and Africa Market Y-o-Y Growth Comparison by Additive Type, 2025-2035
  • Figure 146: Middle East and Africa Market Attractiveness Analysis by Additive Type
  • Figure 147: Middle East and Africa Market Value Share and BPS Analysis by Source, 2025 and 2035
  • Figure 148: Middle East and Africa Market Y-o-Y Growth Comparison by Source, 2025-2035
  • Figure 149: Middle East and Africa Market Attractiveness Analysis by Source
  • Figure 150: Middle East and Africa Market Value Share and BPS Analysis by Livestock Type, 2025 and 2035
  • Figure 151: Middle East and Africa Market Y-o-Y Growth Comparison by Livestock Type, 2025-2035
  • Figure 152: Middle East and Africa Market Attractiveness Analysis by Livestock Type
  • Figure 153: Middle East and Africa Market Value Share and BPS Analysis by Application Method, 2025 and 2035
  • Figure 154: Middle East and Africa Market Y-o-Y Growth Comparison by Application Method, 2025-2035
  • Figure 155: Middle East and Africa Market Attractiveness Analysis by Application Method
  • Figure 156: Middle East and Africa Market Value Share and BPS Analysis by Functionality, 2025 and 2035
  • Figure 157: Middle East and Africa Market Y-o-Y Growth Comparison by Functionality, 2025-2035
  • Figure 158: Middle East and Africa Market Attractiveness Analysis by Functionality
  • Figure 159: Middle East and Africa Market Value Share and BPS Analysis by Form, 2025 and 2035
  • Figure 160: Middle East and Africa Market Y-o-Y Growth Comparison by Form, 2025-2035
  • Figure 161: Middle East and Africa Market Attractiveness Analysis by Form
  • Figure 162: Middle East and Africa Market Value Share and BPS Analysis by Sales Channel, 2025 and 2035
  • Figure 163: Middle East and Africa Market Y-o-Y Growth Comparison by Sales Channel, 2025-2035
  • Figure 164: Middle East and Africa Market Attractiveness Analysis by Sales Channel
  • Figure 165: Global Market - Tier Structure Analysis
  • Figure 166: Global Market - Company Share Analysis

Frequently Asked Questions

How big is the Methane Reduction Additives Market in 2025?

The global Methane Reduction Additives Market is estimated to be valued at USD 0.56 billion in 2025.

What will be the size of the Methane Reduction Additives Market in 2035?

The market size is projected to reach USD 1.01 billion by 2035.

How much will the Methane Reduction Additives Market grow between 2025 and 2035?

The market is expected to grow at a CAGR of 6.2% during 2025-2035.

What are the key additive types in the Methane Reduction Additives Market?

Key additive types include chemical inhibitors, seaweed & algal additives, probiotics, microbial strains, yeast cultures, enzyme-based solutions, and plant-based bioactives.

Which livestock segment will contribute the largest share in 2025?

In 2025, dairy cattle are expected to contribute the largest share at 52%, reflecting high adoption in large-scale milk production systems.

Explore Similar Insights

Future Market Insights

Methane Reduction Additives Market