E-Bike Motors Market Size, Share, and Forecast Outlook 2025 to 2035

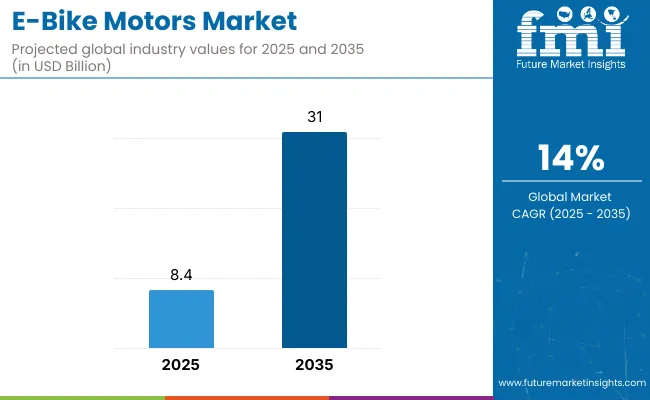
The global e-bike motors market is predicted to reach USD 8.4 billion in 2025 and USD 31 billion by 2035, expanding at a compound annual growth rate of 14% with a multiplying factor of 3.7 over the decade. Growth is driven by rising adoption of electric mobility, government incentives for clean transport, and consumer demand for affordable commuting solutions.
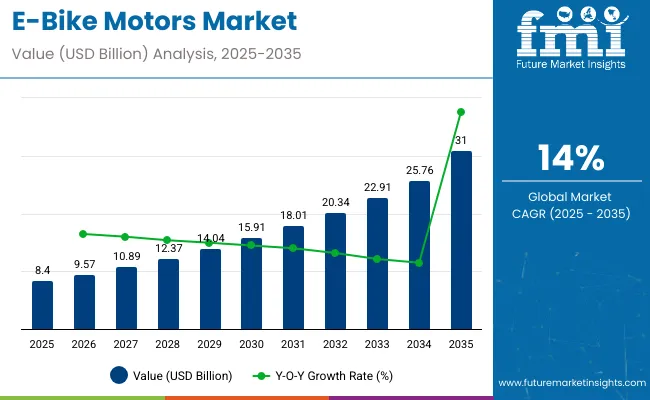
E Bike Motors Market 1

Quick stats of E-bike motors market

  • E-bike motors market size (2025): USD 8.4 billion
  • Projected e-bike motors market size (2035): USD 31 billion
  • Forecast CAGR of e-bike motors market (2025 to 2035): 14%
  • Leading segment of e-bike motors market (2025): Up to 250 W motors
  • Key growth regions of e-bike motors market: Europe, Asia Pacific, North America
  • Top key players of e-bike motors market: Bosch, TDCM, Yamaha Motor
  • Leading player share of e-bike motors market (2025): Bosch - 30%

E Bike Motors Market

Metric Value
Market Estimated Value in (2025E) USD 8.4 billion
Market Forecast Value in (2035F) USD 31 billion
Forecast CAGR (2025 to 2035) 14%

Breakpoint analysis identifies phases where adoption shifts significantly due to advancements in battery efficiency, improvements in mid-drive motor technology, and expanding urban transport infrastructure. These early breakpoints mark the transition from limited use toward broader acceptance across cities and recreational segments.

By 2035, with a market value of 31 billion, the sector is expected to cross a key breakpoint where e-bike motors move from being a sustainable alternative to becoming a mainstream mobility solution across both developed and emerging economies. Wider integration of smart connectivity, lightweight materials, and design compatibility will push the industry into accelerated adoption. Each breakpoint reflects new opportunities for efficiency, cost optimization, and improved performance. The multiplying factor of 3.7 underscores how aligned technological innovation, affordability, and infrastructure growth can reshape long-term market expansion, making e-bike motors a central component of future mobility solutions.

The e-bike motors market is supported by several upstream sectors. Two-wheeler and bicycle production makes up about 38%, as manufacturers integrate motor technology directly into frame designs. Electric motor and drive system industry contributes roughly 28%, supplying hub, mid-drive, and gear-assisted units. Battery technology and power electronics represent close to 17%, linking energy output to motor efficiency. Mechanical parts and mobility components account for nearly 10%, including chains, cassettes, and torque sensors. Retail, aftermarket, and service networks hold around 7%, covering distribution, upgrades, and repair services that sustain market adoption.

E-bike motor development is shifting toward lighter, quieter, and more powerful systems. Compact mid-drive motors are increasingly favored for mountain and performance bikes due to their torque delivery and weight balance. Hub motors still dominate entry-level and city bikes, driven by affordability and ease of installation. Manufacturers are exploring regenerative braking to extend riding range, while integration with IoT-based platforms allows riders to track efficiency and adjust assistance levels. Collaborative projects between e-bike brands, component makers, and battery innovators are producing tailored drive units. Premium players are also investing in fully integrated motor-battery solutions to streamline design and improve durability.

Top E Bike Motors Market Dynamics

E bike motors adoption is accelerating as cities push micromobility and commuters seek lower total cost of travel. Asia Pacific contributes the majority of unit demand, with strong uptake in China and Southeast Asia, while Europe leads premium commuter and cargo categories. Hub motors dominate entry and mid tiers for cost efficiency, while mid drive systems expand fastest in sports, trekking, and cargo use thanks to higher torque and better weight distribution.

Driving Force Urban Electrification and Performance Gains

Urban transport policies, growing cycling infrastructure, and rider preference for assisted mobility are amplifying demand for efficient, compact motors. Hub motors account for about 65-70% of installed base due to lower price and simpler maintenance, while mid drive penetration is rising in the premium mix as riders value 70-95 Nm torque delivery and natural cadence feel. Efficiency improvements of 8-15% versus previous generations are extending range per charge on 400-700 Wh packs. Cargo and trekking e bikes require sustained power at low cadence, favoring mid drives with better thermal management and gear interaction. Falling battery cost per Wh and better controllers are lifting overall value across commuter and leisure segments.

  • Mid drive unit share in new premium e bikes is approaching 45-50%.
  • Typical hub motor torque ranges 35-55 Nm; mid drives commonly deliver 70-95 Nm.
  • Controller efficiency upgrades cut energy losses by 5-8% on stop start routes.

Growth Avenue Segment Diversification and Platform Modularization

Demand is broadening beyond city bikes into cargo, MTB, gravel, and folding categories, creating differentiated motor requirements. Cargo platforms favor mid drives with reinforced mounts and 85-100 Nm torque, while folding models prioritize compact hub systems under 2.6 kg. Manufacturers are scaling modular motor families with shared electronics and gearsets to reduce bill of materials by 7-12% and speed OEM integration. Fleet and subscription operators are standardizing on swappable motor battery architectures to reduce downtime and improve utilization. Growing B2B sales in delivery fleets and municipal sharing programs add predictable volume that supports localized service footprints and aftermarket parts revenue.

  • Cargo e bike motor ASPs range USD 450-750 versus USD 180-350 for entry hub units.
  • Modular platforms cut OEM time to market by 20-30%.
  • Fleet duty cycles drive motor replacement intervals of 12-18 months in high mileage use.

Emerging Trend Lightweight Architecture and Smart Assistance

Lightweight motor housings, compact stators, and optimized gear trains are trimming motor mass by 10-15%, improving handling and lift convenience. Quiet operation is advancing with acoustic optimization of planetary gears and sine wave controllers, lowering perceived noise by 3-5 dB. Smart assistance blends torque, cadence, and speed sensors with grade prediction to smooth power delivery, reducing peak draw and extending range in mixed terrain. Over the air calibration allows post sale tuning of assistance curves, while diagnostics flag bearing wear and thermal events before failure. Integration with 21700 cell packs and higher bus voltages supports stronger sustained output without excessive heat buildup.

  • Sub 2.9 kg mid drive units are entering the 60-80 Nm class.
  • Predictive assistance can cut peak current draw by 10-12% on hilly commutes.
  • OTA updates reduce service visits and lift uptime by 5-7% annually.

Market Challenge Cost Structure, Supply Risks, and Standards

Advanced mid drive systems cost 30-45% more than hub motors due to torque sensors, reduction gearing, and higher grade magnets, raising retail prices in price sensitive markets. Rare earth magnet availability and lithium supply variability create lead time swings of 6-10 weeks and price volatility across motor BOMs. Warranty returns concentrate around bearings, controllers, and connectors, prompting OEMs to add sealing and strain relief that marginally increase mass and cost. Interoperability gaps between motor controllers, displays, and battery management systems complicate aftermarket upgrades and fleet maintenance. Meeting stricter regional e bike regulations on power and assist speed requires firmware variants and type approvals that add engineering overhead.

  • Premium mid drive ASPs commonly fall in USD 500-900; performance hubs in USD 250-450.
  • Magnet and copper price spikes can lift motor BOM by 8-12% in a quarter.
  • Water ingress failures decline 20-30% with upgraded IP ratings and cable armor.

Analyzing E-Bike Motors Market by Top Investment Segments

The e-bike motors market is structured by type, application, and product, with demand influenced by efficiency, power output, and manufacturing strategies. Motors up to 250 W dominate due to regulatory compliance and urban commuter adoption. OEM applications hold the largest share as manufacturers focus on integrated designs and bulk supply contracts. Hub motors remain the most popular product type because of cost-effectiveness and low maintenance requirements. Companies such as Bosch, Shimano, Yamaha, Bafang, and Mahle are central players in the industry.
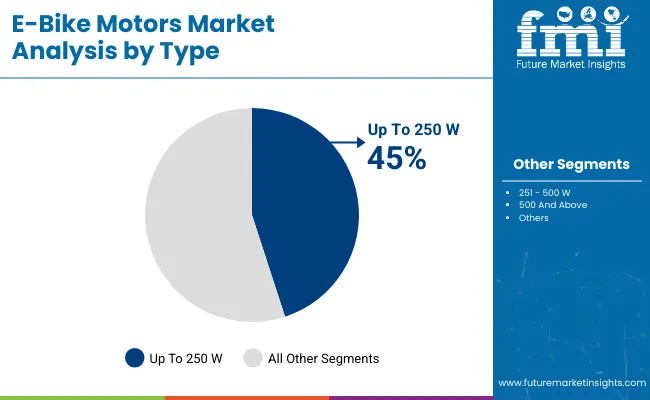
Up to 250 W leads Demand for E-Bike Motors by Type

E Bike Motors Market By Type

E-bike motors up to 250 W account for 45% of market demand, primarily driven by regulatory restrictions in Europe and commuter-friendly city bikes. These motors offer lightweight designs and sufficient performance for daily urban usage. Models in this range often pair with batteries delivering ranges of 40-70 km per charge. Manufacturers such as Bosch, Mahle, and Bafang focus heavily on this category, producing integrated drive units optimized for weight and efficiency. The market is supported by cycling adoption for health, last-mile delivery, and cost-effective transport alternatives. Lightweight frames and reduced maintenance needs also contribute to higher adoption in this category, particularly across European and Asian commuter markets.
  • Average motor weight in this category is 2.5-3.5 kg.
  • Up to 70% of European city e-bikes use ≤250 W motors.
  • Typical top speeds are capped at 25 km/h in compliance zones.

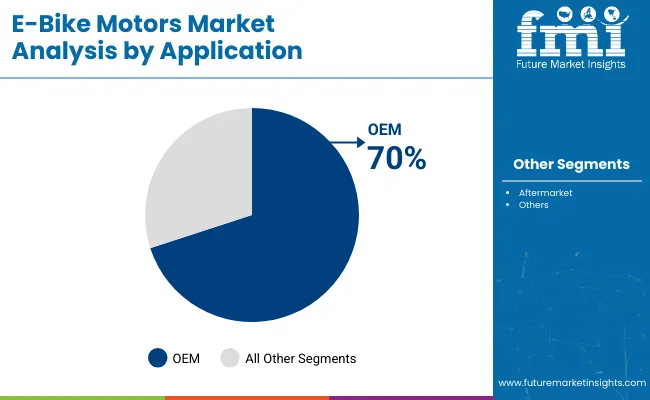
OEM is likely to Dominate by Application in 2025

E Bike Motors Market By Application

OEM applications hold 70% of e-bike motor demand, as most global manufacturers integrate motors directly during production. This ensures design compatibility, longer warranties, and better efficiency. OEM demand is strengthened by European and Asian brands such as Giant, Trek, and Merida, which contract with Bosch, Shimano, and Yamaha for bulk motor supplies. Production runs typically range from 100,000 to 500,000 units annually, ensuring economies of scale. The aftermarket segment at 25% is growing as cyclists seek customized performance upgrades. OEM control is likely to remain strong due to established supply chains and fleet-level manufacturing advantages, reducing operational costs and standardizing battery-motor systems.
  • OEM contracts often cover 3-5 years for major brands.
  • Integrated OEM designs improve energy efficiency by 12-15%.
  • Annual OEM motor shipments expected to cross 10 million units in 2025.

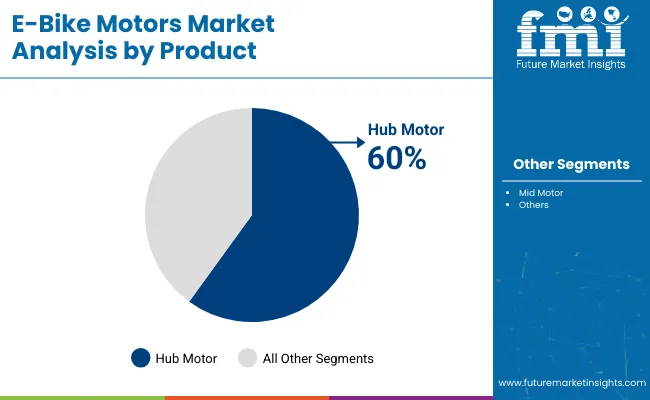
Hub Motor dominates Product Category with 60% Market Share

E Bike Motors Market By Product

Hub motors represent 60% of the e-bike motor market, favored for their affordability, ease of installation, and low maintenance requirements. Front and rear hub motors are widely used in commuter and entry-level e-bikes. These motors are compact, typically under 4 kg, and capable of ranges up to 80 km when paired with 400-500 Wh batteries. Leading suppliers include Bafang, MXUS, and Shengyi, which supply large volumes to Asian and European manufacturers. Hub motors are highly popular for fleets and rental e-bikes due to their durability and ease of replacement. Mid motors are expanding their share at 35%, appealing to performance-driven users in mountain biking and trekking applications.
  • Hub motors can be produced at costs 25-30% lower than mid motors.
  • Over 60% of Asia’s shared mobility e-bike fleets run on hub motors.
  • Typical output torque ranges between 30-50 Nm for commuter use.

Top Countries Expanding, Manufacturing, and Innovating in the E-Bike Motors Market

Country Wise E Bike Motors Market

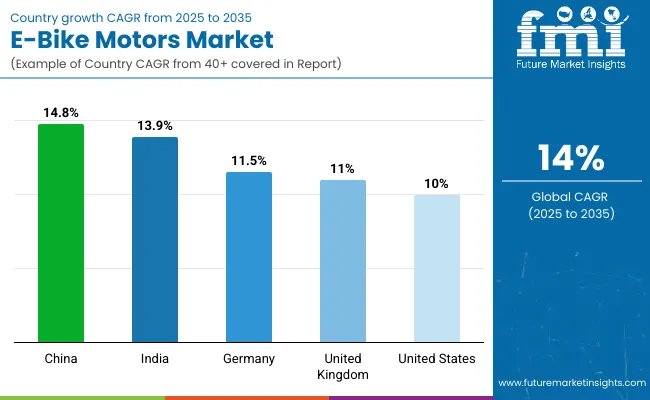
The global e-bike motors market is growing at a CAGR of 14.0% from 2025 to 2035. China leads at 14.8%, +6% above the global rate, supported by BRICS-driven production capacity, government incentives, and strong domestic adoption. India follows with 13.9%, just −1% below the global benchmark, reflecting BRICS and ASEAN-linked demand growth and rising urban mobility needs. Germany records 11.5%, −18% under the global CAGR, with OECD-backed investments in premium e-bike technology and sustainable commuting solutions. The United Kingdom posts 11.0%, −21% compared with the global average, reflecting steady but moderate adoption in a mature OECD market. The United States stands at 10.0%, −29% below the global rate, with growth influenced by OECD-driven technological improvements but slower mass adoption. The overall pattern shows BRICS economies, especially China and India, driving volume expansion, while OECD countries emphasize advanced technology and high-value segments.

Growth Analysis of E-Bike Motors Market in China

China, with a CAGR of 14.8%, continues to dominate the e-bike motors industry. The country’s strong manufacturing ecosystem and over 35 million annual e-bike sales provide scale unmatched by any other region. Domestic companies are investing heavily in high-efficiency brushless motors, while export demand is strengthening in Europe and North America. The rapid uptake of mid-drive technology is improving performance, while government regulations are ensuring compliance with international standards. By 2030, China’s e-bike motor production capacity is expected to expand by over 40%, with exports forming an increasingly important revenue stream.

  • Average motor efficiency in new models has improved by 15% in five years
  • Over 60% of global mid-drive motor shipments originate from China
  • Export value of e-bike motors projected to surpass 10 billion USD by 2030

Future Outlook for E-Bike Motors Market in India

India’s e-bike motors market is growing at a CAGR of 13.9%, supported by strong demand in both metropolitan and semi-urban regions. Local startups are focusing on hub motor production, offering cost-effective solutions for budget-friendly e-bikes. Increasing consumer demand for affordable commuting options is stimulating investment in domestic motor assembly plants. Rising adoption in delivery fleets is further boosting demand for motors that provide higher torque and extended battery compatibility. By 2030, India is expected to capture a significant share of global motor consumption, driven by price competitiveness and large-scale adoption of electric two-wheelers.

  • Entry-level hub motors account for nearly 65% of domestic installations
  • Delivery fleet adoption is growing at 20% annually
  • Local sourcing of e-bike motor components expected to reach 50% by 2029

E-Bike Motors Market Expansion in Germany

Germany is projected to grow at 11.5% CAGR in the e-bike motors market, driven by premium demand in commuter and leisure bicycles. Strong domestic brands specializing in mid-drive motors dominate the European landscape, contributing to Germany’s role as a technology leader. Recreational e-bikes, including trekking and mountain categories, are seeing double-digit annual growth. Government cycling infrastructure investments are also encouraging higher adoption of premium e-bike systems, further supporting domestic demand. By 2030, Germany is expected to maintain its position as Europe’s largest exporter of advanced motor systems.

  • Mountain e-bike segment forecast to grow at 13% annually
  • Over 70% of Germany’s e-bike sales use locally produced mid-drive motors
  • Export share of German motors within Europe is projected to rise by 25% by 2028

Market Forecast for E-Bike Motors in the United Kingdom

The United Kingdom is expanding at a CAGR of 11.0% in the e-bike motors market. Growth is influenced by rising adoption in city commuting, particularly in London and Manchester, where cycling infrastructure continues to expand. Imports dominate the market, although partnerships with European motor suppliers are increasing local availability. Demand for compact and lightweight hub motors is strong, especially for folding e-bikes suited to urban consumers. By 2030, the UK is projected to nearly double its total e-bike motor consumption compared to 2023 levels.

  • Folding e-bike category expected to grow at 17% annually
  • Over 80% of e-bike motors sold in the UK are imported
  • Motor replacements and aftersales services forecast to expand 12% annually by 2030

E-Bike Motors Market Growth in the United States

The United States e-bike motors market, with a CAGR of 10.0%, is growing steadily as consumer demand for health-focused and high-speed e-bikes accelerates. The cargo and delivery segment is particularly strong, requiring motors with higher power output and longer durability. Domestic assembly is increasing, with suppliers adapting products for local terrain and performance needs. Retail expansion through online platforms and specialty stores has made e-bike motors more accessible to a wider consumer base. By 2030, motor shipments in the US are expected to exceed 4 million annually.
  • Cargo e-bike category projected to expand at 16% annually
  • Online sales channels forecast to capture 35% of motor sales by 2027
  • High-torque motor segment expected to grow at 12% annually through 2030

Leading E-Bike Motors Manufacturers, Suppliers, Distributors

E Bike Motors Market By Company

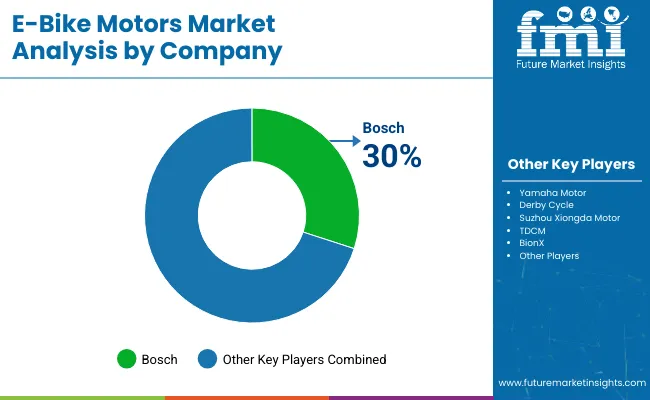
Bosch - 30% (market leader)

The e-bike motors market is supported by both global leaders and specialized manufacturers that focus on performance, durability, and integration with advanced bicycle systems. Bosch has emerged as a major force by offering mid-drive motors with optimized torque control, widely adopted by premium e-bike brands in Europe and North America. Yamaha Motor continues to strengthen its presence with compact and lightweight motors that are designed for both urban commuting and off-road cycling. Derby Cycle, one of Europe’s largest bicycle producers, incorporates in-house motor solutions while also partnering with component makers to expand its range of electric-assisted bikes.

Other players are shaping the competitive landscape through targeted innovation and regional expansion. Suzhou Xiongda Motor from China focuses on hub motors that provide affordable yet reliable solutions for mass-market e-bikes. TDCM emphasizes custom-built motor systems tailored for specific bicycle manufacturers, enhancing brand differentiation. Although BionXfaced restructuring, its motor technologies continue to influence product designs across certain regions. Strategies in this sector include new product launches, collaborations with bicycle manufacturers, and investment in research and development to deliver motors that balance power efficiency, compact design, and riding comfort, keeping competition strong across international markets.

Leading Players

  • TDCM
  • BionX
  • Derby Cycle
  • Bosch
  • Suzhou Xiongda Motor
  • Yamaha Motor

Report Scope

Report Attributes Details
Market Size, 2025 USD 8.4 billion
Projected Market Size, 2035 USD 31 billion
CAGR, 2025 to 2035 14%
Base Year for Estimation 2024
Historical Period 2020 to 2024
Projection Period 2025 to 2035
Quantitative Units USD billion for value
Type Segments Analyzed Up to 250 W, 251 to 500 W, 500 W and above, Other
Application Segments Analyzed OEM, Aftermarket, Other
Product Segments Analyzed Hub Motor, Mid Motor, Other
Regions Covered North America, Latin America, Europe, Asia Pacific, Middle East and Africa
Countries Covered United States, Canada, Mexico, Brazil, Argentina, Germany, United Kingdom, France, Italy, Spain, Netherlands, Sweden, Poland, China, Japan, India, South Korea, Indonesia, Thailand, Vietnam, Australia, New Zealand, United Arab Emirates, Saudi Arabia, South Africa, Turkey, Egypt
Key Players Influencing the Market TDCM, BionX , Derby Cycle, Bosch, Suzhou Xiongda Motor, Yamaha Motor
Additional Attributes Dollar sales by motor type and bike category, demand dynamics across city bikes, mountain bikes, and cargo e-bikes, regional adoption trends across Europe, Asia Pacific, and North America, innovation in mid-drive systems, lightweight hub motors, and torque sensors, environmental impact of battery integration and recyclability, and emerging use in connected e-mobility and long-range performance models

E-Bike Motors Market Analyzed by Key Investment Segments 

By Type:

  • Up to 250 W
  • 251 - 500 W
  • 500 And Above
  • Other

By Application:

  • OEM
  • Aftermarket
  • Other

By Product:

  • Hub Motor
  • Mid Motor
  • Other

By Region:

  • North America
  • Latin America
  • Europe
  • Asia Pacific
  • The Middle East and Africa

Table of Content

  1. Executive Summary
    • Global Market Outlook
    • Demand-side Trends
    • Supply-side Trends
    • Technology Roadmap Analysis
    • Analysis and Recommendations
  2. Market Overview
    • Market Coverage / Taxonomy
    • Market Definition / Scope / Limitations
  3. Market Background
    • Market Dynamics
      • Drivers
      • Restraints
      • Opportunity
      • Trends
    • Scenario Forecast
      • Demand in Optimistic Scenario
      • Demand in Likely Scenario
      • Demand in Conservative Scenario
    • Opportunity Map Analysis
    • Product Life Cycle Analysis
    • Supply Chain Analysis
      • Supply Side Participants and their Roles
        • Producers
        • Mid-Level Participants (Traders/ Agents/ Brokers)
        • Wholesalers and Distributors
      • Value Added and Value Created at Node in the Supply Chain
      • List of Raw Material Suppliers
      • List of Existing and Potential Buyer’s
    • Investment Feasibility Matrix
    • Value Chain Analysis
      • Profit Margin Analysis
      • Wholesalers and Distributors
      • Retailers
    • PESTLE and Porter’s Analysis
    • Regulatory Landscape
      • By Key Regions
      • By Key Countries
    • Regional Parent Market Outlook
    • Production and Consumption Statistics
    • Import and Export Statistics
  4. Global Market Analysis 2020 to 2024 and Forecast, 2025 to 2035
    • Historical Market Size Value (USD Billion) & Volume (Thousand Units) Analysis, 2020 to 2024
    • Current and Future Market Size Value (USD Billion) & Volume (Thousand Units) Projections, 2025 to 2035
      • Y-o-Y Growth Trend Analysis
      • Absolute $ Opportunity Analysis
  5. Global Market Pricing Analysis 2020 to 2024 and Forecast 2025 to 2035
  6. Global Market Analysis 2020 to 2024 and Forecast 2025 to 2035, By Type
    • Introduction / Key Findings
    • Historical Market Size Value (USD Billion) & Volume (Thousand Units) Analysis By Type, 2020 to 2024
    • Current and Future Market Size Value (USD Billion) & Volume (Thousand Units) Analysis and Forecast By Type, 2025 to 2035
      • Up To 250 W
      • 251 - 500 W
      • 500 And Above
      • Other
    • Y-o-Y Growth Trend Analysis By Type, 2020 to 2024
    • Absolute $ Opportunity Analysis By Type, 2025 to 2035
  7. Global Market Analysis 2020 to 2024 and Forecast 2025 to 2035, By Application
    • Introduction / Key Findings
    • Historical Market Size Value (USD Billion) & Volume (Thousand Units) Analysis By Application, 2020 to 2024
    • Current and Future Market Size Value (USD Billion) & Volume (Thousand Units) Analysis and Forecast By Application, 2025 to 2035
      • OEM
      • Aftermarket
      • Other
    • Y-o-Y Growth Trend Analysis By Application, 2020 to 2024
    • Absolute $ Opportunity Analysis By Application, 2025 to 2035
  8. Global Market Analysis 2020 to 2024 and Forecast 2025 to 2035, By Product
    • Introduction / Key Findings
    • Historical Market Size Value (USD Billion) & Volume (Thousand Units) Analysis By Product, 2020 to 2024
    • Current and Future Market Size Value (USD Billion) & Volume (Thousand Units) Analysis and Forecast By Product, 2025 to 2035
      • Hub Motor
      • Mid Motor
      • Other
    • Y-o-Y Growth Trend Analysis By Product, 2020 to 2024
    • Absolute $ Opportunity Analysis By Product, 2025 to 2035
  9. Global Market Analysis 2020 to 2024 and Forecast 2025 to 2035, By Region
    • Introduction
    • Historical Market Size Value (USD Billion) & Volume (Thousand Units) Analysis By Region, 2020 to 2024
    • Current Market Size Value (USD Billion) & Volume (Thousand Units) Analysis and Forecast By Region, 2025 to 2035
      • North America
      • Latin America
      • Western Europe
      • Eastern Europe
      • East Asia
      • South Asia & Pacific
      • Middle East and Africa
    • Market Attractiveness Analysis By Region
  10. North America Market Analysis 2020 to 2024 and Forecast 2025 to 2035, By Country
    • Historical Market Size Value (USD Billion) & Volume (Thousand Units) Trend Analysis By Market Taxonomy, 2020 to 2024
    • Market Size Value (USD Billion) & Volume (Thousand Units) Forecast By Market Taxonomy, 2025 to 2035
      • By Country
        • USA
        • Canada
        • Mexico
      • By Type
      • By Application
      • By Product
    • Market Attractiveness Analysis
      • By Country
      • By Type
      • By Application
      • By Product
    • Key Takeaways
  11. Latin America Market Analysis 2020 to 2024 and Forecast 2025 to 2035, By Country
    • Historical Market Size Value (USD Billion) & Volume (Thousand Units) Trend Analysis By Market Taxonomy, 2020 to 2024
    • Market Size Value (USD Billion) & Volume (Thousand Units) Forecast By Market Taxonomy, 2025 to 2035
      • By Country
        • Brazil
        • Argentina
        • Rest of LATAM
      • By Type
      • By Application
      • By Product
    • Market Attractiveness Analysis
      • By Country
      • By Type
      • By Application
      • By Product
    • Key Takeaways
  12. Western Europe Market Analysis 2020 to 2024 and Forecast 2025 to 2035, By Country
    • Historical Market Size Value (USD Billion) & Volume (Thousand Units) Trend Analysis By Market Taxonomy, 2020 to 2024
    • Market Size Value (USD Billion) & Volume (Thousand Units) Forecast By Market Taxonomy, 2025 to 2035
      • By Country
        • Germany
        • Italy
        • France
        • UK
        • Spain
        • BENELUX
        • Nordic
        • Rest of W.Europe
      • By Type
      • By Application
      • By Product
    • Market Attractiveness Analysis
      • By Country
      • By Type
      • By Application
      • By Product
    • Key Takeaways
  13. Eastern Europe Market Analysis 2020 to 2024 and Forecast 2025 to 2035, By Country
    • Historical Market Size Value (USD Billion) & Volume (Thousand Units) Trend Analysis By Market Taxonomy, 2020 to 2024
    • Market Size Value (USD Billion) & Volume (Thousand Units) Forecast By Market Taxonomy, 2025 to 2035
      • By Country
        • Russia
        • Hungary
        • Poland
        • Balkan & Baltics
        • Rest of E. Europe
      • By Type
      • By Application
      • By Product
    • Market Attractiveness Analysis
      • By Country
      • By Type
      • By Application
      • By Product
    • Key Takeaways
  14. East Asia Market Analysis 2020 to 2024 and Forecast 2025 to 2035, By Country
    • Historical Market Size Value (USD Billion) & Volume (Thousand Units) Trend Analysis By Market Taxonomy, 2020 to 2024
    • Market Size Value (USD Billion) & Volume (Thousand Units) Forecast By Market Taxonomy, 2025 to 2035
      • By Country
        • China
        • Japan
        • South Korea
      • By Type
      • By Application
      • By Product
    • Market Attractiveness Analysis
      • By Country
      • By Type
      • By Application
      • By Product
    • Key Takeaways
  15. South Asia & Pacific Market Analysis 2020 to 2024 and Forecast 2025 to 2035, By Country
    • Historical Market Size Value (USD Billion) & Volume (Thousand Units) Trend Analysis By Market Taxonomy, 2020 to 2024
    • Market Size Value (USD Billion) & Volume (Thousand Units) Forecast By Market Taxonomy, 2025 to 2035
      • By Country
        • India
        • Australia & New Zealand
        • ASEAN
        • Rest of SAP
      • By Type
      • By Application
      • By Product
    • Market Attractiveness Analysis
      • By Country
      • By Type
      • By Application
      • By Product
    • Key Takeaways
  16. Middle East and Africa Market Analysis 2020 to 2024 and Forecast 2025 to 2035, By Country
    • Historical Market Size Value (USD Billion) & Volume (Thousand Units) Trend Analysis By Market Taxonomy, 2020 to 2024
    • Market Size Value (USD Billion) & Volume (Thousand Units) Forecast By Market Taxonomy, 2025 to 2035
      • By Country
        • GCC Countries
        • Northern Africa
        • South Africa
        • Turkiye
        • Rest of MEA
      • By Type
      • By Application
      • By Product
    • Market Attractiveness Analysis
      • By Country
      • By Type
      • By Application
      • By Product
    • Key Takeaways
  17. Key Countries Market Analysis
    • USA
      • Pricing Analysis
      • Market Share Analysis, 2024
        • By Type
        • By Application
        • By Product
    • Canada
      • Pricing Analysis
      • Market Share Analysis, 2024
        • By Type
        • By Application
        • By Product
    • Brazil
      • Pricing Analysis
      • Market Share Analysis, 2024
        • By Type
        • By Application
        • By Product
    • Mexico
      • Pricing Analysis
      • Market Share Analysis, 2024
        • By Type
        • By Application
        • By Product
    • Argentina
      • Pricing Analysis
      • Market Share Analysis, 2024
        • By Type
        • By Application
        • By Product
  18. Market Structure Analysis
    • Competition Dashboard
    • Competition Benchmarking
    • Market Share Analysis of Top Players
      • By Regional
      • By Type
      • By Application
      • By Product
  19. Competition Analysis
    • Competition Deep Dive
      • Bosch
        • Overview
        • Product Portfolio
        • Profitability by Market Segments (Product/Age /Sales Channel/Region)
        • Sales Footprint
        • Strategy Overview
          • Marketing Strategy
          • Product Strategy
          • Channel Strategy
      • Yamaha Motor
        • Overview
        • Product Portfolio
        • Profitability by Market Segments (Product/Age /Sales Channel/Region)
        • Sales Footprint
        • Strategy Overview
          • Marketing Strategy
          • Product Strategy
          • Channel Strategy
      • Derby Cycle
        • Overview
        • Product Portfolio
        • Profitability by Market Segments (Product/Age /Sales Channel/Region)
        • Sales Footprint
        • Strategy Overview
          • Marketing Strategy
          • Product Strategy
          • Channel Strategy
      • Suzhou Xiongda Motor
        • Overview
        • Product Portfolio
        • Profitability by Market Segments (Product/Age /Sales Channel/Region)
        • Sales Footprint
        • Strategy Overview
          • Marketing Strategy
          • Product Strategy
          • Channel Strategy
      • TDCM (Taiwan Dynapower)
        • Overview
        • Product Portfolio
        • Profitability by Market Segments (Product/Age /Sales Channel/Region)
        • Sales Footprint
        • Strategy Overview
          • Marketing Strategy
          • Product Strategy
          • Channel Strategy
      • BionX
        • Overview
        • Product Portfolio
        • Profitability by Market Segments (Product/Age /Sales Channel/Region)
        • Sales Footprint
        • Strategy Overview
          • Marketing Strategy
          • Product Strategy
          • Channel Strategy
  20. Assumptions & Acronyms Used
  21. Research Methodology

List of Tables

  • Table 1: Global Market Value (USD Billion) Forecast by Region, 2020-2035
  • Table 2: Global Market Volume (Thousand Units) Forecast by Region, 2020-2035
  • Table 3: Global Market Value (USD Billion) Forecast by Type, 2020-2035
  • Table 4: Global Market Volume (Thousand Units) Forecast by Type, 2020-2035
  • Table 5: Global Market Value (USD Billion) Forecast by Application, 2020-2035
  • Table 6: Global Market Volume (Thousand Units) Forecast by Application, 2020-2035
  • Table 7: Global Market Value (USD Billion) Forecast by Product, 2020-2035
  • Table 8: Global Market Volume (Thousand Units) Forecast by Product, 2020-2035
  • Table 9: North America Market Value (USD Billion) Forecast by Country, 2020-2035
  • Table 10: North America Market Volume (Thousand Units) Forecast by Country, 2020-2035
  • Table 11: North America Market Value (USD Billion) Forecast by Type, 2020-2035
  • Table 12: North America Market Volume (Thousand Units) Forecast by Type, 2020-2035
  • Table 13: North America Market Value (USD Billion) Forecast by Application, 2020-2035
  • Table 14: North America Market Volume (Thousand Units) Forecast by Application, 2020-2035
  • Table 15: North America Market Value (USD Billion) Forecast by Product, 2020-2035
  • Table 16: North America Market Volume (Thousand Units) Forecast by Product, 2020-2035
  • Table 17: Latin America Market Value (USD Billion) Forecast by Country, 2020-2035
  • Table 18: Latin America Market Volume (Thousand Units) Forecast by Country, 2020-2035
  • Table 19: Latin America Market Value (USD Billion) Forecast by Type, 2020-2035
  • Table 20: Latin America Market Volume (Thousand Units) Forecast by Type, 2020-2035
  • Table 21: Latin America Market Value (USD Billion) Forecast by Application, 2020-2035
  • Table 22: Latin America Market Volume (Thousand Units) Forecast by Application, 2020-2035
  • Table 23: Latin America Market Value (USD Billion) Forecast by Product, 2020-2035
  • Table 24: Latin America Market Volume (Thousand Units) Forecast by Product, 2020-2035
  • Table 25: Western Europe Market Value (USD Billion) Forecast by Country, 2020-2035
  • Table 26: Western Europe Market Volume (Thousand Units) Forecast by Country, 2020-2035
  • Table 27: Western Europe Market Value (USD Billion) Forecast by Type, 2020-2035
  • Table 28: Western Europe Market Volume (Thousand Units) Forecast by Type, 2020-2035
  • Table 29: Western Europe Market Value (USD Billion) Forecast by Application, 2020-2035
  • Table 30: Western Europe Market Volume (Thousand Units) Forecast by Application, 2020-2035
  • Table 31: Western Europe Market Value (USD Billion) Forecast by Product, 2020-2035
  • Table 32: Western Europe Market Volume (Thousand Units) Forecast by Product, 2020-2035
  • Table 33: Eastern Europe Market Value (USD Billion) Forecast by Country, 2020-2035
  • Table 34: Eastern Europe Market Volume (Thousand Units) Forecast by Country, 2020-2035
  • Table 35: Eastern Europe Market Value (USD Billion) Forecast by Type, 2020-2035
  • Table 36: Eastern Europe Market Volume (Thousand Units) Forecast by Type, 2020-2035
  • Table 37: Eastern Europe Market Value (USD Billion) Forecast by Application, 2020-2035
  • Table 38: Eastern Europe Market Volume (Thousand Units) Forecast by Application, 2020-2035
  • Table 39: Eastern Europe Market Value (USD Billion) Forecast by Product, 2020-2035
  • Table 40: Eastern Europe Market Volume (Thousand Units) Forecast by Product, 2020-2035
  • Table 41: East Asia Market Value (USD Billion) Forecast by Country, 2020-2035
  • Table 42: East Asia Market Volume (Thousand Units) Forecast by Country, 2020-2035
  • Table 43: East Asia Market Value (USD Billion) Forecast by Type, 2020-2035
  • Table 44: East Asia Market Volume (Thousand Units) Forecast by Type, 2020-2035
  • Table 45: East Asia Market Value (USD Billion) Forecast by Application, 2020-2035
  • Table 46: East Asia Market Volume (Thousand Units) Forecast by Application, 2020-2035
  • Table 47: East Asia Market Value (USD Billion) Forecast by Product, 2020-2035
  • Table 48: East Asia Market Volume (Thousand Units) Forecast by Product, 2020-2035
  • Table 49: South Asia & Pacific Market Value (USD Billion) Forecast by Country, 2020-2035
  • Table 50: South Asia & Pacific Market Volume (Thousand Units) Forecast by Country, 2020-2035
  • Table 51: South Asia & Pacific Market Value (USD Billion) Forecast by Type, 2020-2035
  • Table 52: South Asia & Pacific Market Volume (Thousand Units) Forecast by Type, 2020-2035
  • Table 53: South Asia & Pacific Market Value (USD Billion) Forecast by Application, 2020-2035
  • Table 54: South Asia & Pacific Market Volume (Thousand Units) Forecast by Application, 2020-2035
  • Table 55: South Asia & Pacific Market Value (USD Billion) Forecast by Product, 2020-2035
  • Table 56: South Asia & Pacific Market Volume (Thousand Units) Forecast by Product, 2020-2035
  • Table 57: Middle East and Africa Market Value (USD Billion) Forecast by Country, 2020-2035
  • Table 58: Middle East and Africa Market Volume (Thousand Units) Forecast by Country, 2020-2035
  • Table 59: Middle East and Africa Market Value (USD Billion) Forecast by Type, 2020-2035
  • Table 60: Middle East and Africa Market Volume (Thousand Units) Forecast by Type, 2020-2035
  • Table 61: Middle East and Africa Market Value (USD Billion) Forecast by Application, 2020-2035
  • Table 62: Middle East and Africa Market Volume (Thousand Units) Forecast by Application, 2020-2035
  • Table 63: Middle East and Africa Market Value (USD Billion) Forecast by Product, 2020-2035
  • Table 64: Middle East and Africa Market Volume (Thousand Units) Forecast by Product, 2020-2035

List of Figures

  • Figure 1: Global Market Volume (Thousand Units) Forecast 2020-2035
  • Figure 2: Global Market Pricing Analysis
  • Figure 3: Global Market Value (USD Billion) Forecast 2020-2035
  • Figure 4: Global Market Value Share and BPS Analysis by Type, 2025 and 2035
  • Figure 5: Global Market Y-o-Y Growth Comparison by Type, 2025-2035
  • Figure 6: Global Market Attractiveness Analysis by Type
  • Figure 7: Global Market Value Share and BPS Analysis by Application, 2025 and 2035
  • Figure 8: Global Market Y-o-Y Growth Comparison by Application, 2025-2035
  • Figure 9: Global Market Attractiveness Analysis by Application
  • Figure 10: Global Market Value Share and BPS Analysis by Product, 2025 and 2035
  • Figure 11: Global Market Y-o-Y Growth Comparison by Product, 2025-2035
  • Figure 12: Global Market Attractiveness Analysis by Product
  • Figure 13: Global Market Value (USD Billion) Share and BPS Analysis by Region, 2025 and 2035
  • Figure 14: Global Market Y-o-Y Growth Comparison by Region, 2025-2035
  • Figure 15: Global Market Attractiveness Analysis by Region
  • Figure 16: North America Market Incremental $ Opportunity, 2025-2035
  • Figure 17: Latin America Market Incremental $ Opportunity, 2025-2035
  • Figure 18: Western Europe Market Incremental $ Opportunity, 2025-2035
  • Figure 19: Eastern Europe Market Incremental $ Opportunity, 2025-2035
  • Figure 20: East Asia Market Incremental $ Opportunity, 2025-2035
  • Figure 21: South Asia & Pacific Market Incremental $ Opportunity, 2025-2035
  • Figure 22: Middle East and Africa Market Incremental $ Opportunity, 2025-2035
  • Figure 23: North America Market Value Share and BPS Analysis by Country, 2025 and 2035
  • Figure 24: North America Market Value Share and BPS Analysis by Type, 2025 and 2035
  • Figure 25: North America Market Y-o-Y Growth Comparison by Type, 2025-2035
  • Figure 26: North America Market Attractiveness Analysis by Type
  • Figure 27: North America Market Value Share and BPS Analysis by Application, 2025 and 2035
  • Figure 28: North America Market Y-o-Y Growth Comparison by Application, 2025-2035
  • Figure 29: North America Market Attractiveness Analysis by Application
  • Figure 30: North America Market Value Share and BPS Analysis by Product, 2025 and 2035
  • Figure 31: North America Market Y-o-Y Growth Comparison by Product, 2025-2035
  • Figure 32: North America Market Attractiveness Analysis by Product
  • Figure 33: Latin America Market Value Share and BPS Analysis by Country, 2025 and 2035
  • Figure 34: Latin America Market Value Share and BPS Analysis by Type, 2025 and 2035
  • Figure 35: Latin America Market Y-o-Y Growth Comparison by Type, 2025-2035
  • Figure 36: Latin America Market Attractiveness Analysis by Type
  • Figure 37: Latin America Market Value Share and BPS Analysis by Application, 2025 and 2035
  • Figure 38: Latin America Market Y-o-Y Growth Comparison by Application, 2025-2035
  • Figure 39: Latin America Market Attractiveness Analysis by Application
  • Figure 40: Latin America Market Value Share and BPS Analysis by Product, 2025 and 2035
  • Figure 41: Latin America Market Y-o-Y Growth Comparison by Product, 2025-2035
  • Figure 42: Latin America Market Attractiveness Analysis by Product
  • Figure 43: Western Europe Market Value Share and BPS Analysis by Country, 2025 and 2035
  • Figure 44: Western Europe Market Value Share and BPS Analysis by Type, 2025 and 2035
  • Figure 45: Western Europe Market Y-o-Y Growth Comparison by Type, 2025-2035
  • Figure 46: Western Europe Market Attractiveness Analysis by Type
  • Figure 47: Western Europe Market Value Share and BPS Analysis by Application, 2025 and 2035
  • Figure 48: Western Europe Market Y-o-Y Growth Comparison by Application, 2025-2035
  • Figure 49: Western Europe Market Attractiveness Analysis by Application
  • Figure 50: Western Europe Market Value Share and BPS Analysis by Product, 2025 and 2035
  • Figure 51: Western Europe Market Y-o-Y Growth Comparison by Product, 2025-2035
  • Figure 52: Western Europe Market Attractiveness Analysis by Product
  • Figure 53: Eastern Europe Market Value Share and BPS Analysis by Country, 2025 and 2035
  • Figure 54: Eastern Europe Market Value Share and BPS Analysis by Type, 2025 and 2035
  • Figure 55: Eastern Europe Market Y-o-Y Growth Comparison by Type, 2025-2035
  • Figure 56: Eastern Europe Market Attractiveness Analysis by Type
  • Figure 57: Eastern Europe Market Value Share and BPS Analysis by Application, 2025 and 2035
  • Figure 58: Eastern Europe Market Y-o-Y Growth Comparison by Application, 2025-2035
  • Figure 59: Eastern Europe Market Attractiveness Analysis by Application
  • Figure 60: Eastern Europe Market Value Share and BPS Analysis by Product, 2025 and 2035
  • Figure 61: Eastern Europe Market Y-o-Y Growth Comparison by Product, 2025-2035
  • Figure 62: Eastern Europe Market Attractiveness Analysis by Product
  • Figure 63: East Asia Market Value Share and BPS Analysis by Country, 2025 and 2035
  • Figure 64: East Asia Market Value Share and BPS Analysis by Type, 2025 and 2035
  • Figure 65: East Asia Market Y-o-Y Growth Comparison by Type, 2025-2035
  • Figure 66: East Asia Market Attractiveness Analysis by Type
  • Figure 67: East Asia Market Value Share and BPS Analysis by Application, 2025 and 2035
  • Figure 68: East Asia Market Y-o-Y Growth Comparison by Application, 2025-2035
  • Figure 69: East Asia Market Attractiveness Analysis by Application
  • Figure 70: East Asia Market Value Share and BPS Analysis by Product, 2025 and 2035
  • Figure 71: East Asia Market Y-o-Y Growth Comparison by Product, 2025-2035
  • Figure 72: East Asia Market Attractiveness Analysis by Product
  • Figure 73: South Asia & Pacific Market Value Share and BPS Analysis by Country, 2025 and 2035
  • Figure 74: South Asia & Pacific Market Value Share and BPS Analysis by Type, 2025 and 2035
  • Figure 75: South Asia & Pacific Market Y-o-Y Growth Comparison by Type, 2025-2035
  • Figure 76: South Asia & Pacific Market Attractiveness Analysis by Type
  • Figure 77: South Asia & Pacific Market Value Share and BPS Analysis by Application, 2025 and 2035
  • Figure 78: South Asia & Pacific Market Y-o-Y Growth Comparison by Application, 2025-2035
  • Figure 79: South Asia & Pacific Market Attractiveness Analysis by Application
  • Figure 80: South Asia & Pacific Market Value Share and BPS Analysis by Product, 2025 and 2035
  • Figure 81: South Asia & Pacific Market Y-o-Y Growth Comparison by Product, 2025-2035
  • Figure 82: South Asia & Pacific Market Attractiveness Analysis by Product
  • Figure 83: Middle East and Africa Market Value Share and BPS Analysis by Country, 2025 and 2035
  • Figure 84: Middle East and Africa Market Value Share and BPS Analysis by Type, 2025 and 2035
  • Figure 85: Middle East and Africa Market Y-o-Y Growth Comparison by Type, 2025-2035
  • Figure 86: Middle East and Africa Market Attractiveness Analysis by Type
  • Figure 87: Middle East and Africa Market Value Share and BPS Analysis by Application, 2025 and 2035
  • Figure 88: Middle East and Africa Market Y-o-Y Growth Comparison by Application, 2025-2035
  • Figure 89: Middle East and Africa Market Attractiveness Analysis by Application
  • Figure 90: Middle East and Africa Market Value Share and BPS Analysis by Product, 2025 and 2035
  • Figure 91: Middle East and Africa Market Y-o-Y Growth Comparison by Product, 2025-2035
  • Figure 92: Middle East and Africa Market Attractiveness Analysis by Product
  • Figure 93: Global Market - Tier Structure Analysis
  • Figure 94: Global Market - Company Share Analysis

Frequently Asked Questions

What is the projected size of the E-bike motors market by 2035?

The e-bike motors market is projected to reach USD 31 billion by 2035.

What CAGR is expected in the E-bike motors market between 2025 and 2035?

The e-bike motors market is forecasted to grow at a CAGR of 14% during 2025-2035.

Which type segment will dominate the E-bike motors market in 2025?

Up to 250 W motors are expected to hold 45% share in 2025.

Which application segment leads the E-bike motors market in 2025?

OEM segment is estimated to capture 70% of the market in 2025.

Who is the leading player in the E -bike motors market and what is its share?

Bosch is the leading player with a 30% market share in 2025.

Explore Similar Insights

Future Market Insights

E-Bike Motors Market

Chat With

MaRIA

Hi There, I am MaRIA, Your Market Research Intelligence Assistant. How may I help you?