Hoist and Elevator Motors Market Outlook and Forecast 2025 to 2035

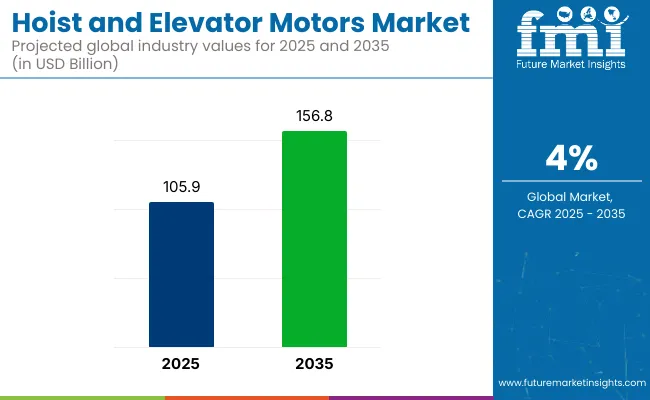
The hoist and elevator motors market is valued at USD 105.9 billion in 2025 and is slated to be worth USD 156.8 billion by 2035, growing at a 4% CAGR. Growth is being driven by rapid urbanization, infrastructure modernization, and heightened demand for energy-efficient vertical-transport solutions.

Additionally, smart-building initiatives, stringent safety regulations, and ongoing upgrades of aging lift systems contribute to expanding advanced motor installations worldwide. Greater adoption of IoT-enabled predictive-maintenance platforms has been observed, allowing downtime to be minimized and life-cycle costs to be lowered.

Significant innovations have been registered across hoist and elevator motors as manufacturers have prioritized efficiency and intelligence. Permanent-magnet synchronous drives with integrated regenerative braking have been engineered to cut energy consumption by up to thirty percent, while silicon-carbide inverters have been adopted to deliver cooler, lighter control modules.

Modular motor-gearbox assemblies have been designed for rapid retrofit, and biodegradable lubrication systems have been introduced to align equipment lifecycles with emerging carbon-neutral and circular-economy mandates under real-world operating conditions worldwide.

National and international bodies have imposed stringent regulatory frameworks, ensuring safety, energy efficiency, and environmental responsibility. Compliance has been mandated through standards such as EN 81-20/50 in Europe, ASME A17.1 in North America, and ISO 25745 for motor energy performance, while periodic inspections and certification cycles are required by local authorities. EU Ecodesign Directive has implemented minimum efficiency thresholds carbon-reduction targets have been embedded within LEED and BREEAM building codes.
Quick Stats of Hoist and Elevator Motors Market

  • Market Value (2025): USD 105.9 billion
  • Forecast Value (2035): USD 156.8 billion
  • Forecast CAGR: 4%
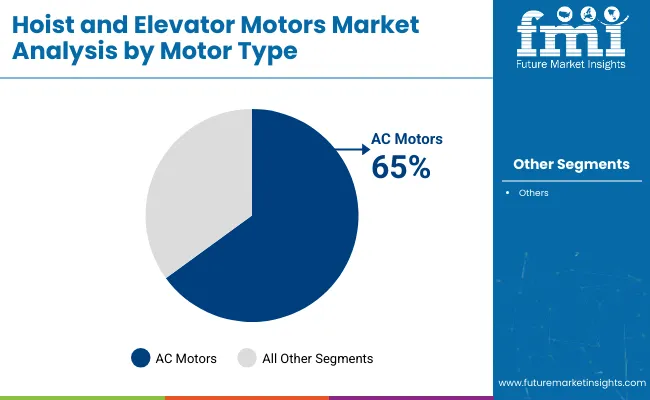
  • Motor Type Leader in 2025: AC Motors (65% market share in 2025)
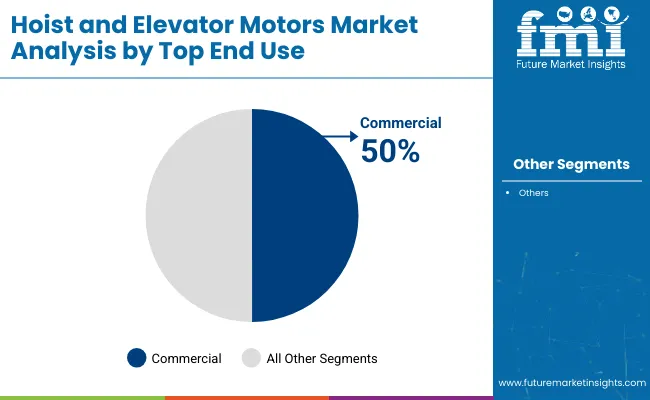
  • Top End Use Segment: Commercial (50% market share in 2025)
  • Key Growth Region: Western Europe (Germany is the fastest growing market with 4.1% CAGR)

Hoist And Elevator Motors Market

Metric Value
2025 Market Size USD 105.9 billion
2035 Market Size USD 156.8 billion
CAGR (2025 to 2035) 4%

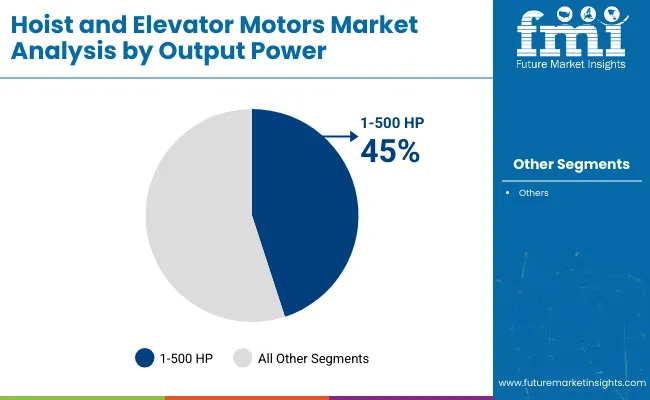
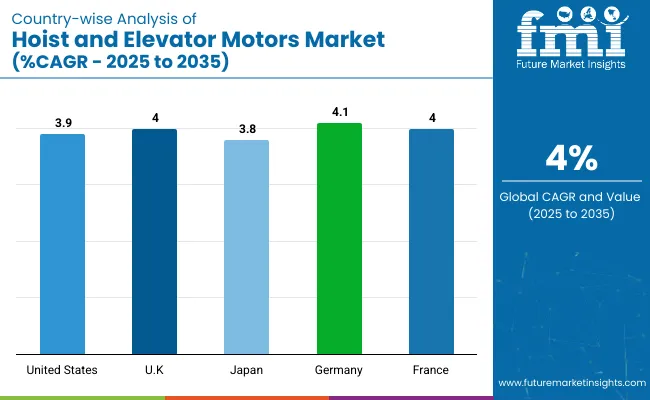
AC motors will dominate the motor type segment, holding a 65% market share in 2025. The commercial sector will lead the end-use segment, capturing 50% of global revenue. The 1-500 HP range will dominate the output power segment, holding a 45% market share in 2025. The UK and Germany are also expected to experience significant growth, with projected CAGRs of 4% and 4.1%, respectively, driven by urban renewal and energy-efficiency initiatives in residential and commercial buildings.

Analyzing the Hoist and Elevator Motors Market by Top Investment Segments

The hoist and elevator motors market is segmented into motor type, output power, end use, and region. By motor type, the market is bifurcated into AC motors and DC motors. Based on output power, the market is divided into less than 1 HP, 1-500 HP, and above 500 HP categories. In terms of end use, the market is categorized into residential, commercial, and industrial. Regionally, the market is classified into North America, Latin America, Western Europe, Eastern Europe, East Asia, South Asia & Pacific, and the Middle East & Africa.

AC Motors to Lead the Motor Type Segment with 65% Market Share in 2025

AC motors are expected to command 65% of global revenue in the hoist and elevator motors market by 2025, thereby securing the position of the most lucrative motor-type segment for the base year.
  • Such dominance is due to the widespread adoption of high-efficiency induction and permanent-magnet synchronous designs, favored for their smooth torque, regenerative braking, and reduced maintenance.
  • The preference for AC motors has been driven by stricter energy performance standards, lower noise requirements, and the easy availability of variable-frequency drive packages, which simplify retrofit planning.

Hoist And Elevator Motors Market Analysis By Motor Type

1-500 HP to Lead the Output Power Segment with 45% Share in 2025

The 1-500 HP range is the leading investment segment, accounting for 45% of global revenue in 2025. This is due to its versatility in mid-rise residential buildings, commercial complexes, and light-industrial lifts, where variable-frequency drives and gearless traction designs improve ride quality and energy efficiency.
  • The 1-500 HP range is favored because its torque and speed profiles were deemed suitable for most mid-rise elevator and freight-lift specifications.
  • Strong procurement activity is being observed in urban commercial towers, where mid-range motors were selected to balance performance with energy-saving targets mandated by local codes.

Hoist And Elevator Motors Market Analysis By Output Power

Commercial to Lead the End Use Segment with 50% Market Share

Commercial applications are expected to account for 50% of global revenue in 2025, making this segment the most profitable investment area.
  • Office towers, shopping malls, and hotels have driven significant demand, where high-capacity elevator motors are chosen to meet strict building-code requirements for energy efficiency and ride comfort.
  • Procurement budgets have focused on low-noise, gearless AC motor systems with regenerative drives, helping to reduce operating costs and ensure compliance with green-building certifications in commercial installations.

Hoist And Elevator Motors Market Analysis By Top End Use

Top Hoist and Elevator Motors Market Dynamics

Steady expansion is being observed in the hoist and elevator motors market, fueled by rapid urbanization, large-scale infrastructure modernization, stringent energy-efficiency mandates, and the integration of IoT-enabled automation technologies.

Recent Trends in the Hoist and Elevator Motors Market
  • An accelerated adoption of permanent-magnet synchronous and gearless traction motors has been observed for energy-efficient retrofits.
  • A rapid integration of IoT-enabled predictive-maintenance modules has been recorded across premium commercial projects.

Challenges in the Hoist and Elevator Motors Market

  • Capital expenditure has been constrained by fluctuating steel and rare-earth magnet prices, pressuring OEM margins.
  • Compliance burdens have been heightened by ever-stricter global safety and ecodesign regulations, extending approval timelines.

Analyzing Top Countries Producing and Supplying Hoist and Elevator Motors

Hoist And Elevator Motors Market Country Wise Analysis

USA Hoist and Elevator Motors Market Analysis

The USA hoist and elevator motors market is projected to grow at a CAGR of 3.9% from 2025 to 2035. Growth is expected to be encouraged by extensive high-rise construction, large-scale modernization of legacy elevators, and strict federal efficiency standards.

  • Persistent high-rise construction in major metropolitan areas has been observed.
  • Federal tax incentives for energy-efficient building equipment have been introduced.
  • Extensive modernization of elevators exceeding thirty years of service has been undertaken.

Hoist and Elevator Motor Sales Analysis in the UK

Sales of hoist and elevator motors in the UK are anticipated to grow at a CAGR of 4% between 2025 and 2035 as urban renewal schemes intensify. Market growth is expected to continue due to required energy-efficiency regulations, the widespread renovation of old buildings, and more installations of accessibility lifts.

  • Government carbon-neutral policies for new developments have been enforced.
  • Significant regeneration of heritage buildings with lift retrofits has been prioritized.
  • Public-private partnerships for smart-city elevator projects have been encouraged.

Hoist and Elevator Motor Demand Analysis in Germany

Germany's hoist and elevator motors market is expected to grow at a CAGR of 4.1% during the forecast period, driven by robust manufacturing capabilities and strict DIN building codes. Growth is projected to be propelled by the rapid adoption of regenerative drives within smart factories and logistics hubs.

  • Industrial automation demands in automotive hubs have been elevating motor orders.
  • Grants for energy-positive buildings have been allocated by federal agencies.
  • Integration of Industry 4.0 diagnostics into elevator systems has been advanced.

France Hoist and Elevator Motors Market Analysis

France hoist and elevator motors revenues are anticipated to grow at a CAGR of 4% during 2025 to 2035. Expansion is expected to be sustained by government incentives rewarding low-carbon materials and by heightened safety inspections following recent legislative revisions.

  • National renovation program for social-housing lifts has been activated.
  • Strict acoustic limits in residential areas have been imposed.
  • Incentives for domestically sourced components have been expanded.

Hoist and Elevator Motor Demand Analysis in Japan

Japan's hoist and elevator motors market is poised to increase at a CAGR of 3.8% over 2025 to 2035, reflecting stable residential demand and advanced commercial high-rises in Tokyo and Osaka. Market growth is predicted to be encouraged by rapid replacement of aging DC systems, seismic-resilient motor engineering, and extensive use of automation in manufacturing.

  • Frequent seismic upgrades for elevator safety have been mandated.
  • Continuous miniaturization of motor assemblies for space-saving shafts has been pursued.
  • The aging population for residential lifts has been acknowledged.

Leading Hoist and Elevator Motor Suppliers and Manufacturers

The competitive landscape has been considered moderately consolidated, with the ten largest suppliers jointly accounting for a little over half of global revenue, even though a long tail of regional manufacturers still serves niche lift-modernization projects. Intense rivalry has been observed among ABB, Siemens, Rockwell Automation, Regal Rexnord, and Maxon, which have been positioned as tier-one technology leaders, while smaller players focus on localized service contracts and retrofits.

Pricing agility, platform innovation, and portfolio expansion have been pursued as the primary competitive levers. Top vendors launch premium permanent-magnet synchronous and IE5-class induction motors to satisfy stricter ecodesign rules. They also focus on integrated drive-motor packages with predictive-maintenance software.

Recent Hoist and Elevator Motors Industry News

  • In June 2025, a synchronous motor developed by ABB was certified at 99.13% efficiency, setting a new world record for large industrial drives.
  • In May 2024, Maxon Group released its 2024/25 catalogue featuring ECX PRIME brushless motors and IDX-series integrated drives aimed at compact lift applications.

Hoist and Elevator Motors Market Report Scope

Report Attributes Details
Market Size (2025) USD 105.9 billion
Projected Market Size (2035) USD 156.8 billion
CAGR (2025 to 2035) 4%
Base Year for Estimation 2024
Historical Period 2020 to 2024
Projections Period 2025 to 2035
Report Parameters Revenue in USD billions / Volume in thousand units
Motor Type Analyzed AC motors and DC motors
Output Power Analyzed Less than 1 HP, 1 – 500 HP, and Above 500 HP
End Use Analyzed Residential, Commercial, and Industrial
Regions Covered North America, Latin America, Western Europe, Eastern Europe, East Asia, South Asia & Pacific, Middle East & Africa
Countries Covered United States, Canada, United Kingdom, Germany, France, China, Japan, South Korea, Brazil, Australia
Key Players ARC Systems Inc., Asmo Co. Ltd., ABB Group, Dr. Fritz Faulhaber GmbH, Brook Crompton UK Ltd., Rockwell Automation Inc., Regal Rexnord Corp., Emerson Electric, Siemens AG, Maxon Group, among others
Additional Attributes Dollar sales by value, market share analysis by region, and country-wise analysis.

Key Segmentation

By Motor Type:

  • AC motors
    • Geared AC motors
    • 3 phase induction motors
  • DC motors
    • Series DC motors
    • Shunt DC motors
    • Compound motors
    • PMDC motors

By Output Power:

  • Less than 1 HP
  • 1 - 500 HP
  • Above 500 HP

By End Use:

  • Residential
  • Commercial
  • Industrial

By Region:

  • North America
    • USA & Canada
  • Latin America
    • Brazil, Mexico, and Others
  • Western Europe
    • EU5
    • Nordics
    • Benelux
  • Eastern Europe
  • Asia Pacific
    • Australia and New Zealand (ANZ)
    • Greater China
    • India
    • ASIAN
    • Rest of Asia Pacific
    • Japan
  • Middle East and Africa
    • GCC Countries
    • Other Middle East
    • North Africa
    • South Africa
    • Other Africa

Table of Content

  1. Executive Summary
    • Global Market Outlook
    • Demand-side Trends
    • Supply-side Trends
    • Technology Roadmap Analysis
    • Analysis and Recommendations
  2. Market Overview
    • Market Coverage / Taxonomy
    • Market Definition / Scope / Limitations
  3. Market Background
    • Market Dynamics
      • Drivers
      • Restraints
      • Opportunity
      • Trends
    • Scenario Forecast
      • Demand in Optimistic Scenario
      • Demand in Likely Scenario
      • Demand in Conservative Scenario
    • Opportunity Map Analysis
    • Product Life Cycle Analysis
    • Supply Chain Analysis
      • Supply Side Participants and their Roles
        • Producers
        • Mid-Level Participants (Traders/ Agents/ Brokers)
        • Wholesalers and Distributors
      • Value Added and Value Created at Node in the Supply Chain
      • List of Raw Material Suppliers
      • List of Existing and Potential Buyer’s
    • Investment Feasibility Matrix
    • Value Chain Analysis
      • Profit Margin Analysis
      • Wholesalers and Distributors
      • Retailers
    • PESTLE and Porter’s Analysis
    • Regulatory Landscape
      • By Key Regions
      • By Key Countries
    • Regional Parent Market Outlook
    • Production and Consumption Statistics
    • Import and Export Statistics
  4. Global Analysis 2020 to 2024 and Forecast, 2025 to 2035
    • Historical Market Size Value (USD Billion) & Volume (Thousand Units) Analysis, 2020 to 2024
    • Current and Future Market Size Value (USD Billion) & Volume (Thousand Units) Projections, 2025 to 2035
      • Y-o-Y Growth Trend Analysis
      • Absolute USD Opportunity Analysis
  5. Global Pricing Analysis 2020 to 2024 and Forecast 2025 to 2035
  6. Global Analysis 2020 to 2024 and Forecast 2025 to 2035, By Motor Type
    • Introduction / Key Findings
    • Historical Market Size Value (USD Billion) & Volume (Thousand Units) Analysis By Motor Type, 2020 to 2024
    • Current and Future Market Size Value (USD Billion) & Volume (Thousand Units) Analysis and Forecast By Motor Type, 2025 to 2035
      • AC Motors
      • DC Motors
    • Y-o-Y Growth Trend Analysis By Motor Type, 2020 to 2024
    • Absolute USD Opportunity Analysis By Motor Type, 2025 to 2035
  7. Global Analysis 2020 to 2024 and Forecast 2025 to 2035, By Output Power
    • Introduction / Key Findings
    • Historical Market Size Value (USD Billion) & Volume (Thousand Units) Analysis By Output Power, 2020 to 2024
    • Current and Future Market Size Value (USD Billion) & Volume (Thousand Units) Analysis and Forecast By Output Power, 2025 to 2035
      • Less than 1 HP
      • 1 - 500 HP
      • Above 500 HP
    • Y-o-Y Growth Trend Analysis By Output Power, 2020 to 2024
    • Absolute USD Opportunity Analysis By Output Power, 2025 to 2035
  8. Global Analysis 2020 to 2024 and Forecast 2025 to 2035, By End Use
    • Introduction / Key Findings
    • Historical Market Size Value (USD Billion) & Volume (Thousand Units) Analysis By End Use, 2020 to 2024
    • Current and Future Market Size Value (USD Billion) & Volume (Thousand Units) Analysis and Forecast By End Use, 2025 to 2035
      • Residential
      • Commercial
      • Industrial
    • Y-o-Y Growth Trend Analysis By End Use, 2020 to 2024
    • Absolute USD Opportunity Analysis By End Use, 2025 to 2035
  9. Global Analysis 2020 to 2024 and Forecast 2025 to 2035, By Region
    • Introduction
    • Historical Market Size Value (USD Billion) & Volume (Thousand Units) Analysis By Region, 2020 to 2024
    • Current Market Size Value (USD Billion) & Volume (Thousand Units) Analysis and Forecast By Region, 2025 to 2035
      • North America
      • Latin America
      • Western Europe
      • Eastern Europe
      • East Asia
      • South Asia & Pacific
      • Middle East and Africa
    • Market Attractiveness Analysis By Region
  10. North America Analysis 2020 to 2024 and Forecast 2025 to 2035, By Country
    • Historical Market Size Value (USD Billion) & Volume (Thousand Units) Trend Analysis By Market Taxonomy, 2020 to 2024
    • Market Size Value (USD Billion) & Volume (Thousand Units) Forecast By Market Taxonomy, 2025 to 2035
      • By Country
        • USA
        • Canada
        • Mexico
      • By Motor Type
      • By Output Power
      • By End Use
    • Market Attractiveness Analysis
      • By Country
      • By Motor Type
      • By Output Power
      • By End Use
    • Key Takeaways
  11. Latin America Analysis 2020 to 2024 and Forecast 2025 to 2035, By Country
    • Historical Market Size Value (USD Billion) & Volume (Thousand Units) Trend Analysis By Market Taxonomy, 2020 to 2024
    • Market Size Value (USD Billion) & Volume (Thousand Units) Forecast By Market Taxonomy, 2025 to 2035
      • By Country
        • Brazil
        • Argentina
        • Rest of LATAM
      • By Motor Type
      • By Output Power
      • By End Use
    • Market Attractiveness Analysis
      • By Country
      • By Motor Type
      • By Output Power
      • By End Use
    • Key Takeaways
  12. Western Europe Analysis 2020 to 2024 and Forecast 2025 to 2035, By Country
    • Historical Market Size Value (USD Billion) & Volume (Thousand Units) Trend Analysis By Market Taxonomy, 2020 to 2024
    • Market Size Value (USD Billion) & Volume (Thousand Units) Forecast By Market Taxonomy, 2025 to 2035
      • By Country
        • Germany
        • Italy
        • France
        • UK
        • Spain
        • BENELUX
        • Nordic
        • Rest of W.Europe
      • By Motor Type
      • By Output Power
      • By End Use
    • Market Attractiveness Analysis
      • By Country
      • By Motor Type
      • By Output Power
      • By End Use
    • Key Takeaways
  13. Eastern Europe Analysis 2020 to 2024 and Forecast 2025 to 2035, By Country
    • Historical Market Size Value (USD Billion) & Volume (Thousand Units) Trend Analysis By Market Taxonomy, 2020 to 2024
    • Market Size Value (USD Billion) & Volume (Thousand Units) Forecast By Market Taxonomy, 2025 to 2035
      • By Country
        • Russia
        • Hungary
        • Poland
        • Balkan & Baltics
        • Rest of E. Europe
      • By Motor Type
      • By Output Power
      • By End Use
    • Market Attractiveness Analysis
      • By Country
      • By Motor Type
      • By Output Power
      • By End Use
    • Key Takeaways
  14. East Asia Analysis 2020 to 2024 and Forecast 2025 to 2035, By Country
    • Historical Market Size Value (USD Billion) & Volume (Thousand Units) Trend Analysis By Market Taxonomy, 2020 to 2024
    • Market Size Value (USD Billion) & Volume (Thousand Units) Forecast By Market Taxonomy, 2025 to 2035
      • By Country
        • China
        • Japan
        • South Korea
      • By Motor Type
      • By Output Power
      • By End Use
    • Market Attractiveness Analysis
      • By Country
      • By Motor Type
      • By Output Power
      • By End Use
    • Key Takeaways
  15. South Asia & Pacific Analysis 2020 to 2024 and Forecast 2025 to 2035, By Country
    • Historical Market Size Value (USD Billion) & Volume (Thousand Units) Trend Analysis By Market Taxonomy, 2020 to 2024
    • Market Size Value (USD Billion) & Volume (Thousand Units) Forecast By Market Taxonomy, 2025 to 2035
      • By Country
        • India
        • Australia & New Zealand
        • ASEAN
        • Rest of SAP
      • By Motor Type
      • By Output Power
      • By End Use
    • Market Attractiveness Analysis
      • By Country
      • By Motor Type
      • By Output Power
      • By End Use
    • Key Takeaways
  16. Middle East and Africa Analysis 2020 to 2024 and Forecast 2025 to 2035, By Country
    • Historical Market Size Value (USD Billion) & Volume (Thousand Units) Trend Analysis By Market Taxonomy, 2020 to 2024
    • Market Size Value (USD Billion) & Volume (Thousand Units) Forecast By Market Taxonomy, 2025 to 2035
      • By Country
        • GCC Countries
        • Northern Africa
        • South Africa
        • Turkiye
        • Rest of MEA
      • By Motor Type
      • By Output Power
      • By End Use
    • Market Attractiveness Analysis
      • By Country
      • By Motor Type
      • By Output Power
      • By End Use
    • Key Takeaways
  17. Key Countries Analysis
    • USA
      • Pricing Analysis
      • Market Share Analysis, 2024
        • By Motor Type
        • By Output Power
        • By End Use
    • Canada
      • Pricing Analysis
      • Market Share Analysis, 2024
        • By Motor Type
        • By Output Power
        • By End Use
    • Brazil
      • Pricing Analysis
      • Market Share Analysis, 2024
        • By Motor Type
        • By Output Power
        • By End Use
    • Mexico
      • Pricing Analysis
      • Market Share Analysis, 2024
        • By Motor Type
        • By Output Power
        • By End Use
    • Argentina
      • Pricing Analysis
      • Market Share Analysis, 2024
        • By Motor Type
        • By Output Power
        • By End Use
  18. Market Structure Analysis
    • Competition Dashboard
    • Competition Benchmarking
    • Market Share Analysis of Top Players
      • By Regional
      • By Motor Type
      • By Output Power
      • By End Use
  19. Competition Analysis
    • Competition Deep Dive
      • ARC Systems, Inc.
        • Overview
        • Product Portfolio
        • Profitability by Market Segments (Product/Age /Sales Channel/Region)
        • Sales Footprint
        • Strategy Overview
          • Marketing Strategy
          • Product Strategy
          • Channel Strategy
      • Asmo Co., Ltd
        • Overview
        • Product Portfolio
        • Profitability by Market Segments (Product/Age /Sales Channel/Region)
        • Sales Footprint
        • Strategy Overview
          • Marketing Strategy
          • Product Strategy
          • Channel Strategy
      • ABB Group
        • Overview
        • Product Portfolio
        • Profitability by Market Segments (Product/Age /Sales Channel/Region)
        • Sales Footprint
        • Strategy Overview
          • Marketing Strategy
          • Product Strategy
          • Channel Strategy
      • Dr. Fritz Faulhaber GmbH
        • Overview
        • Product Portfolio
        • Profitability by Market Segments (Product/Age /Sales Channel/Region)
        • Sales Footprint
        • Strategy Overview
          • Marketing Strategy
          • Product Strategy
          • Channel Strategy
      • Brook Crompton UK Ltd
        • Overview
        • Product Portfolio
        • Profitability by Market Segments (Product/Age /Sales Channel/Region)
        • Sales Footprint
        • Strategy Overview
          • Marketing Strategy
          • Product Strategy
          • Channel Strategy
      • Rockwell Automation, Inc.
        • Overview
        • Product Portfolio
        • Profitability by Market Segments (Product/Age /Sales Channel/Region)
        • Sales Footprint
        • Strategy Overview
          • Marketing Strategy
          • Product Strategy
          • Channel Strategy
      • Regal Beloit Corporation
        • Overview
        • Product Portfolio
        • Profitability by Market Segments (Product/Age /Sales Channel/Region)
        • Sales Footprint
        • Strategy Overview
          • Marketing Strategy
          • Product Strategy
          • Channel Strategy
      • Emerson Electric
        • Overview
        • Product Portfolio
        • Profitability by Market Segments (Product/Age /Sales Channel/Region)
        • Sales Footprint
        • Strategy Overview
          • Marketing Strategy
          • Product Strategy
          • Channel Strategy
      • Siemens AG
        • Overview
        • Product Portfolio
        • Profitability by Market Segments (Product/Age /Sales Channel/Region)
        • Sales Footprint
        • Strategy Overview
          • Marketing Strategy
          • Product Strategy
          • Channel Strategy
      • Maxon Motors AG, among others.
        • Overview
        • Product Portfolio
        • Profitability by Market Segments (Product/Age /Sales Channel/Region)
        • Sales Footprint
        • Strategy Overview
          • Marketing Strategy
          • Product Strategy
          • Channel Strategy
  20. Assumptions & Acronyms Used
  21. Research Methodology

List of Tables

  • Table 1: Global Hoist and Value (USD Billion) Forecast by Region, 2020-2035
  • Table 2: Global Hoist and Volume (Thousand Units) Forecast by Region, 2020-2035
  • Table 3: Global Hoist and Value (USD Billion) Forecast by Motor Type, 2020-2035
  • Table 4: Global Hoist and Volume (Thousand Units) Forecast by Motor Type, 2020-2035
  • Table 5: Global Hoist and Value (USD Billion) Forecast by Output Power, 2020-2035
  • Table 6: Global Hoist and Volume (Thousand Units) Forecast by Output Power, 2020-2035
  • Table 7: Global Hoist and Value (USD Billion) Forecast by End Use, 2020-2035
  • Table 8: Global Hoist and Volume (Thousand Units) Forecast by End Use, 2020-2035
  • Table 9: North America Hoist and Value (USD Billion) Forecast by Country, 2020-2035
  • Table 10: North America Hoist and Volume (Thousand Units) Forecast by Country, 2020-2035
  • Table 11: North America Hoist and Value (USD Billion) Forecast by Motor Type, 2020-2035
  • Table 12: North America Hoist and Volume (Thousand Units) Forecast by Motor Type, 2020-2035
  • Table 13: North America Hoist and Value (USD Billion) Forecast by Output Power, 2020-2035
  • Table 14: North America Hoist and Volume (Thousand Units) Forecast by Output Power, 2020-2035
  • Table 15: North America Hoist and Value (USD Billion) Forecast by End Use, 2020-2035
  • Table 16: North America Hoist and Volume (Thousand Units) Forecast by End Use, 2020-2035
  • Table 17: Latin America Hoist and Value (USD Billion) Forecast by Country, 2020-2035
  • Table 18: Latin America Hoist and Volume (Thousand Units) Forecast by Country, 2020-2035
  • Table 19: Latin America Hoist and Value (USD Billion) Forecast by Motor Type, 2020-2035
  • Table 20: Latin America Hoist and Volume (Thousand Units) Forecast by Motor Type, 2020-2035
  • Table 21: Latin America Hoist and Value (USD Billion) Forecast by Output Power, 2020-2035
  • Table 22: Latin America Hoist and Volume (Thousand Units) Forecast by Output Power, 2020-2035
  • Table 23: Latin America Hoist and Value (USD Billion) Forecast by End Use, 2020-2035
  • Table 24: Latin America Hoist and Volume (Thousand Units) Forecast by End Use, 2020-2035
  • Table 25: Western Europe Hoist and Value (USD Billion) Forecast by Country, 2020-2035
  • Table 26: Western Europe Hoist and Volume (Thousand Units) Forecast by Country, 2020-2035
  • Table 27: Western Europe Hoist and Value (USD Billion) Forecast by Motor Type, 2020-2035
  • Table 28: Western Europe Hoist and Volume (Thousand Units) Forecast by Motor Type, 2020-2035
  • Table 29: Western Europe Hoist and Value (USD Billion) Forecast by Output Power, 2020-2035
  • Table 30: Western Europe Hoist and Volume (Thousand Units) Forecast by Output Power, 2020-2035
  • Table 31: Western Europe Hoist and Value (USD Billion) Forecast by End Use, 2020-2035
  • Table 32: Western Europe Hoist and Volume (Thousand Units) Forecast by End Use, 2020-2035
  • Table 33: Eastern Europe Hoist and Value (USD Billion) Forecast by Country, 2020-2035
  • Table 34: Eastern Europe Hoist and Volume (Thousand Units) Forecast by Country, 2020-2035
  • Table 35: Eastern Europe Hoist and Value (USD Billion) Forecast by Motor Type, 2020-2035
  • Table 36: Eastern Europe Hoist and Volume (Thousand Units) Forecast by Motor Type, 2020-2035
  • Table 37: Eastern Europe Hoist and Value (USD Billion) Forecast by Output Power, 2020-2035
  • Table 38: Eastern Europe Hoist and Volume (Thousand Units) Forecast by Output Power, 2020-2035
  • Table 39: Eastern Europe Hoist and Value (USD Billion) Forecast by End Use, 2020-2035
  • Table 40: Eastern Europe Hoist and Volume (Thousand Units) Forecast by End Use, 2020-2035
  • Table 41: East Asia Hoist and Value (USD Billion) Forecast by Country, 2020-2035
  • Table 42: East Asia Hoist and Volume (Thousand Units) Forecast by Country, 2020-2035
  • Table 43: East Asia Hoist and Value (USD Billion) Forecast by Motor Type, 2020-2035
  • Table 44: East Asia Hoist and Volume (Thousand Units) Forecast by Motor Type, 2020-2035
  • Table 45: East Asia Hoist and Value (USD Billion) Forecast by Output Power, 2020-2035
  • Table 46: East Asia Hoist and Volume (Thousand Units) Forecast by Output Power, 2020-2035
  • Table 47: East Asia Hoist and Value (USD Billion) Forecast by End Use, 2020-2035
  • Table 48: East Asia Hoist and Volume (Thousand Units) Forecast by End Use, 2020-2035
  • Table 49: South Asia & Pacific Hoist and Value (USD Billion) Forecast by Country, 2020-2035
  • Table 50: South Asia & Pacific Hoist and Volume (Thousand Units) Forecast by Country, 2020-2035
  • Table 51: South Asia & Pacific Hoist and Value (USD Billion) Forecast by Motor Type, 2020-2035
  • Table 52: South Asia & Pacific Hoist and Volume (Thousand Units) Forecast by Motor Type, 2020-2035
  • Table 53: South Asia & Pacific Hoist and Value (USD Billion) Forecast by Output Power, 2020-2035
  • Table 54: South Asia & Pacific Hoist and Volume (Thousand Units) Forecast by Output Power, 2020-2035
  • Table 55: South Asia & Pacific Hoist and Value (USD Billion) Forecast by End Use, 2020-2035
  • Table 56: South Asia & Pacific Hoist and Volume (Thousand Units) Forecast by End Use, 2020-2035
  • Table 57: Middle East and Africa Hoist and Value (USD Billion) Forecast by Country, 2020-2035
  • Table 58: Middle East and Africa Hoist and Volume (Thousand Units) Forecast by Country, 2020-2035
  • Table 59: Middle East and Africa Hoist and Value (USD Billion) Forecast by Motor Type, 2020-2035
  • Table 60: Middle East and Africa Hoist and Volume (Thousand Units) Forecast by Motor Type, 2020-2035
  • Table 61: Middle East and Africa Hoist and Value (USD Billion) Forecast by Output Power, 2020-2035
  • Table 62: Middle East and Africa Hoist and Volume (Thousand Units) Forecast by Output Power, 2020-2035
  • Table 63: Middle East and Africa Hoist and Value (USD Billion) Forecast by End Use, 2020-2035
  • Table 64: Middle East and Africa Hoist and Volume (Thousand Units) Forecast by End Use, 2020-2035

List of Figures

  • Figure 1: Global Hoist and Volume (Thousand Units) Forecast 2020-2035
  • Figure 2: Global Hoist and Pricing Analysis
  • Figure 3: Global Hoist and Value (USD Billion) Forecast 2020-2035
  • Figure 4: Global Hoist and Value Share and BPS Analysis by Motor Type, 2025 and 2035
  • Figure 5: Global Hoist and Y-o-Y Growth Comparison by Motor Type, 2025-2035
  • Figure 6: Global Hoist and Attractiveness Analysis by Motor Type
  • Figure 7: Global Hoist and Value Share and BPS Analysis by Output Power, 2025 and 2035
  • Figure 8: Global Hoist and Y-o-Y Growth Comparison by Output Power, 2025-2035
  • Figure 9: Global Hoist and Attractiveness Analysis by Output Power
  • Figure 10: Global Hoist and Value Share and BPS Analysis by End Use, 2025 and 2035
  • Figure 11: Global Hoist and Y-o-Y Growth Comparison by End Use, 2025-2035
  • Figure 12: Global Hoist and Attractiveness Analysis by End Use
  • Figure 13: Global Hoist and Value (USD Billion) Share and BPS Analysis by Region, 2025 and 2035
  • Figure 14: Global Hoist and Y-o-Y Growth Comparison by Region, 2025-2035
  • Figure 15: Global Hoist and Attractiveness Analysis by Region
  • Figure 16: North America Hoist and Incremental USD Opportunity, 2025-2035
  • Figure 17: Latin America Hoist and Incremental USD Opportunity, 2025-2035
  • Figure 18: Western Europe Hoist and Incremental USD Opportunity, 2025-2035
  • Figure 19: Eastern Europe Hoist and Incremental USD Opportunity, 2025-2035
  • Figure 20: East Asia Hoist and Incremental USD Opportunity, 2025-2035
  • Figure 21: South Asia & Pacific Hoist and Incremental USD Opportunity, 2025-2035
  • Figure 22: Middle East and Africa Hoist and Incremental USD Opportunity, 2025-2035
  • Figure 23: North America Hoist and Value Share and BPS Analysis by Country, 2025 and 2035
  • Figure 24: North America Hoist and Value Share and BPS Analysis by Motor Type, 2025 and 2035
  • Figure 25: North America Hoist and Y-o-Y Growth Comparison by Motor Type, 2025-2035
  • Figure 26: North America Hoist and Attractiveness Analysis by Motor Type
  • Figure 27: North America Hoist and Value Share and BPS Analysis by Output Power, 2025 and 2035
  • Figure 28: North America Hoist and Y-o-Y Growth Comparison by Output Power, 2025-2035
  • Figure 29: North America Hoist and Attractiveness Analysis by Output Power
  • Figure 30: North America Hoist and Value Share and BPS Analysis by End Use, 2025 and 2035
  • Figure 31: North America Hoist and Y-o-Y Growth Comparison by End Use, 2025-2035
  • Figure 32: North America Hoist and Attractiveness Analysis by End Use
  • Figure 33: Latin America Hoist and Value Share and BPS Analysis by Country, 2025 and 2035
  • Figure 34: Latin America Hoist and Value Share and BPS Analysis by Motor Type, 2025 and 2035
  • Figure 35: Latin America Hoist and Y-o-Y Growth Comparison by Motor Type, 2025-2035
  • Figure 36: Latin America Hoist and Attractiveness Analysis by Motor Type
  • Figure 37: Latin America Hoist and Value Share and BPS Analysis by Output Power, 2025 and 2035
  • Figure 38: Latin America Hoist and Y-o-Y Growth Comparison by Output Power, 2025-2035
  • Figure 39: Latin America Hoist and Attractiveness Analysis by Output Power
  • Figure 40: Latin America Hoist and Value Share and BPS Analysis by End Use, 2025 and 2035
  • Figure 41: Latin America Hoist and Y-o-Y Growth Comparison by End Use, 2025-2035
  • Figure 42: Latin America Hoist and Attractiveness Analysis by End Use
  • Figure 43: Western Europe Hoist and Value Share and BPS Analysis by Country, 2025 and 2035
  • Figure 44: Western Europe Hoist and Value Share and BPS Analysis by Motor Type, 2025 and 2035
  • Figure 45: Western Europe Hoist and Y-o-Y Growth Comparison by Motor Type, 2025-2035
  • Figure 46: Western Europe Hoist and Attractiveness Analysis by Motor Type
  • Figure 47: Western Europe Hoist and Value Share and BPS Analysis by Output Power, 2025 and 2035
  • Figure 48: Western Europe Hoist and Y-o-Y Growth Comparison by Output Power, 2025-2035
  • Figure 49: Western Europe Hoist and Attractiveness Analysis by Output Power
  • Figure 50: Western Europe Hoist and Value Share and BPS Analysis by End Use, 2025 and 2035
  • Figure 51: Western Europe Hoist and Y-o-Y Growth Comparison by End Use, 2025-2035
  • Figure 52: Western Europe Hoist and Attractiveness Analysis by End Use
  • Figure 53: Eastern Europe Hoist and Value Share and BPS Analysis by Country, 2025 and 2035
  • Figure 54: Eastern Europe Hoist and Value Share and BPS Analysis by Motor Type, 2025 and 2035
  • Figure 55: Eastern Europe Hoist and Y-o-Y Growth Comparison by Motor Type, 2025-2035
  • Figure 56: Eastern Europe Hoist and Attractiveness Analysis by Motor Type
  • Figure 57: Eastern Europe Hoist and Value Share and BPS Analysis by Output Power, 2025 and 2035
  • Figure 58: Eastern Europe Hoist and Y-o-Y Growth Comparison by Output Power, 2025-2035
  • Figure 59: Eastern Europe Hoist and Attractiveness Analysis by Output Power
  • Figure 60: Eastern Europe Hoist and Value Share and BPS Analysis by End Use, 2025 and 2035
  • Figure 61: Eastern Europe Hoist and Y-o-Y Growth Comparison by End Use, 2025-2035
  • Figure 62: Eastern Europe Hoist and Attractiveness Analysis by End Use
  • Figure 63: East Asia Hoist and Value Share and BPS Analysis by Country, 2025 and 2035
  • Figure 64: East Asia Hoist and Value Share and BPS Analysis by Motor Type, 2025 and 2035
  • Figure 65: East Asia Hoist and Y-o-Y Growth Comparison by Motor Type, 2025-2035
  • Figure 66: East Asia Hoist and Attractiveness Analysis by Motor Type
  • Figure 67: East Asia Hoist and Value Share and BPS Analysis by Output Power, 2025 and 2035
  • Figure 68: East Asia Hoist and Y-o-Y Growth Comparison by Output Power, 2025-2035
  • Figure 69: East Asia Hoist and Attractiveness Analysis by Output Power
  • Figure 70: East Asia Hoist and Value Share and BPS Analysis by End Use, 2025 and 2035
  • Figure 71: East Asia Hoist and Y-o-Y Growth Comparison by End Use, 2025-2035
  • Figure 72: East Asia Hoist and Attractiveness Analysis by End Use
  • Figure 73: South Asia & Pacific Hoist and Value Share and BPS Analysis by Country, 2025 and 2035
  • Figure 74: South Asia & Pacific Hoist and Value Share and BPS Analysis by Motor Type, 2025 and 2035
  • Figure 75: South Asia & Pacific Hoist and Y-o-Y Growth Comparison by Motor Type, 2025-2035
  • Figure 76: South Asia & Pacific Hoist and Attractiveness Analysis by Motor Type
  • Figure 77: South Asia & Pacific Hoist and Value Share and BPS Analysis by Output Power, 2025 and 2035
  • Figure 78: South Asia & Pacific Hoist and Y-o-Y Growth Comparison by Output Power, 2025-2035
  • Figure 79: South Asia & Pacific Hoist and Attractiveness Analysis by Output Power
  • Figure 80: South Asia & Pacific Hoist and Value Share and BPS Analysis by End Use, 2025 and 2035
  • Figure 81: South Asia & Pacific Hoist and Y-o-Y Growth Comparison by End Use, 2025-2035
  • Figure 82: South Asia & Pacific Hoist and Attractiveness Analysis by End Use
  • Figure 83: Middle East and Africa Hoist and Value Share and BPS Analysis by Country, 2025 and 2035
  • Figure 84: Middle East and Africa Hoist and Value Share and BPS Analysis by Motor Type, 2025 and 2035
  • Figure 85: Middle East and Africa Hoist and Y-o-Y Growth Comparison by Motor Type, 2025-2035
  • Figure 86: Middle East and Africa Hoist and Attractiveness Analysis by Motor Type
  • Figure 87: Middle East and Africa Hoist and Value Share and BPS Analysis by Output Power, 2025 and 2035
  • Figure 88: Middle East and Africa Hoist and Y-o-Y Growth Comparison by Output Power, 2025-2035
  • Figure 89: Middle East and Africa Hoist and Attractiveness Analysis by Output Power
  • Figure 90: Middle East and Africa Hoist and Value Share and BPS Analysis by End Use, 2025 and 2035
  • Figure 91: Middle East and Africa Hoist and Y-o-Y Growth Comparison by End Use, 2025-2035
  • Figure 92: Middle East and Africa Hoist and Attractiveness Analysis by End Use
  • Figure 93: Global Hoist and - Tier Structure Analysis
  • Figure 94: Global Hoist and - Company Share Analysis

Frequently Asked Questions

What is the projected size of the hoist and elevator motors market in 2025?

The hoist and elevator motors market is valued at USD 105.9 billion in 2025.

What is the outlook on hoist and elevator motors demand by 2035?

The market is forecasted to reach USD 156.8 billion by 2035, reflecting a CAGR of 4%.

Which segment leads the hoist and elevator motors market by motor type in 2025?

AC motors will lead the market by motor type with a 65% market share in 2025.

What is the top end-use sector for the hoist and elevator motors market in 2025?

The commercial segment will dominate the market with a 50% share in 2025.

Which country is projected to have the fastest-growing hoist and elevator motors market?

Germany is projected to grow at the fastest rate, with a CAGR of 4.1% from 2025 to 2035.

Explore Similar Insights

Future Market Insights

Hoist and Elevator Motors Market