

- Market Size (2026)
- USD 447.2 Mn
- Forecast (2036)
- USD 1181.2 Mn
- CAGR (2026 to 2036)
- 10.2%
How Big is the Edible Glitter Market in 2026?
The edible glitter market is estimated at USD 447.2 million in 2026.
The global edible glitter market was valued at USD 405.8 million in 2025 and is estimated to reach USD 447.2 million in 2026. The market is projected to reach USD 1,181.2 million by 2036, expanding at a compound annual growth rate (CAGR) of 10.2% between 2026 and 2036. Standard grade accounted for the largest share of the Product Type breakdown, contributing 44.0% of total revenue in 2026. Demand is shaped by the shift in food colours in the US. In April 2025, the US Food and Drug Administration (FDA) announced that it would work with industry to eliminate six remaining petroleum-based synthetic dyes from the food supply by the end of 2026[7], after revoking the authorisation of FD&C Red No. 3 with a January 15, 2027 reformulation deadline for foods[3]. In May 2025, it approved calcium phosphate, a white colour, for uses including doughnut sugar, white candy melts and sugar for coated candies[6]. Colour suppliers are benefiting from this transition. Sensient Technologies reported that revenue at its Color Group rose by 20.6% to USD 216.1 million in the second quarter of 2026[5]. FDA advice also distinguishes products made to be edible from decorative materials described only as non-toxic[1], which places composition information ahead of shade selection when glitter is applied directly to food.[8]
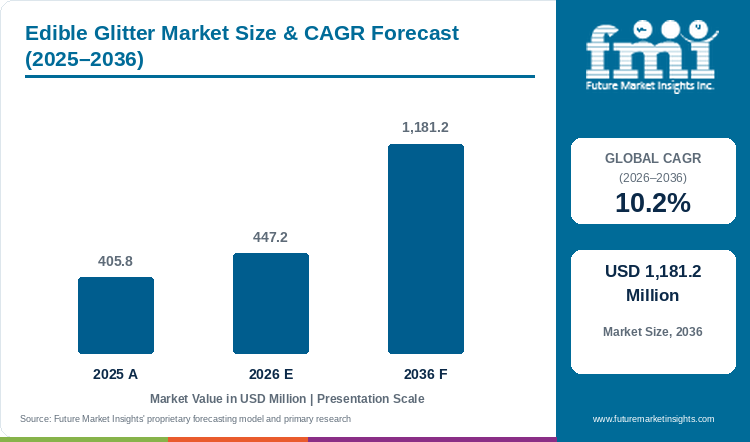
Table 1: Edible Glitter Market Size and Forecast (USD million), 2025 to 2036
| Market size and forecast | Value |
|---|---|
| 2025 market size | USD 405.8 million |
| Estimated market size in 2026 | USD 447.2 million |
| Projected market size by 2036 | USD 1,181.2 million |
| CAGR (2026-2036) | 10.2% |
| Added revenue, 2026 to 2036 | USD 734.0 million |
Key Market Trends & Insights
- By Product Type: The Standard grade segment accounted for the largest share of the Product Type breakdown in 2026, representing 44.0% of total market revenue.
- By Form: Powder / dry products held the leading market position with a share of 53.0% in 2026, with retained coverage, particle loss and moisture exposure affecting their use.
- By Application: Bread & rolls remained the largest application segment, accounting for 27.0% of the market in 2026.
Regional Highlights
- Fastest-growing country: The UAE is expected to record the highest growth rate among the eight profiled countries, with a projected CAGR of 11.5% between 2026 and 2036.
- Growth across other countries: Saudi Arabia is projected to expand at a CAGR of 11.2%, followed by the USA at 10.9% and South Korea at 10.6%. Japan is expected to register comparatively slower growth, with a CAGR of 9.3% during the forecast period.
Regulatory change is the main factor shaping the colours available for edible glitter. The FDA's April 2025 plan covers FD&C Green No. 3, Red No. 40, Yellow No. 5, Yellow No. 6, Blue No. 1 and Blue No. 2, and the agency also began the process of revoking the authorisations of Citrus Red No. 2 and Orange B[7]. The plan included fast-tracked review of natural alternatives such as calcium phosphate, Galdieria extract blue, gardenia blue and butterfly pea flower extract[7]. FDA advice distinguishes edible ingredients from materials that are described as non-toxic but are not intended for consumption[1], and European Union (EU) additive rules connect authorisation with listed uses and conditions[2]. The range of eligible food color systems therefore shapes the palette available in each market.
New colour approvals are widening the options for decorative products. In May 2025, the FDA approved Galdieria extract blue for uses including hard candy, soft candy and chewing gum, and expanded the approved uses of butterfly pea flower extract, petitioned by Sensient Colors, to ready-to-eat cereals, crackers and snack foods[6]. Calcium phosphate, a white colour, was approved for white candy melts, doughnut sugar and sugar for coated candies[6]. The FDA revoked the authorisation of FD&C Red No. 3 in January 2025 and set January 15, 2027 as the food reformulation deadline[3]. Where a glitter contains the affected colour, replacement can change dispersion, adhesion and coverage, so the new formulation needs assessment on the same icing, chocolate or other surface.
Colour suppliers are investing to meet demand. Sensient Technologies reported second-quarter 2026 revenue of USD 462.1 million, up 11.6%, with its Color Group growing by 20.6% compared with 4.9% for its Flavors & Extracts Group[5]. The company's spending on property, plant and equipment rose to USD 67.5 million in the first half of 2026 from USD 38.0 million a year earlier[5]. Certification-exempt colours remain subject to identity and purity specifications, as the FDA reminded manufacturers on February 5, 2026[4]. On the production side, the amount of glitter retained after packing determines the usable effect of a measured addition, as dust, clumping and transfer consume material without improving the final appearance.
Table 2: Supporting Industry Indicators for the Edible Glitter Market, 2025 to 2026, with a 2027 Food Reformulation Deadline
| Indicator | Data point | Why it matters | Source |
|---|---|---|---|
| Synthetic dye phase-out | In April 2025, FDA announced plans to eliminate six petroleum-based synthetic dyes from the food supply by the end of 2026. | Glitter shades based on these dyes need natural alternatives. | [7] |
| Further revocations | FDA began the process of revoking authorisations for Citrus Red No. 2 and Orange B. | The list of eligible synthetic colours is narrowing. | [7] |
| Red No. 3 deadline | FDA's January 2025 Red No. 3 revocation sets January 15, 2027 for food reformulation. | Affected glitter shades require replacement composition. | [3] |
| New white colour | In May 2025, FDA approved calcium phosphate for doughnut sugar, white candy melts and sugar for coated candies. | New approvals widen the options for bakery decoration. | [6] |
| New blue colours | FDA approved Galdieria extract blue and expanded the uses of butterfly pea flower extract in May 2025. | Natural blues are difficult to replace, so new approvals matter. | [6] |
| Colour supplier results | Sensient's Color Group revenue rose by 20.6% to USD 216.1 million in Q2 2026. | Strong colour demand reflects reformulation activity. | [5] |
| Colour supplier investment | Sensient's property, plant and equipment spending reached USD 67.5 million in H1 2026, against USD 38.0 million in H1 2025. | Investment supports supply of reformulated colours. | [5] |
| Edible-use distinction | FDA advice distinguishes edible decorative ingredients from products described only as non-toxic. | Direct food decoration requires a product intended for consumption. | [1] |
| EU additive conditions | EU additive authorisation is linked to specified food uses and conditions. | The permitted ingredient system limits the palette for each application. | [2] |
| Colour specifications | FDA reiterated identity and purity requirements for certification-exempt colours on February 5, 2026. | Documentation remains relevant alongside visual approval. | [4] |
Demand Intensity Analysis
A comparison of colour supplier results with market growth gives a measure of how quickly the colour base is changing. FMI estimates that the edible glitter market grew by approximately 10.2% between 2025 and 2026, while Sensient's Color Group revenue rose by 20.6% in the second quarter of 2026, about twice as fast[5]. The Color Group accounted for approximately 47.0% of Sensient's quarterly revenue. The difference reflects the wider reformulation of colours across foods, of which decorative products such as glitter form only a part.
The timing of regulation is also important. The end-2026 target for the six synthetic dyes is about two months away, and the Red No. 3 deadline of January 15, 2027 follows shortly after[3][7]. Bakeries using glitter based on these colours therefore have a short window to approve replacements, and the composition must first be appropriate for the intended food use under the relevant conditions[1][2].
Segment values show where this reformulation work is concentrated. Powder / dry represented USD 237.0 million in 2026, while Standard grade, a separate Product Type category, was worth USD 196.8 million. Direct to industrial bakeries accounted for USD 254.9 million by Sales Channel, and Bread & rolls represented approximately USD 120.7 million in the Application dimension. Industrial bakeries need agreed visual tolerances and dosing settings so that a replacement shade can be maintained across production runs.
FMI projects USD 734.0 million in additional market revenue between 2026 and 2036, with the market reaching approximately 2.6 times its 2026 value. Achieving that expansion depends on natural colour systems that can deliver bright, stable shades. The FDA's approval of calcium phosphate for white candy melts, doughnut sugar and coated candies shows that new options are reaching bakery and confectionery decoration[6].
Table 3: Demand Intensity Metrics for the Edible Glitter Market, 2025 to 2027
| Demand intensity metric | Value | Basis |
|---|---|---|
| FMI market growth, 2025 to 2026 | Approximately +10.2% | USD 405.8 million to USD 447.2 million. |
| Sensient Color Group revenue growth, Q2 2026 | +20.6% | USD 216.1 million against USD 179.3 million. |
| Color Group share of Sensient revenue, Q2 2026 | Approximately 47.0% | USD 216.1 million of USD 462.1 million. |
| Sensient property, plant and equipment spending, H1 2026 | Approximately +78.0% | USD 67.5 million against USD 38.0 million. |
| Synthetic dyes targeted for elimination | Six | FDA target of the end of 2026. |
| Red No. 3 food reformulation deadline | January 15, 2027 | FDA revocation of January 2025. |
| Powder / dry revenue, 2026 | USD 237.0 million | 53.0% of edible glitter revenue. |
| Direct to industrial bakeries revenue, 2026 | USD 254.9 million | Repeat application of approved finishes. |
| Added revenue, 2026 to 2036 | USD 734.0 million | FMI edible glitter market forecast. |
| Market expansion multiple | Approximately 2.6 times | Projected 2036 market value relative to 2026. |
Analyst Perspective
"With six synthetic dyes being phased out of the US food supply and the Red No. 3 deadline only months away, the suppliers that can match established glitter shades with approved natural colours will take the largest share of growth."
- Nandini Roy Choudhury, Principal Analyst at Future Market Insights
How is the edible glitter market segmented?
The edible glitter market is segmented by product type, form, application, claim and sales channel. Product Type describes the grade, while Form determines how the material can be placed and measured. Application identifies the bakery surface and the handling it will encounter, Claim adds requirements for the ingredient system, and Sales Channel affects how a customer obtains an agreed specification or a varied assortment.
Why does Standard grade anchor the Product Type mix?
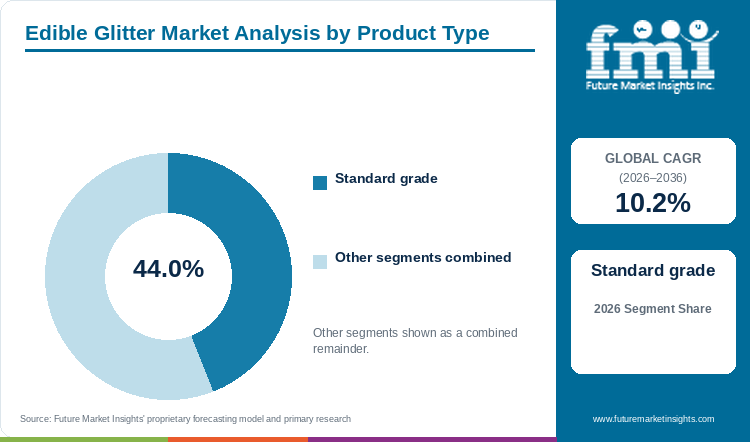
Standard grade holds 44.0% of Product Type revenue in 2026.
Standard grade generated approximately USD 196.8 million in 2026, as recurring decorative work needs a visual reference that can be reproduced when the next pack arrives. The reference should show the glitter on the selected food surface, since loose particles alone do not reveal the influence of the background. With synthetic dyes being phased out[7], many standard shades will need to be matched with natural colours, and the new version must recreate the approved effect without frequent adjustments by the decorating operator. Specialty grades may meet a more demanding design brief but require the same practical assessment.
- Standard grade holds 44.0% of Product Type revenue in 2026.
- The shade reference should use the same background surface as the finished product.
What makes Powder / dry the dominant Form?
Powder / dry accounts for 53.0% of Form revenue in 2026.
Dry formats generated approximately USD 237.0 million in 2026. Dry glitter is stored separately from the icing or other surface that receives it, and sprinkling, brushing and suitable applicators permit controlled placement. Fine particles can escape the target area, while moisture can cause uneven patches or clumping. Measuring retained coverage alongside material lost to equipment or cleanup gives the application a realistic cost, as a small nominal dose may conceal substantial waste if too little remains on the finished item.
- Powder / dry accounts for 53.0% of Form revenue in 2026.
- Retained coverage, dust loss and cleanup affect the cost of the dry application.
How do Bread & rolls lead the Application mix?
Bread & rolls lead Application with 27.0% of 2026 revenue.
With approximately USD 120.7 million in 2026, Bread & rolls hold the leading revenue allocation in the Application classification. The selected glitter must be intended for consumption and suitable for the destination, as FDA advice makes explicit[1]. Heat exposure creates different conditions from decoration applied after baking, while surface moisture and fat affect the visible result. Loose particles can also transfer to a wrapper after an acceptable initial appearance, so retained coverage through the intended handling sequence establishes whether the ingredient meets the finished-product specification.
- Bread & rolls lead Application with 27.0% of 2026 revenue.
- Wrapping can reveal transfer that was not visible immediately after decoration.
Why does Conventional remain the leading Claim?
Conventional represents 55.0% of Claim revenue in 2026.
Conventional formulations held approximately USD 246.0 million of revenue in 2026, and the choice of colours and carriers determines which decorative effects they can deliver. Each combination still has to satisfy the conditions for its intended food use, as the European Commission's framework links additive authorisation to listed uses and conditions[2]. Optional claims add a further specification rather than replacing that review. A changed carrier or pigment may remain suitable for the intended use yet alter the finish, so composition and appearance both need attention when the formula changes.
- Conventional represents 55.0% of Claim revenue in 2026.
- A new pigment or carrier may require another visual trial as well as ingredient review.
What supports Direct to industrial bakeries as the main Sales Channel?
Direct to industrial bakeries holds 57.0% of Sales Channel revenue in 2026.
Direct supply to industrial bakeries accounted for approximately USD 254.9 million in 2026. An industrial specification can connect the required shade with the applicator, surface and production schedule, and direct supply makes room to agree pack size, visual tolerances and documentation. At high volume, small changes in dosing produce visible differences across a run, so a supplier-prepared sample is only a starting reference. Direct relationships are most relevant where one approved finish is repeated and colour changes, such as those required by the FDA's dye phase-out[7], need to be managed.
- Direct to industrial bakeries holds 57.0% of Sales Channel revenue in 2026.
- Agreed visual tolerances need a corresponding method for applying the ingredient.
What are the drivers, restraints and opportunities in the edible glitter market?
A small decorative addition can create a distinct product finish, but ingredient identity limits the available visual palette, making documented formulations useful in helping customers adopt decorative ranges.
A small decorative addition can create a distinct product finish
Localised glitter finishes provide a means of varying bakery presentation while retaining the underlying recipe, and occasion-based decoration uses this separation between the base product and its accent. The addition has to remain modest enough to be practical and visible enough to create the intended effect. Adhesion is central, as sparkle that transfers to the container does little for the product on display. Development with bakery coatings can establish which combinations retain the particles through handling, and new white and blue colours approved by the FDA in May 2025 widen the shades available for such finishes[6].
Ingredient identity limits the available visual palette
The available visual palette is bounded by the ingredients suitable for the intended food use. FDA advice distinguishes edible decorative products from non-edible materials, and EU rules tie additives to authorised conditions[1][2]. In the US, six synthetic dyes are targeted for elimination by the end of 2026 and the Red No. 3 food deadline falls on January 15, 2027[3][7]. Replacing an affected pigment does not automatically reproduce its behaviour, as shade, dispersion and adhesion may all need another trial.
Documented formulations can make decorative ranges easier to adopt
Shade-specific composition and application information make a glitter assortment easier to transfer into approved bakery specifications. Colour suppliers are expanding their capacity, with Sensient's spending on property, plant and equipment rising to USD 67.5 million in the first half of 2026[5]. The FDA reminded manufacturers in February 2026 that colours exempt from batch certification still have to meet identity and purity specifications[4]. Work with alternative food color systems may expand the options for glitter producers, provided each result performs on the intended food with consistent shade and manageable particle distribution.
Which country CAGRs are profiled in the edible glitter market?
Table 4: Country growth outlook for the edible glitter market
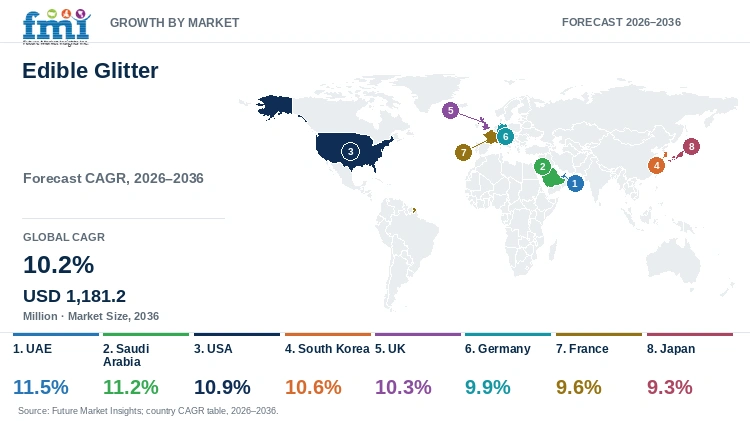
| Country | CAGR |
|---|---|
| UAE | 11.5% |
| Saudi Arabia | 11.2% |
| USA | 10.9% |
| South Korea | 10.6% |
| UK | 10.3% |
| Germany | 9.9% |
| France | 9.6% |
| Japan | 9.3% |
UAE
- The UAE is the fastest-growing market among the profiled countries, with a projected CAGR of 11.5% from 2026 to 2036. Packing and delivery are part of the decoration test for UAE bakeries supplying several outlets, as glitter that remains visible on icing in the production room may transfer to the container during handling. A limited selection of repeatable shades can be easier to operate than a wide assortment, and the finish needs to arrive at the point of sale with the intended sparkle.
Saudi Arabia
- Saudi Arabia is forecast to grow at a CAGR of 11.2% from 2026 to 2036. In Saudi sweet-bakery decoration, visual references connect the application dose with the required finish, as too little material may make the effect hard to see, while excess adds cleanup and transfer loss. Testing coverage across an entire run shows whether the reference is achievable beyond the first decorated units, with storage and handling before sale included in the same assessment.
USA
- The USA market is forecast to grow at a CAGR of 10.9% from 2026 to 2036, with the FDA's dye phase-out reshaping the colours used in glitter. Six synthetic dyes are targeted for elimination by the end of 2026, and FD&C Red No. 3 must be removed from foods by January 15, 2027[3][7]. Confirmation of edible use precedes the surface trial[1]. New approvals, including calcium phosphate for doughnut sugar and white candy melts[6], give producers more options, while Sensient's 20.6% Color Group growth in Q2 2026 shows the scale of reformulation demand[5].
South Korea
- With a projected CAGR of 10.6% from 2026 to 2036, South Korea ranks fourth among the profiled countries. Particle size can distinguish a fine shimmer from a more visible sparkle on small bakery portions, where an uneven application is readily apparent. The decorated product also needs to retain its particles during handling rather than transfer them to the package. Development quantities and clear instructions help establish a workable procedure, so neat presentation depends less on the technique of the person decorating each batch.
UK
- Occasional decorating work and a recurring UK bakery programme create different replenishment needs. The UK market is projected to grow at a CAGR of 10.3% from 2026 to 2036. Small quantities may suit one, while the other requires reliable access to the same shade over successive batches. Both need a finish that behaves predictably on the bakery's usual icing as it dries, and storage between uses has to keep the material free-flowing.
Germany
- Germany is projected to grow at a CAGR of 9.9% from 2026 to 2036. Ingredient eligibility narrows the choice of glitter for German customers serving the EU market, as additive authorisations and use conditions have to be reviewed for each formulation[2]. Within that range, controlled application trials can compare the finish retained after wrapping and the settings required for each shade. Maintaining the chosen effect across batches reduces adjustments and avoidable material loss.
France
- France is projected to grow at a CAGR of 9.6% from 2026 to 2036. Localised shimmer in French pastry decoration places particular importance on controlled placement, as the selected shade needs to remain within the intended element. EU authorisation conditions remain part of ingredient selection[2], while trials on the intended surface show how much material is needed for the accent. Application guidance is most useful when it helps repeat this effect across service preparation and larger batches.
Japan
- Japan is expected to register the slowest growth among the profiled countries, with a forecast CAGR of 9.3% from 2026 to 2036. The background beneath a glitter accent changes its appearance on compact Japanese bakery products, and a dose that works on pale icing may need adjustment on a darker surface. Wrapping adds a further check for particle transfer and uneven coverage. Defining the effect together with the chosen applicator gives production a practical reference where each portion offers little room for variation.
Who are the notable companies in the edible glitter market?
Bakell; The Sugar Art; Roxy & Rich; Sugarflair; Confectionery Arts International
Bakell, The Sugar Art, Roxy & Rich, Sugarflair and Confectionery Arts International offer named edible glitter, sparkle-dust or flake products, with ranges that differ in particle and application format. Suitability is determined at the level of the individual product and intended destination rather than assumed for every shade sold by a brand. Upstream, colour suppliers such as Sensient, whose Color Group revenue reached USD 216.1 million in the second quarter of 2026[5], provide the natural colours that glitter producers need for reformulation.
The receiving surface connects these products with confectionery decoration, as it affects both adhesion and the apparent colour. Describing the intended finish, composition and method of application makes a supplier's range easier to assess than colour assortment alone.
Competitive Benchmarking: Edible Glitter Market
Table 5: Company capabilities in the edible glitter market
| Company | Product capability | Application emphasis |
|---|---|---|
| Bakell | Tinker Dust edible glitter | Bakery and confectionery decoration |
| The Sugar Art | DiamonDust | Cakes, cookies and other decorated products |
| Roxy & Rich | Hybrid Sparkle Dust | Dry or painted decorative effects |
| Sugarflair | Edible Glitter Dust | Sugarcraft and bakery finishing |
| Confectionery Arts International | Edible glitter flakes | Cakes, cookies, pies and pastry |
Key Developments in the Edible Glitter Market
- In January 2025, the FDA revoked the food authorisation of FD&C Red No. 3, setting January 15, 2027 as the deadline for manufacturers to reformulate foods[3].
- In April 2025, the FDA announced plans to eliminate six petroleum-based synthetic dyes from the food supply by the end of 2026 and to revoke the authorisations of Citrus Red No. 2 and Orange B[7].
- In May 2025, the FDA approved Galdieria extract blue and calcium phosphate and expanded the uses of butterfly pea flower extract[6].
- In July 2026, Sensient Technologies reported a 20.6% increase in second-quarter Color Group revenue to USD 216.1 million[5].
- In February 2026, the FDA reminded manufacturers that colours exempt from batch certification remain subject to identity and purity specifications[4].
Key Players in the Edible Glitter Market
- Bakell
- The Sugar Art
- Roxy & Rich
- Sugarflair
- Confectionery Arts International
Edible Glitter Market - Report Scope
Table 6: Report scope for the edible glitter market
| Coverage field | Report scope |
|---|---|
| Market breakdown | Product Type; Form; Application; Claim; Sales Channel |
| Quantitative Units | USD Million |
| Market Definition | Revenue from edible glitter ingredients sold for food use within the listed segmentation categories. Excludes revenue from finished bakery goods, non-edible decorative dust, ordinary glazes, chocolate sprinkles, fruit preparations and other substitute or adjacent finishing inputs; mixed bundles count only the separable qualifying glitter-ingredient component. |
| Regions Covered | North America; Latin America; Western Europe; Eastern Europe; East Asia; South Asia and Pacific; Middle East and Africa |
| Countries Covered | UAE; Saudi Arabia; USA; South Korea; UK; Germany; France; Japan |
| Key Companies Profiled | Bakell; The Sugar Art; Roxy & Rich; Sugarflair; Confectionery Arts International |
| Forecast Period | 2026 to 2036 |
| Approach | Market assessment supported by official technical and regulatory publications, company product information and country operating conditions. |
Edible Glitter Market - Research Methodology
Table 7: Research approach for the edible glitter market
| Method | Approach |
|---|---|
| Market definition | The assessment covers edible glitter preparations sold for decorative use within the stated bakery categories, with non-edible craft materials and unrelated finishing ingredients excluded. |
| Desk research | Government and regulatory publications, technical literature and official product information establish the application and supply context. |
| Commercial assessment | The review considers ingredient eligibility, shade and particle consistency, surface adhesion, application losses and the condition of the decoration after packing. |
| Comparability | Market values, segment allocations and country growth rates use consistent units and the stated 2026 to 2036 forecast period. Company comparisons describe product roles and purchasing relevance. |
Edible Glitter Market by Segments
Product Type
- Standard grade
- Premium / specialty grade
- Organic certified
- Clean label grade
Form
- Powder / dry
- Liquid
- Paste / semi-solid
- Granules / pieces
Application
- Bread & rolls
- Cakes & muffins
- Biscuits & cookies
- Viennoiserie & pastry
- Other bakery & snacks
Claim
- Conventional
- Clean label
- Organic
- Non-GMO / identity preserved
Sales Channel
- Direct to industrial bakeries
- Ingredient distributors
- Foodservice & artisan supply
- Online B2B
Edible Glitter Market by Region
- North America
- United States
- Canada
- Latin America
- Brazil
- Mexico
- Argentina
- Chile
- Western Europe
- Germany
- France
- United Kingdom
- Italy
- Spain
- Benelux
- Nordics
- Eastern Europe
- Poland
- Czech Republic
- Romania
- Hungary
- East Asia
- China
- Japan
- South Korea
- South Asia and Pacific
- India
- ASEAN
- Australia and New Zealand
- Middle East and Africa
- GCC Countries
- South Africa
- Türkiye
- Israel
Research Sources and Bibliography
- [1] U.S. Food and Drug Administration. (n.d.). FDA Advises Home and Commercial Bakers to Avoid Use of Non-Edible Food Decorative Products.
- [2] European Commission. (n.d.). EU rules on food additives.
- [3] U.S. Food and Drug Administration. (2025, January 15). FD&C Red No. 3.
- [4] U.S. Food and Drug Administration. (2026, February 5). FDA reminds manufacturers of color additives exempt from certification to comply with identity and purity requirements.
- [5] Sensient Technologies Corporation. (2026, July 24). Second quarter 2026 results (Form 8-K, Exhibit 99.1).
- [6] U.S. Food and Drug Administration. (2025, May 9). FDA approves three food colors from natural sources.
- [7] U.S. Food and Drug Administration. (2025, April 22). HHS, FDA to phase out petroleum-based synthetic dyes in nation's food supply.
- [8] Viveiros, B., et al. (2021, October 29). Centers for Disease Control and Prevention. Cake decorating luster dust associated with toxic metal poisonings
Future Market Insights. (2026). Edible Glitter Market: Global Industry Analysis and Opportunity Assessment 2036.
This Report Answers
- How large is the edible glitter market in 2026, and what is the 2036 outlook?
- Which bakery purchasing conditions drive spending on edible reflective decoration?
- Why does Standard grade lead the Product Type segmentation?
- Why does Powder / dry hold the largest Form share?
- How do the eight profiled country CAGRs differ?
- Which suppliers offer edible glitter and sparkle products for food decoration?
Frequently Asked Questions
How big is the edible glitter market in 2026, and what is projected for 2036?
The market is valued at USD 447.2 million in 2026 and is expected to reach USD 1,181.2 million by 2036.
What CAGR is expected for the edible glitter market from 2026 to 2036?
The market is forecast to grow at a CAGR of 10.2% from 2026 to 2036.
Which Product Type segment leads the edible glitter market in 2026?
Standard grade leads Product Type with a 44.0% share in 2026.
Which Form accounts for the largest share in 2026?
Powder / dry leads Form with a 53.0% share in 2026.
Which profiled countries have the fastest growth outlook?
The UAE leads at 11.5%, followed by Saudi Arabia at 11.2% and the USA at 10.9% from 2026 to 2036.
Which companies participate in the edible glitter market?
The report profiles Bakell, The Sugar Art, Roxy & Rich, Sugarflair and Confectionery Arts International, which offer named edible glitter, sparkle-dust or glitter-flake ranges.
Preview the report firsthand - request a free sample
Get SampleGet the brochure for pricing and purchase details.
Get PDFTable of Content
- Key Takeaways
- Market Size and CAGR
- Top Growth Driver
- Fastest Growing Segment
- Leading Region
- Key Companies
- Emerging Opportunities
- Executive Summary
- Global Market Outlook
- Demand-side Trends
- Supply-side Trends
- Technology Roadmap Analysis
- Analysis and Recommendations
- Analyst Perspective (What is happening? Why now? What should investors know?)
- Key Questions Answered
- How large is the market?
- What is the CAGR?
- What are key trends?
- Which region dominates?
- Who are the leaders?
- Market Overview
- Market Coverage / Taxonomy
- Market Definition / Scope / Limitations
- Research Methodology
- Chapter Orientation
- Analytical Lens and Working Hypotheses
- Market Structure, Signals, and Trend Drivers
- Benchmarking and Cross-market Comparability
- Market Sizing, Forecasting, and Opportunity Mapping
- Research Design and Evidence Framework
- Desk Research Programme (Secondary Evidence)
- Expert Input and Fieldwork (Primary Evidence)
- Tooling, Models, and Reference Databases
- Data Engineering and Model Build
- Quality Assurance and Audit Trail
- Market Background
- Market Dynamics (Drivers, Restraints, Opportunity, Trends)
- Scenario Forecast (Optimistic, Likely, Conservative)
- Impact Analysis
- AI Impact
- Sustainability Impact
- Regulatory Impact
- Technology Impact
- Consumer / Buyer Analysis
- Purchase Drivers
- Adoption Barriers
- Buyer Journey
- Opportunity Map Analysis
- Product Life Cycle Analysis
- Supply Chain Analysis
- Investment Feasibility Matrix
- Value Chain Analysis
- PESTLE and Porter's Analysis
- Regulatory Landscape
- Regional Parent Market Outlook
- Production and Consumption Statistics
- Import and Export Statistics
- Global Market Analysis and Forecast, 2021 to 2036
- Historical Market Size Value (USD Million) Analysis, 2021 to 2025
- Current and Future Market Size Value (USD Million) Projections, 2026 to 2036
- Y-o-Y Growth Trend Analysis
- Absolute $ Opportunity Analysis
- Global Market Pricing Analysis, 2021 to 2036
- Global Market Analysis and Forecast, By Product Type, 2021 to 2036
- Introduction / Key Findings
- Historical Market Size Value (USD Million) Analysis By Product Type, 2021 to 2025
- Current and Future Market Size Value (USD Million) Analysis and Forecast By Product Type, 2026 to 2036
- Standard grade
- Premium / specialty grade
- Organic certified
- Clean label grade
- Y-o-Y Growth Trend Analysis By Product Type, 2021 to 2025
- Absolute $ Opportunity Analysis By Product Type, 2026 to 2036
- Global Market Analysis and Forecast, By Form, 2021 to 2036
- Introduction / Key Findings
- Historical Market Size Value (USD Million) Analysis By Form, 2021 to 2025
- Current and Future Market Size Value (USD Million) Analysis and Forecast By Form, 2026 to 2036
- Powder / dry
- Liquid
- Paste / semi-solid
- Granules / pieces
- Y-o-Y Growth Trend Analysis By Form, 2021 to 2025
- Absolute $ Opportunity Analysis By Form, 2026 to 2036
- Global Market Analysis and Forecast, By Application, 2021 to 2036
- Introduction / Key Findings
- Historical Market Size Value (USD Million) Analysis By Application, 2021 to 2025
- Current and Future Market Size Value (USD Million) Analysis and Forecast By Application, 2026 to 2036
- Bread & rolls
- Cakes & muffins
- Biscuits & cookies
- Viennoiserie & pastry
- Other bakery & snacks
- Y-o-Y Growth Trend Analysis By Application, 2021 to 2025
- Absolute $ Opportunity Analysis By Application, 2026 to 2036
- Global Market Analysis and Forecast, By Claim, 2021 to 2036
- Introduction / Key Findings
- Historical Market Size Value (USD Million) Analysis By Claim, 2021 to 2025
- Current and Future Market Size Value (USD Million) Analysis and Forecast By Claim, 2026 to 2036
- Conventional
- Clean label
- Organic
- Non-GMO / identity preserved
- Y-o-Y Growth Trend Analysis By Claim, 2021 to 2025
- Absolute $ Opportunity Analysis By Claim, 2026 to 2036
- Global Market Analysis and Forecast, By Sales Channel, 2021 to 2036
- Introduction / Key Findings
- Historical Market Size Value (USD Million) Analysis By Sales Channel, 2021 to 2025
- Current and Future Market Size Value (USD Million) Analysis and Forecast By Sales Channel, 2026 to 2036
- Direct to industrial bakeries
- Ingredient distributors
- Foodservice & artisan supply
- Online B2B
- Y-o-Y Growth Trend Analysis By Sales Channel, 2021 to 2025
- Absolute $ Opportunity Analysis By Sales Channel, 2026 to 2036
- Global Market Analysis and Forecast, By Region, 2021 to 2036
- Introduction
- Historical Market Size Value (USD Million) Analysis By Region, 2021 to 2025
- Current Market Size Value (USD Million) Analysis and Forecast By Region, 2026 to 2036
- North America
- Latin America
- Western Europe
- Eastern Europe
- East Asia
- South Asia and Pacific
- Middle East and Africa
- Market Attractiveness Analysis By Region
- North America Market Analysis and Forecast, By Country, 2021 to 2036
- Historical Market Size Value (USD Million) Trend Analysis By Market Taxonomy, 2021 to 2025
- Market Size Value (USD Million) Forecast By Market Taxonomy, 2026 to 2036
- By Country
- United States
- Canada
- By Product Type
- By Form
- By Application
- By Claim
- By Sales Channel
- By Country
- Market Attractiveness Analysis
- By Country
- By Product Type
- By Form
- By Application
- By Claim
- By Sales Channel
- Key Takeaways
- Latin America Market Analysis and Forecast, By Country
- Historical Market Size Value (USD Million) Trend Analysis By Market Taxonomy, 2021 to 2025
- Market Size Value (USD Million) Forecast By Market Taxonomy, 2026 to 2036
- By Country
- Brazil
- Mexico
- Argentina
- Chile
- By Product Type
- By Form
- By Application
- By Claim
- By Sales Channel
- By Country
- Market Attractiveness Analysis
- By Country
- By Product Type
- By Form
- By Application
- By Claim
- By Sales Channel
- Key Takeaways
- Western Europe Market Analysis and Forecast, By Country
- Historical Market Size Value (USD Million) Trend Analysis By Market Taxonomy, 2021 to 2025
- Market Size Value (USD Million) Forecast By Market Taxonomy, 2026 to 2036
- By Country
- Germany
- France
- United Kingdom
- Italy
- Spain
- Benelux
- Nordics
- By Product Type
- By Form
- By Application
- By Claim
- By Sales Channel
- By Country
- Market Attractiveness Analysis
- By Country
- By Product Type
- By Form
- By Application
- By Claim
- By Sales Channel
- Key Takeaways
- Eastern Europe Market Analysis and Forecast, By Country
- Historical Market Size Value (USD Million) Trend Analysis By Market Taxonomy, 2021 to 2025
- Market Size Value (USD Million) Forecast By Market Taxonomy, 2026 to 2036
- By Country
- Poland
- Czech Republic
- Romania
- Hungary
- By Product Type
- By Form
- By Application
- By Claim
- By Sales Channel
- By Country
- Market Attractiveness Analysis
- By Country
- By Product Type
- By Form
- By Application
- By Claim
- By Sales Channel
- Key Takeaways
- East Asia Market Analysis and Forecast, By Country
- Historical Market Size Value (USD Million) Trend Analysis By Market Taxonomy, 2021 to 2025
- Market Size Value (USD Million) Forecast By Market Taxonomy, 2026 to 2036
- By Country
- China
- Japan
- South Korea
- By Product Type
- By Form
- By Application
- By Claim
- By Sales Channel
- By Country
- Market Attractiveness Analysis
- By Country
- By Product Type
- By Form
- By Application
- By Claim
- By Sales Channel
- Key Takeaways
- South Asia and Pacific Market Analysis and Forecast, By Country
- Historical Market Size Value (USD Million) Trend Analysis By Market Taxonomy, 2021 to 2025
- Market Size Value (USD Million) Forecast By Market Taxonomy, 2026 to 2036
- By Country
- India
- ASEAN
- Australia and New Zealand
- By Product Type
- By Form
- By Application
- By Claim
- By Sales Channel
- By Country
- Market Attractiveness Analysis
- By Country
- By Product Type
- By Form
- By Application
- By Claim
- By Sales Channel
- Key Takeaways
- Middle East and Africa Market Analysis and Forecast, By Country
- Historical Market Size Value (USD Million) Trend Analysis By Market Taxonomy, 2021 to 2025
- Market Size Value (USD Million) Forecast By Market Taxonomy, 2026 to 2036
- By Country
- GCC Countries
- South Africa
- Türkiye
- Israel
- By Product Type
- By Form
- By Application
- By Claim
- By Sales Channel
- By Country
- Market Attractiveness Analysis
- By Country
- By Product Type
- By Form
- By Application
- By Claim
- By Sales Channel
- Key Takeaways
- Key Countries Market Analysis
- United States
- Pricing Analysis
- Market Share Analysis, 2025
- By Product Type
- By Form
- By Application
- By Claim
- By Sales Channel
- Canada
- Pricing Analysis
- Market Share Analysis, 2025
- By Product Type
- By Form
- By Application
- By Claim
- By Sales Channel
- Mexico
- Pricing Analysis
- Market Share Analysis, 2025
- By Product Type
- By Form
- By Application
- By Claim
- By Sales Channel
- Brazil
- Pricing Analysis
- Market Share Analysis, 2025
- By Product Type
- By Form
- By Application
- By Claim
- By Sales Channel
- Chile
- Pricing Analysis
- Market Share Analysis, 2025
- By Product Type
- By Form
- By Application
- By Claim
- By Sales Channel
- Germany
- Pricing Analysis
- Market Share Analysis, 2025
- By Product Type
- By Form
- By Application
- By Claim
- By Sales Channel
- United Kingdom
- Pricing Analysis
- Market Share Analysis, 2025
- By Product Type
- By Form
- By Application
- By Claim
- By Sales Channel
- Italy
- Pricing Analysis
- Market Share Analysis, 2025
- By Product Type
- By Form
- By Application
- By Claim
- By Sales Channel
- Spain
- Pricing Analysis
- Market Share Analysis, 2025
- By Product Type
- By Form
- By Application
- By Claim
- By Sales Channel
- France
- Pricing Analysis
- Market Share Analysis, 2025
- By Product Type
- By Form
- By Application
- By Claim
- By Sales Channel
- India
- Pricing Analysis
- Market Share Analysis, 2025
- By Product Type
- By Form
- By Application
- By Claim
- By Sales Channel
- ASEAN
- Pricing Analysis
- Market Share Analysis, 2025
- By Product Type
- By Form
- By Application
- By Claim
- By Sales Channel
- Australia and New Zealand
- Pricing Analysis
- Market Share Analysis, 2025
- By Product Type
- By Form
- By Application
- By Claim
- By Sales Channel
- China
- Pricing Analysis
- Market Share Analysis, 2025
- By Product Type
- By Form
- By Application
- By Claim
- By Sales Channel
- Japan
- Pricing Analysis
- Market Share Analysis, 2025
- By Product Type
- By Form
- By Application
- By Claim
- By Sales Channel
- South Korea
- Pricing Analysis
- Market Share Analysis, 2025
- By Product Type
- By Form
- By Application
- By Claim
- By Sales Channel
- Poland
- Pricing Analysis
- Market Share Analysis, 2025
- By Product Type
- By Form
- By Application
- By Claim
- By Sales Channel
- Hungary
- Pricing Analysis
- Market Share Analysis, 2025
- By Product Type
- By Form
- By Application
- By Claim
- By Sales Channel
- Türkiye
- Pricing Analysis
- Market Share Analysis, 2025
- By Product Type
- By Form
- By Application
- By Claim
- By Sales Channel
- South Africa
- Pricing Analysis
- Market Share Analysis, 2025
- By Product Type
- By Form
- By Application
- By Claim
- By Sales Channel
- UAE
- Pricing Analysis
- Market Share Analysis, 2025
- By Product Type
- By Form
- By Application
- By Claim
- By Sales Channel
- Saudi Arabia
- Pricing Analysis
- Market Share Analysis, 2025
- By Product Type
- By Form
- By Application
- By Claim
- By Sales Channel
- United States
- Market Structure Analysis
- Competition Dashboard
- Competition Benchmarking
- Market Share Analysis of Top Players
- By Regional
- By Product Type
- By Form
- By Application
- By Claim
- By Sales Channel
- Emerging Startups
- Innovation Benchmarking
- Competition Analysis
- Competition Deep Dive
- Bakell
- Overview
- Product Portfolio
- Profitability by Market Segments
- Sales Footprint
- Strategy Overview
- Marketing Strategy
- Product Strategy
- Channel Strategy
- The Sugar Art
- Roxy & Rich
- Sugarflair
- Confectionery Arts International
- Bakell
- Case Studies
- Success Stories
- Recent Developments
- Competition Deep Dive
- Assumptions & Acronyms Used


