

- Market Size (2026)
- USD 1860.6 Mn
- Forecast (2036)
- USD 3592.2 Mn
- CAGR (2026 to 2036)
- 6.8%
How big is the Electrical Connector Inserts Market in 2026?
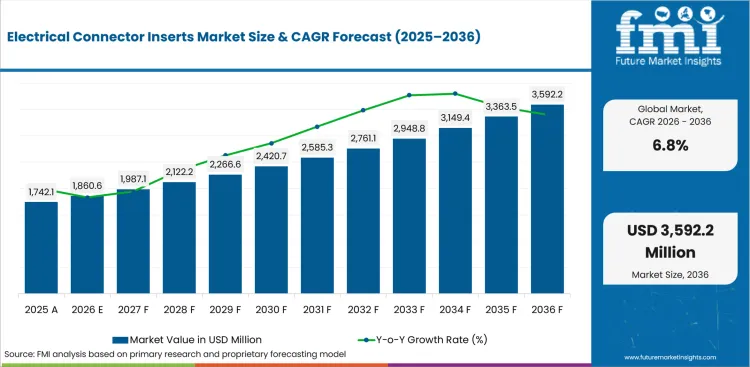
USD 1,860.6 million in 2026 and USD 3,592.2 million by 2036 at a 6.8% CAGR.
Demand for electrical connector inserts is projected to rise at a CAGR of 6.8% by 2036, driving industry valuation from USD 1,860.6 million in 2026 to USD 3,592.2 million during the forecast period. Vehicle electrical architectures are carrying more control units and shielded connection points in automotive platforms during model redesign. Tighter packaging and qualification pressure are expected to support spending across OEM and connector manufacturer accounts. For instance, OICA reported global vehicle production of 96.4 million units in 2025, which keeps insert demand tied to certified connector families used beside automotive data connectors.
United States and Germany accounts are expected to prioritize validation records and connector-family continuity. China and India accounts are likely to focus on local tooling access and faster EV supply response. NIST reported a Manufacturing USA network of 17 public-private institutes in March 2026 across the national manufacturing network. The measurement focus supports approval discipline for insert suppliers serving wire to board connector demand.
Summary of the Electrical Connector Inserts Market
| Market Signal | Commercial Impact |
|---|---|
| Demand and Growth Drivers | Connector insert spending is expected to follow automotive electronics complexity and stricter qualification routines. Documentation needs are projected to make OEM platform teams test insert materials before recurring use.
|
| Product and Segment View | Direct OEM, automotive and automotive electronics are estimated to represent the main share positions in 2026. PBT inserts and board-to-board formats are forecast to define material and connector-type screening.
|
| Geography and Growth Outlook | India and China are projected to form the higher-growth tier due to production scale and supplier localization. Germany, Japan and the United States are expected to expand under qualification-led adoption cycles.
|
| Competitive Landscape | Competition is moderately concentrated around global connector portfolios and harsh-environment capabilities. sourcing screens are expected to center on tolerance proof, service reach and application fit.
|
| Analyst Perspective | For electrical connector inserts, qualification decisions are often driven by confidence in long-term dimensional stability and connection reliability. Suppliers that can provide timely technical documentation and engineering assistance throughout the product lifecycle are likely to maintain competitive edge.
|
Source: FMI's proprietary forecasting model and primary research
How is the electrical connector inserts market segmented?
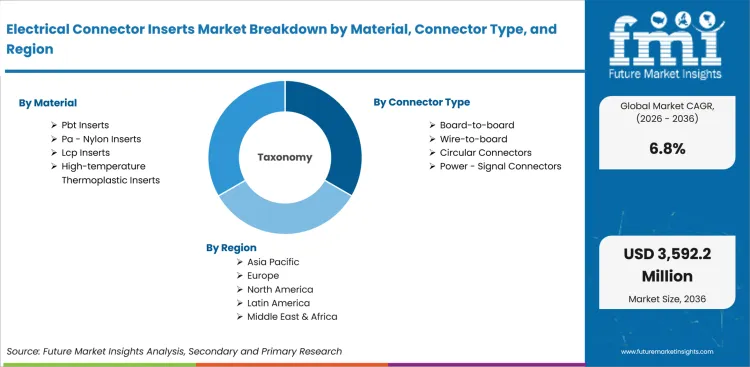
The electrical connector inserts industry is segmented by material, connector type, application, end use, sales channel and region.
The electrical connector inserts market is segmented by material, connector type, application, end use, sales channel and region. By material, the market covers PBT inserts, PA or nylon inserts, LCP inserts and high-temperature thermoplastic inserts. By connector type, it covers board-to-board, wire-to-board, circular connectors and power or signal connectors. By application, it covers automotive electronics, industrial controls, telecom or data and aerospace or defense. By end use, it covers automotive, electronics, industrial equipment and aerospace and defense. By sales channel, it covers direct OEM, connector manufacturers and distributors. Regional coverage includes North America, Latin America, Europe, East Asia, South Asia and Pacific and Middle East and Africa.
How does direct OEM shape demand within the sales channel category?
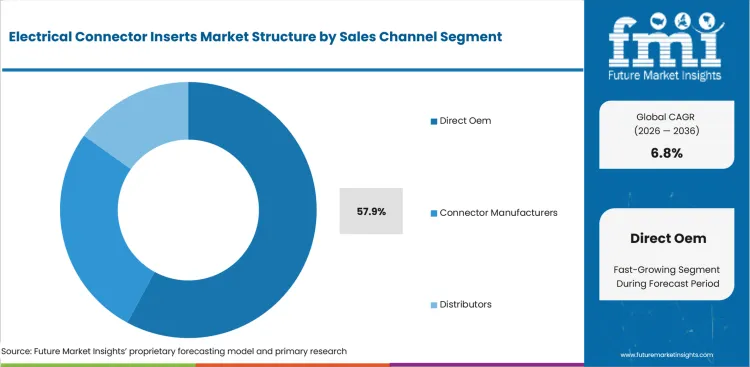
Direct OEM sourcing concentrates accountability around approved drawings and change-control records during vehicle program release decisions and validation reviews. OEM platform teams often approve insert geometry during connector-family selection before distributors enter service discussions. The Federal Reserve Board reported in June 2026 that durable goods output rose 0.8% in May 2026.
- By sales channel, direct OEM is projected to account for 57.9% share in 2026 driven by specification ownership and direct engineering escalation. NIST published the Manufacturing USA 2025 Annual Report in March 2026, which keeps measurement and manufacturing capability visible inside supplier qualification discussions for precision components. Those records support repeat approval for connector families that move across vehicle platforms and plants.
- Direct OEM adoption is gaining momentum in platform programs supported by fewer handoffs between engineering, plant procurement and connector validation. OEM platform teams comparing automotive connector spending place value on insert suppliers that respond before release drawings become fixed. The preference gives insert suppliers a clearer route into early validation meetings before tooling changes become costly.
What supports automotive demand within the end-use category?
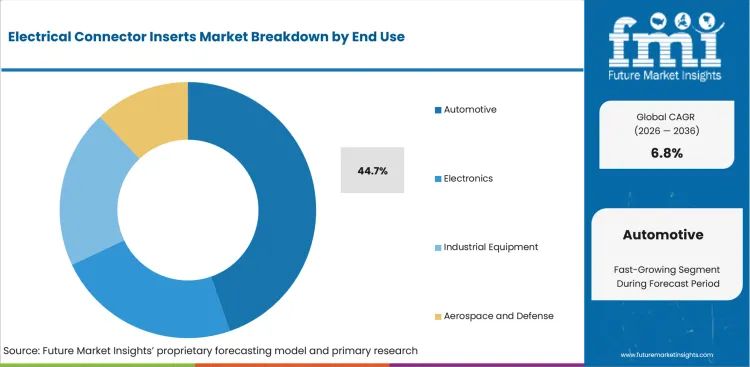
Automotive insert demand is tied to connectors that must survive vibration, heat and repeated service cycles. Vehicle electronics now cover power distribution, sensors and control modules across more compact platforms. VDA reported Germany produced 1.67 million electric passenger cars in 2025, which increases demand for qualified connector inserts that support power and signal stability inside validated connector systems.
- By end use, automotive is estimated to hold 44.7% share in 2026 owing to platform-level wiring complexity and longer validation cycles. The VDA February 2026 production release noted electric passenger cars reached 40.0% of German passenger car output in 2025, which raises the need for stable insert materials in electrified architectures.
- Automotive demand is expected to grow among OEM platform teams attributable to higher electronic content and qualification records. The segment links to automotive wiring harness demand due to inserts protecting fit at connector points that harness teams qualify before vehicle launch.
How is automotive electronics positioned within the application category?
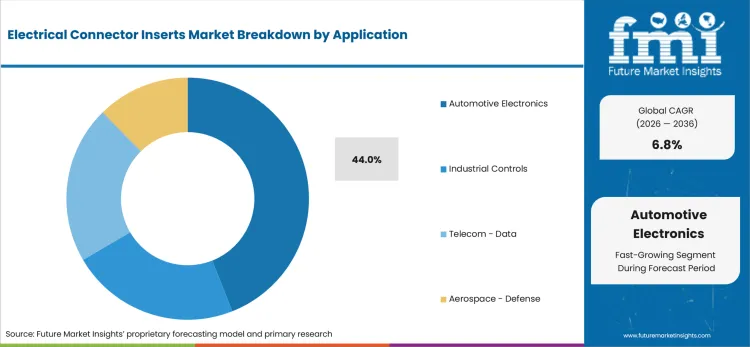
Automotive electronics programs place insert selection inside dense packaging and signal-control tasks across control modules. Engineering teams require connector housings that keep contacts aligned under vibration and heat cycling. TE Connectivity introduced an inside device connectivity portfolio in October 2025 for automotive ECUs and next-generation vehicle platforms. The portfolio context reinforces why insert material, pin stability and assembly tolerance are reviewed before vehicle electronics programs scale.
- By application, automotive electronics are forecast to represent 44.0% share in 2026 supported by ECU and battery system density. ADAS connection density also raises the need for insert stability during module packaging reviews. TE Connectivity stated in October 2025 that its inside device connectivity portfolio covers board-to-board and wire-to-board connector solutions. The same portfolio includes flex-to-board and wire-to-wire formats, which keeps insert fit central to module design.
- Purchase activity for automotive electronics inserts is anticipated to rise driven by compact control modules and repeatable mating needs. Engineering teams that review PCB connector demand require insert evidence that supports signal stability without adding assembly complexity.
What drives PBT inserts within the material category?
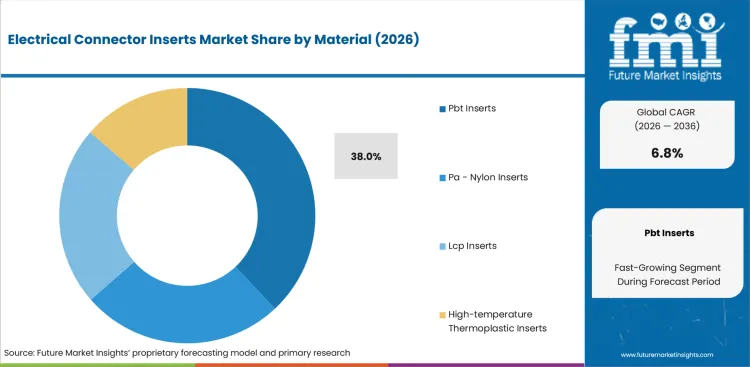
Material selection starts with the failure modes that connector inserts must resist during repeat mating cycles. PBT inserts are used where dimensional stability, molded accuracy and electrical insulation need predictable behavior. NIST described standards and measurement roles for United States manufacturing in its February 2026 manufacturing economy report. The same measurement discipline supports material selection where OEM platform teams defend tolerance windows during repeat connector approval.
- Based on material, PBT inserts are likely to capture 38.0% share in 2026 attributable to molding familiarity and stable electrical insulation. NIST published the Annual Report on the United States Manufacturing Economy in February 2026, which reinforces the manufacturing measurement context behind material verification and repeat production checks. Repeat material data then helps plant teams compare molded parts across approved connector families and tooling runs.
- PBT inserts are drawing attention from connector manufacturers shaped by familiar processing behavior and repeatable part geometry. Material engineers evaluating insulation plastics compare flow behavior and heat exposure before they approve production lots for recurring connector families.
How does board-to-board influence purchasing within connector type?
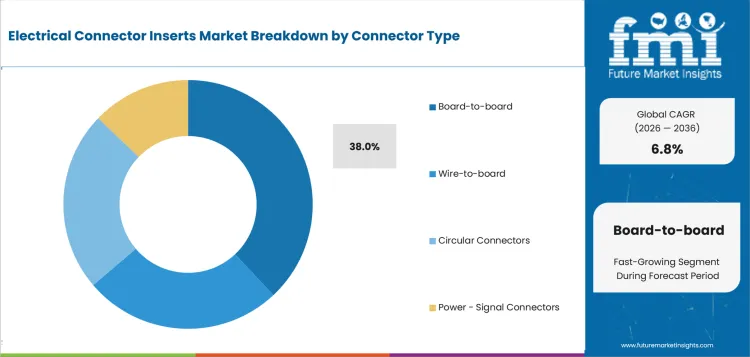
Board-to-board formats make insert accuracy visible inside compact electronic assemblies that use tight board spacing. The commercial issue covers connector fit and the ability to maintain signal paths in tight layouts. Molex announced availability of its Quad-Row Shield connector in November 2025 and cited up to 25dB EMI reduction. The release shows how board-level connector design is moving toward denser signal paths that increase insert precision needs.
- By connector type, board-to-board is set to lead the category with 38.0% share in 2026 due to dense module layouts and controlled mating geometry. Molex stated in November 2025 that the Quad-Row Shield supports up to 80 pins in a single board-to-board connector, which illustrates the density pressure behind insert precision.
- Sales of board-to-board insert designs are forecast to expand in compact electronics reinforced by signal integrity and alignment requirements. Design teams using SMP connector demand review mating stability before approving connector families for higher-speed devices
What are the drivers, restraints, and opportunities in the electrical connector inserts market?
Near-term purchases are being shaped by connector qualification pressure, material approval risk and direct OEM account expansion outlined below.
- Driver: Vehicle electronics density is expected to push OEM platform teams toward insert materials that keep mating geometry stable during validation.
- Restraint: Adoption is anticipated to slow where qualification files lack thermal, vibration and repeatability proof for the target connector family.
- Opportunity: Direct OEM programs are projected to open account access for insert suppliers that shorten documentation cycles and support local engineering teams.
OEM platform teams are expected to raise interest in inserts that reduce approval risk during compact connector design. TE Connectivity introduced inside device connectivity solutions in October 2025 for automotive ECUs and next-generation vehicle platforms. The portfolio included board-to-board and wire-to-board connector solutions for compact automotive ECU applications inside modules. The development keeps insert geometry and material proof inside early engineering review before automotive programs move toward recurring production orders.
Qualification burden remains a restraint for insert suppliers that lack material traceability and repeatable test files. NIST published NIST IR 8577 on semiconductor microelectronics standards in 2025 and described physical dimensions and material properties as compatibility inputs. The standards context reinforces the scrutiny placed on small electromechanical interfaces during supplier review. Connector insert manufacturers need clean test evidence before plant sourcing teams accept material substitution inside qualified families.
Service-led supplier engagement is projected to turn qualification pressure into an account-opening route for insert manufacturers. Molex introduced MX-DaSH modular wire-to-wire connectors in December 2025 for automotive harness and zonal architecture applications. The modular platform points to a purchasing shift toward configurable connector systems and service-backed qualification. Insert suppliers aligned to cable accessory spending are expected to receive closer review where connector families affect installation cost and field service.
Which country CAGRs are profiled in the electrical connector inserts market?
.webp "Top Country Growth Comparison Electrical Connector Inserts Market Cagr (2026 2036)")
| Country | CAGR |
|---|---|
| United States | 6.2% |
| China | 7.6% |
| India | 8.2% |
| Germany | 5.6% |
| United Kingdom | 5.8% |
| Japan | 5.6% |
| South Korea | 6.6% |
Source: FMI's proprietary forecasting model and primary research
How do country-level CAGRs compare in the Electrical Connector Inserts Market?
Country-wise outlook in the industry is expected to reflect how quickly OEM platform teams shift from approved connector families to new electronic architectures. India is projected to grow at 8.2% CAGR and China is forecast at 7.6% CAGR due to production scale and localization. The United States is predicted at 6.2% CAGR under measured replacement cycles and approved-vendor discipline. Germany and Japan are likely to record 5.6% CAGR under longer validation cycles. The United Kingdom is projected at 5.8% CAGR by 2036 due to service-led supply reviews.
- United States connector insert approval stays tied to vehicle electronics reliability and long-qualified component lists. The United States is projected to grow at 6.2% CAGR through 2036, driven by OEM demand for traceable insert materials. Federal Reserve Board data showed motor vehicle and parts output growth of 3.7% in April 2026. The rebound keeps qualification files active for connector families used in control modules and harness interfaces, driving market growth.
- China connector insert demand is shaped by electronics-heavy vehicle platforms and supplier localization pressure. Connector insert demand in China is forecast to rise at 7.6% CAGR over the forecast period, supported by domestic vehicle production scale. The State Council Information Office reported auto output of 34.531 million vehicles in 2025. Large platform volumes make insert qualification valuable due to small dimensional issues spreading across many connector families quickly.
- India is moving connector insert qualification into formal sourcing programs tied to vehicle and electronics assembly. India is anticipated to advance at 8.2% CAGR over the assessment period, propelled by production growth and more organized tier supply. SIAM reported passenger vehicle sales of 46.43 lakh units in FY 2025-26 across India. The scale creates demand for inserts that hold connector fit inside harness and control-module programs. Local tier suppliers still need price discipline and clear documentation before recurring orders expand.
- Germany treats connector insert substitution as an engineering decision before commercial negotiation begins inside supplier review. Germany is estimated to expand at 5.6% CAGR through 2036, reinforced by electric passenger car production and disciplined supplier approval. VDA reported domestic electric passenger car production of 1.67 million vehicles in 2025. Electrified platforms increase attention on inserts used around power, signal and shielded connector systems. German engineering teams review change-control files slowly due to reliability expectations across electrified platforms.
- United Kingdom connector insert purchasing is influenced by export exposure and imported component reliability. United Kingdom demand is predicted to record 5.8% CAGR during the assessment period, shaped by service-led sourcing and cautious supplier changes. SMMT reported car exports of 555,826 units in 2025 across United Kingdom production sites. Export dependence increases scrutiny of connector inserts due to vehicle makers needing predictable part availability under cross-border supply schedules.
- Japan keeps insert demand closely tied to quality audits and long approval cycles inside vehicle electronics. Japan is projected to post 5.6% CAGR by 2036, owing to stable automotive production discipline and supplier qualification depth. The International Trade Administration of the United States reported automotive manufacturing at 13.9% of Japan manufacturing GDP in 2024. The manufacturing weight keeps connector inserts inside careful engineering reviews and long-life supplier scorecards. Japanese OEM platform teams rarely shift insert families without evidence of part consistency across audits.
- South Korea links connector insert demand to export-oriented vehicle programs and compact electronics supply chains. South Korea is estimated to grow at 6.6% CAGR over the forecast period, influenced by production recovery and high electrical content. Korea Ministry of Trade, Industry and Resources reported automobile production of 387,000 units in March 2026. Output growth keeps connector qualification active for suppliers serving infotainment, ADAS and electric power systems. Local tier suppliers still demand quick engineering response due to short feedback loops during export programs. Insert manufacturers with Korean technical support are expected to receive consideration where production schedules leave little room for requalification delays.
Who are the notable companies in the Electrical Connector Inserts Market?
TE Connectivity, Amphenol, Molex, Smiths Interconnect, ITT Cannon, Rosenberger, Fischer Connectors, Glenair, Eaton and Phoenix Contact are the notable companies shaping this market.
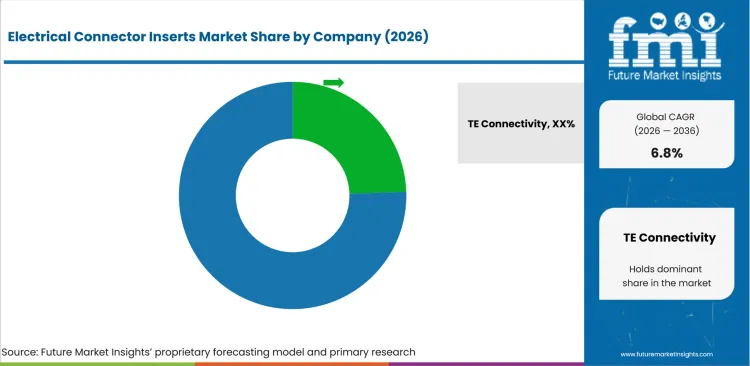
Competition is moderately concentrated among global connector manufacturers and specialized harsh-environment interconnect suppliers across validated accounts. Established multinational players retain account access due to broad connector families, engineering support and approved-vendor familiarity. Regional and application-focused suppliers compete where circular, sealed or high-voltage connector needs require narrower technical fit.
- Product capability separates suppliers that cover automotive electronics from those focused on harsh-environment programs. TE Connectivity and Molex serve OEM platform teams that need board-level and wire-level connector options under one review path. Amphenol adds sealed connector breadth for accounts that need broader interconnect support in harsh environments. Their advantage is breadth of application engineering and documentation support, which reduces the number of supplier files plant sourcing teams must manage.
- Harsh-environment programs create a different competitive route for Smiths Interconnect and ITT Cannon in rugged applications. Rosenberger, Fischer Connectors and Glenair add relevance where sealed connector fit needs specific review. These companies compete in connector systems that face vibration, sealing and field-service risk during field operation.
- Industrial account access gives Eaton and Phoenix Contact a relevant position in projects tied to electrical cabinets, controls and factory systems. Their role is clearest where engineering teams want service continuity and channel support during installation. Insert suppliers linked to these accounts need product evidence that aligns with connector housings used in machine builders and plant networks.
- The sourcing confidence is expected to concentrate around suppliers that combine product breadth, test records and application engineering. TE Connectivity, Amphenol and Molex have visible breadth across automotive electronics and industrial applications.
Competitive Benchmarking: Electrical Connector Inserts Market
| Company | Insert Relevance | Documentation Support | Application Engineering | Service Reach |
|---|---|---|---|---|
| TE Connectivity | High | Strong | High | Global |
| Amphenol | High | Strong | High | Global |
| Molex | High | Strong | High | Global |
| Smiths Interconnect | Medium | Strong | Medium | Global |
| ITT Cannon | Strong | Medium | Medium | Global |
| Rosenberger | Strong | Strong | Medium | Global |
| Fischer Connectors | Medium | Strong | Medium | Global |
| Glenair | Strong | Medium | Medium | Global |
| Eaton | Medium | Medium | Strong | Global |
| Phoenix Contact | Medium | Medium | Strong | Global |
Source: Future Market Insights competitive analysis, 2026. Ratings reflect relative portfolio relevance and workflow fit. Service capability and geographic reach shape the remaining comparison.
Key Developments in the Electrical Connector Inserts Market
- In October 2025, TE Connectivity launched an inside device connectivity portfolio for automotive ECUs and next-generation vehicle platforms. The portfolio included board-to-board and wire-to-board connector solutions for compact automotive control modules inside ECUs.
- In December 2025, Molex introduced MX-DaSH Modular Wire-to-Wire Connectors for automotive harness and zonal architecture applications. The system combines power and signal connectivity in a cartridge-based platform for automotive harness programs. High-speed data connectivity is also included in the same connector system for zonal architectures.
- In November 2025, Rosenberger launched the HVR25 high-voltage connector series for low-current auxiliary EV systems. The release cited up to 40A current capacity and 1000V DC rated voltage for compact power use. The product is expected to support connector programs linked to heaters and inverters in EV platforms.
- In August 2025, Amphenol announced an agreement to acquire Trexon for its high-reliability cable assembly portfolio. The transaction was assigned to Amphenol’s harsh environment solutions segment after deal announcement.
Key Players in the Electrical Connector Inserts Market
Connector manufacturers
- TE Connectivity
- Amphenol
- Molex
- Smiths Interconnect
Harsh-environment connector suppliers
- ITT Cannon
- Rosenberger
- Fischer Connectors
- Glenair
Industrial connector suppliers
- Eaton
- Phoenix Contact
Electrical Connector Inserts Market - Report Scope
| Coverage field | Report scope |
|---|---|
| Market breakdown | Electrical Connector Inserts Market Breakdown By Material, Connector Type, Application, End Use, Sales Channel and Region |
| Quantitative Units | USD 1,860.6 million in 2026 to USD 3,592.2 million by 2036, at a CAGR of 6.8% |
| Market Definition | Electrical connector inserts are molded insulating components fitted inside connector housings to position contacts, maintain mating geometry and support reliable power or signal transfer for OEM platform teams and connector manufacturers. |
| Regions Covered | North America, Latin America, Europe, East Asia, South Asia and Pacific, and Middle East and Africa |
| Countries Covered | United States, China, India, Germany, United Kingdom, Japan, South Korea, Rest of World and 30+ countries |
| Key Companies Profiled | TE Connectivity, Amphenol, Molex, Smiths Interconnect, ITT Cannon, Rosenberger, Fischer Connectors, Glenair, Eaton and Phoenix Contact |
| Forecast Period | 2026 to 2036 |
| Approach | Hybrid bottom-up and top-down methodology using segment share, automotive electronics exposure, connector type mix, channel route and supplier portfolio depth |
Source: Future Market Insights - analysis driven by proprietary forecasting models and primary research
Electrical Connector Inserts Market - Research Methodology
| Method | Approach |
|---|---|
| Primary Research | Primary interviews covered OEM platform engineers, tier supplier sourcing teams, connector manufacturers and plant supply chain managers. Discussions focused on insert material approval, tolerance proof, service escalation and application engineering needs. Interviewees were asked how direct OEM routes, distributor support and connector-family qualification change order timing across automotive, electronics and industrial equipment accounts. |
| Desk Research | Desk research reviewed official vehicle production data, manufacturing standards references, company product releases and connector portfolio pages. Product relevance was checked against insert use cases including molded insulation, mating geometry, board-level density and harsh-environment connector fit. Company lists were screened to avoid adjacent electrical products without clear connector or insert relevance. |
| Market Sizing and Forecasting | Market sizing used a hybrid bottom-up and top-down model across material mix, connector type demand, application exposure and channel route. Segment shares were checked against automotive electronics use cases, direct OEM purchasing behavior and country-level manufacturing signals. Forecast assumptions were adjusted for qualification burden, service reach and supplier portfolio depth. |
| Data Validation | Data validation compared the forecast against country CAGR logic, segment totals and supplier role evidence. Vehicle production indicators, official manufacturing references and company development records were used to test adoption pathways. Portfolios were reviewed to avoid counting cable, harness or connector products without direct relevance to insert selection and qualification. |
Source: Future Market Insights (FMI) analysis, based on proprietary forecasting model and primary research
Electrical Connector Inserts Market by Segments
Electrical Connector Inserts Market segmented by Material:
- PBT Inserts
- PA / Nylon Inserts
- LCP Inserts
- High-Temperature Thermoplastic Inserts
Electrical Connector Inserts Market segmented by Connector Type:
- Board-to-Board
- Wire-to-Board
- Circular Connectors
- Power / Signal Connectors
Electrical Connector Inserts Market segmented by Application:
- Automotive Electronics
- Industrial Controls
- Telecom / Data
- Aerospace / Defense
Electrical Connector Inserts Market segmented by End Use:
- Automotive
- Electronics
- Industrial Equipment
- Aerospace and Defense
Electrical Connector Inserts Market segmented by Sales Channel:
- Direct OEM
- Connector Manufacturers
- Distributors
Electrical Connector Inserts Market by Region:
- North America
- United States
- Canada
- Latin America
- Brazil
- Mexico
- Argentina
- Europe
- Germany
- United Kingdom
- France
- Italy
- Spain
- East Asia
- China
- Japan
- South Korea
- South Asia and Pacific
- India
- ASEAN
- Australia and New Zealand
- Middle East and Africa
- GCC countries
- South Africa
- Türkiye
Research Sources and Bibliography
- International Organization of Motor Vehicle Manufacturers. (2026, April). Auto industry growth shifted east in 2025 amid global repositioning. International Organization of Motor Vehicle Manufacturers.
- Federal Reserve Board. (2026, June). Industrial Production and Capacity Utilization - G.17. Federal Reserve Board.
- National Institute of Standards and Technology. (2026, March). Manufacturing USA 2025 Annual Report. National Institute of Standards and Technology.
- National Institute of Standards and Technology. (2026, February). Annual Report on the USA Manufacturing Economy: 2025. National Institute of Standards and Technology.
- National Institute of Standards and Technology. (2025, April). Semiconductors and Microelectronics Standards Working Group Report. National Institute of Standards and Technology.
- State Council Information Office of China. (2026, January). China's auto output, sales reach new highs in 2025. State Council Information Office of China.
- Society of Indian Automobile Manufacturers. (2026, April). Auto Industry Performance of Q4 (Jan-March 2026) & FY 2025-26. Society of Indian Automobile Manufacturers.
- Verband der Automobilindustrie. (2026, February). Production and market in January 2026. Verband der Automobilindustrie.
- Society of Motor Manufacturers and Traders. (2026, June). UK Car Manufacturing. Society of Motor Manufacturers and Traders.
- USA International Trade Administration. (2025, November). Japan - Automotive. USA International Trade Administration.
- Ministry of Trade, Industry and Resources of Korea. (2026, April). March 2026 Automobile Exports Reach $6.4 Billion. Ministry of Trade, Industry and Resources of Korea.
- International Energy Agency. (2026, May). Trends in electric cars - Global EV Outlook 2026. International Energy Agency.
- TE Connectivity. (2025, October). TE Connectivity launches new product portfolio for automotive ECUs to accelerate SDV and E/E architectural transformation. TE Connectivity.
- Molex. (2025, November). Molex Announces Availability of Industry-First, Space-Saving Quad-Row Board-to-Board Connectors with EMI Shields. Molex.
- Molex. (2025, December). Molex Unveils MX-DaSH Modular Wire-to-Wire Connectors, Cutting Cost and Complexity of Automotive Wiring Harness and Zonal Architecture Applications. Molex.
- Rosenberger. (2025, November). Rosenberger Launches Next-Gen Connector HVR25 - Precision Without Complexity. Rosenberger.
- Amphenol Corporation. (2025, August). Amphenol Corporation to Acquire Trexon. Amphenol Corporation.
This bibliography is provided for reader reference and uses primary government, standards-body, official trade body and company sources.
This Report Answers
- What value is the electrical connector inserts market estimated at in 2026 and forecast to reach by 2036?
- What CAGR is expected for the electrical connector inserts market from 2026 to 2036?
- Which material, connector type, application, end-use and sales-channel segments shape demand?
- Which operating pressures support adoption and purchase activity among OEM platform teams?
- How do country CAGRs differ across the profiled markets?
- Which companies compete across documentation support, application engineering and service reach?
- How does FMI validate forecasts using a hybrid bottom-up and top-down approach?
- What factors should OEM platform teams address before broader account expansion?
- How do claims review, documentation and qualification evidence affect supplier selection?
Frequently Asked Questions
What is driving growth in the Electrical Connector Inserts Market?
Growth is being driven by rising automotive electronics content, EV adoption, and increasing connector density in ADAS, battery management, and vehicle control systems. OEMs are also demanding greater reliability, material traceability and connector performance during qualification.
Who are the key players in the Electrical Connector Inserts Market?
Key companies include TE Connectivity, Amphenol, Molex, Smiths Interconnect, ITT Cannon, Rosenberger, Fischer Connectors, Glenair, Eaton, and Phoenix Contact. Competition is focused on connector portfolio depth and qualification support.
What is a significant restraint in the Electrical Connector Inserts Market?
Lengthy qualification cycles and stringent validation requirements can delay supplier approval and product adoption. Incomplete material documentation or performance data may also trigger costly retesting and sourcing delays.
Why should executives track the Electrical Connector Inserts Market?
Executives should track the market due to connector insert failures creating approval delays and field service cost. The category affects vehicle electronics, industrial controls and connector families that require stable mating geometry.
What business problem does the Electrical Connector Inserts Market address?
The market addresses the need to hold contacts in precise positions inside connector housings. Electrical connector inserts reduce risk from dimensional drift, vibration exposure and material inconsistency during repeated mating cycles.
What should procurement leaders evaluate before selecting suppliers?
Procurement leaders should evaluate material traceability, tolerance proof, tooling consistency and application engineering support. Direct OEM accounts should also review service response and change-control ownership before approving recurring volume.
What limits return on investment for purchasing teams?
Return on investment is expected to weaken if qualification files are incomplete or insert substitutions trigger retesting. OEM platform teams should set acceptance criteria before moving volumes into new connector families.
How do suppliers build long-term account confidence?
Connector insert suppliers build account confidence by giving engineering teams clear material files and repeatability evidence. Local application support also helps plant procurement teams manage service issues after approval.
Which segment positions carry the closest procurement scrutiny?
Direct OEM, automotive, automotive electronics, PBT inserts and board-to-board formats carry close scrutiny. These segments are closest to drawing control, electronics density and material qualification decisions.
Which countries are expected to show more visible growth conditions?
India and China are expected to show more visible growth conditions due to production scale and supplier localization. Germany, Japan and the United States are expected to grow, owing to longer validation cycles and documentation-heavy supplier screening.
Preview the report firsthand - request a free sample
Get SampleGet the brochure for pricing and purchase details.
Get PDFTable of Content
- Key Takeaways
- Market Size and CAGR
- Top Growth Driver
- Fastest Growing Segment
- Leading Region
- Key Companies
- Emerging Opportunities
- Executive Summary
- Global Market Outlook
- Demand-side Trends
- Supply-side Trends
- Technology Roadmap Analysis
- Analysis and Recommendations
- Analyst Perspective (What is happening? Why now? What should investors know?)
- Key Questions Answered
- How large is the market?
- What is the CAGR?
- What are key trends?
- Which region dominates?
- Who are the leaders?
- Market Overview
- Market Coverage / Taxonomy
- Market Definition / Scope / Limitations
- Research Methodology
- Chapter Orientation
- Analytical Lens and Working Hypotheses
- Market Structure, Signals, and Trend Drivers
- Benchmarking and Cross-market Comparability
- Market Sizing, Forecasting, and Opportunity Mapping
- Research Design and Evidence Framework
- Desk Research Programme (Secondary Evidence)
- Expert Input and Fieldwork (Primary Evidence)
- Tooling, Models, and Reference Databases
- Data Engineering and Model Build
- Quality Assurance and Audit Trail
- Market Background
- Market Dynamics (Drivers, Restraints, Opportunity, Trends)
- Scenario Forecast (Optimistic, Likely, Conservative)
- Impact Analysis
- AI Impact
- Sustainability Impact
- Regulatory Impact
- Technology Impact
- Consumer / Buyer Analysis
- Purchase Drivers
- Adoption Barriers
- Buyer Journey
- Opportunity Map Analysis
- Product Life Cycle Analysis
- Supply Chain Analysis
- Investment Feasibility Matrix
- Value Chain Analysis
- PESTLE and Porter's Analysis
- Regulatory Landscape
- Regional Parent Market Outlook
- Production and Consumption Statistics
- Import and Export Statistics
- Global Market Analysis and Forecast, 2021 to 2036
- Historical Market Size Value (USD Million) & Volume (Unit) Analysis, 2021 to 2025
- Current and Future Market Size Value (USD Million) & Volume (Unit) Projections, 2026 to 2036
- Y-o-Y Growth Trend Analysis
- Absolute $ Opportunity Analysis
- Global Market Pricing Analysis, 2021 to 2036
- Global Market Analysis and Forecast, By Material, 2021 to 2036
- Introduction / Key Findings
- Historical Market Size Value (USD Million) & Volume (Unit) Analysis By Material, 2021 to 2025
- Current and Future Market Size Value (USD Million) & Volume (Unit) Analysis and Forecast By Material, 2026 to 2036
- Pbt Inserts
- Pa - Nylon Inserts
- Lcp Inserts
- High-temperature Thermoplastic Inserts
- Pbt Inserts
- Y-o-Y Growth Trend Analysis By Material, 2021 to 2025
- Absolute $ Opportunity Analysis By Material, 2026 to 2036
- Global Market Analysis and Forecast, By Connector Type, 2021 to 2036
- Introduction / Key Findings
- Historical Market Size Value (USD Million) & Volume (Unit) Analysis By Connector Type, 2021 to 2025
- Current and Future Market Size Value (USD Million) & Volume (Unit) Analysis and Forecast By Connector Type, 2026 to 2036
- Board-to-board
- Wire-to-board
- Circular Connectors
- Power - Signal Connectors
- Board-to-board
- Y-o-Y Growth Trend Analysis By Connector Type, 2021 to 2025
- Absolute $ Opportunity Analysis By Connector Type, 2026 to 2036
- Global Market Analysis and Forecast, By Application, 2021 to 2036
- Introduction / Key Findings
- Historical Market Size Value (USD Million) & Volume (Unit) Analysis By Application, 2021 to 2025
- Current and Future Market Size Value (USD Million) & Volume (Unit) Analysis and Forecast By Application, 2026 to 2036
- Automotive Electronics
- Industrial Controls
- Telecom - Data
- Aerospace - Defense
- Automotive Electronics
- Y-o-Y Growth Trend Analysis By Application, 2021 to 2025
- Absolute $ Opportunity Analysis By Application, 2026 to 2036
- Global Market Analysis and Forecast, By End Use, 2021 to 2036
- Introduction / Key Findings
- Historical Market Size Value (USD Million) & Volume (Unit) Analysis By End Use, 2021 to 2025
- Current and Future Market Size Value (USD Million) & Volume (Unit) Analysis and Forecast By End Use, 2026 to 2036
- Automotive
- Electronics
- Industrial Equipment
- Aerospace and Defense
- Automotive
- Y-o-Y Growth Trend Analysis By End Use, 2021 to 2025
- Absolute $ Opportunity Analysis By End Use, 2026 to 2036
- Global Market Analysis and Forecast, By Sales Channel, 2021 to 2036
- Introduction / Key Findings
- Historical Market Size Value (USD Million) & Volume (Unit) Analysis By Sales Channel, 2021 to 2025
- Current and Future Market Size Value (USD Million) & Volume (Unit) Analysis and Forecast By Sales Channel, 2026 to 2036
- Direct Oem
- Connector Manufacturers
- Distributors
- Direct Oem
- Y-o-Y Growth Trend Analysis By Sales Channel, 2021 to 2025
- Absolute $ Opportunity Analysis By Sales Channel, 2026 to 2036
- Global Market Analysis and Forecast, By Region, 2021 to 2036
- Introduction
- Historical Market Size Value (USD Million) & Volume (Unit) Analysis By Region, 2021 to 2025
- Current Market Size Value (USD Million) & Volume (Unit) Analysis and Forecast By Region, 2026 to 2036
- North America
- Latin America
- Western Europe
- Eastern Europe
- East Asia
- South Asia and Pacific
- Middle East & Africa
- Market Attractiveness Analysis By Region
- North America Market Analysis and Forecast, By Country, 2021 to 2036
- Historical Market Size Value (USD Million) & Volume (Unit) Trend Analysis By Market Taxonomy, 2021 to 2025
- Market Size Value (USD Million) & Volume (Unit) Forecast By Market Taxonomy, 2026 to 2036
- By Country
- USA
- Canada
- Mexico
- By Material
- By Connector Type
- By Application
- By End Use
- By Sales Channel
- By Country
- Market Attractiveness Analysis
- By Country
- By Material
- By Connector Type
- By Application
- By End Use
- By Sales Channel
- Key Takeaways
- Latin America Market Analysis and Forecast, By Country
- Historical Market Size Value (USD Million) & Volume (Unit) Trend Analysis By Market Taxonomy, 2021 to 2025
- Market Size Value (USD Million) & Volume (Unit) Forecast By Market Taxonomy, 2026 to 2036
- By Country
- Brazil
- Chile
- Rest of Latin America
- By Material
- By Connector Type
- By Application
- By End Use
- By Sales Channel
- By Country
- Market Attractiveness Analysis
- By Country
- By Material
- By Connector Type
- By Application
- By End Use
- By Sales Channel
- Key Takeaways
- Western Europe Market Analysis and Forecast, By Country
- Historical Market Size Value (USD Million) & Volume (Unit) Trend Analysis By Market Taxonomy, 2021 to 2025
- Market Size Value (USD Million) & Volume (Unit) Forecast By Market Taxonomy, 2026 to 2036
- By Country
- Germany
- UK
- Italy
- Spain
- France
- Nordic
- BENELUX
- Rest of Western Europe
- By Material
- By Connector Type
- By Application
- By End Use
- By Sales Channel
- By Country
- Market Attractiveness Analysis
- By Country
- By Material
- By Connector Type
- By Application
- By End Use
- By Sales Channel
- Key Takeaways
- Eastern Europe Market Analysis and Forecast, By Country
- Historical Market Size Value (USD Million) & Volume (Unit) Trend Analysis By Market Taxonomy, 2021 to 2025
- Market Size Value (USD Million) & Volume (Unit) Forecast By Market Taxonomy, 2026 to 2036
- By Country
- Russia
- Poland
- Hungary
- Balkan & Baltic
- Rest of Eastern Europe
- By Material
- By Connector Type
- By Application
- By End Use
- By Sales Channel
- By Country
- Market Attractiveness Analysis
- By Country
- By Material
- By Connector Type
- By Application
- By End Use
- By Sales Channel
- Key Takeaways
- East Asia Market Analysis and Forecast, By Country
- Historical Market Size Value (USD Million) & Volume (Unit) Trend Analysis By Market Taxonomy, 2021 to 2025
- Market Size Value (USD Million) & Volume (Unit) Forecast By Market Taxonomy, 2026 to 2036
- By Country
- China
- Japan
- South Korea
- By Material
- By Connector Type
- By Application
- By End Use
- By Sales Channel
- By Country
- Market Attractiveness Analysis
- By Country
- By Material
- By Connector Type
- By Application
- By End Use
- By Sales Channel
- Key Takeaways
- South Asia and Pacific Market Analysis and Forecast, By Country
- Historical Market Size Value (USD Million) & Volume (Unit) Trend Analysis By Market Taxonomy, 2021 to 2025
- Market Size Value (USD Million) & Volume (Unit) Forecast By Market Taxonomy, 2026 to 2036
- By Country
- India
- ASEAN
- Australia & New Zealand
- Rest of South Asia and Pacific
- By Material
- By Connector Type
- By Application
- By End Use
- By Sales Channel
- By Country
- Market Attractiveness Analysis
- By Country
- By Material
- By Connector Type
- By Application
- By End Use
- By Sales Channel
- Key Takeaways
- Middle East & Africa Market Analysis and Forecast, By Country
- Historical Market Size Value (USD Million) & Volume (Unit) Trend Analysis By Market Taxonomy, 2021 to 2025
- Market Size Value (USD Million) & Volume (Unit) Forecast By Market Taxonomy, 2026 to 2036
- By Country
- Kingdom of Saudi Arabia
- Other GCC Countries
- Türkiye
- South Africa
- Other African Union
- Rest of Middle East & Africa
- By Material
- By Connector Type
- By Application
- By End Use
- By Sales Channel
- By Country
- Market Attractiveness Analysis
- By Country
- By Material
- By Connector Type
- By Application
- By End Use
- By Sales Channel
- Key Takeaways
- Key Countries Market Analysis
- USA
- Pricing Analysis
- Market Share Analysis, 2025
- By Material
- By Connector Type
- By Application
- By End Use
- By Sales Channel
- Canada
- Pricing Analysis
- Market Share Analysis, 2025
- By Material
- By Connector Type
- By Application
- By End Use
- By Sales Channel
- Mexico
- Pricing Analysis
- Market Share Analysis, 2025
- By Material
- By Connector Type
- By Application
- By End Use
- By Sales Channel
- Brazil
- Pricing Analysis
- Market Share Analysis, 2025
- By Material
- By Connector Type
- By Application
- By End Use
- By Sales Channel
- Chile
- Pricing Analysis
- Market Share Analysis, 2025
- By Material
- By Connector Type
- By Application
- By End Use
- By Sales Channel
- Germany
- Pricing Analysis
- Market Share Analysis, 2025
- By Material
- By Connector Type
- By Application
- By End Use
- By Sales Channel
- UK
- Pricing Analysis
- Market Share Analysis, 2025
- By Material
- By Connector Type
- By Application
- By End Use
- By Sales Channel
- Italy
- Pricing Analysis
- Market Share Analysis, 2025
- By Material
- By Connector Type
- By Application
- By End Use
- By Sales Channel
- Spain
- Pricing Analysis
- Market Share Analysis, 2025
- By Material
- By Connector Type
- By Application
- By End Use
- By Sales Channel
- France
- Pricing Analysis
- Market Share Analysis, 2025
- By Material
- By Connector Type
- By Application
- By End Use
- By Sales Channel
- India
- Pricing Analysis
- Market Share Analysis, 2025
- By Material
- By Connector Type
- By Application
- By End Use
- By Sales Channel
- ASEAN
- Pricing Analysis
- Market Share Analysis, 2025
- By Material
- By Connector Type
- By Application
- By End Use
- By Sales Channel
- Australia & New Zealand
- Pricing Analysis
- Market Share Analysis, 2025
- By Material
- By Connector Type
- By Application
- By End Use
- By Sales Channel
- China
- Pricing Analysis
- Market Share Analysis, 2025
- By Material
- By Connector Type
- By Application
- By End Use
- By Sales Channel
- Japan
- Pricing Analysis
- Market Share Analysis, 2025
- By Material
- By Connector Type
- By Application
- By End Use
- By Sales Channel
- South Korea
- Pricing Analysis
- Market Share Analysis, 2025
- By Material
- By Connector Type
- By Application
- By End Use
- By Sales Channel
- Russia
- Pricing Analysis
- Market Share Analysis, 2025
- By Material
- By Connector Type
- By Application
- By End Use
- By Sales Channel
- Poland
- Pricing Analysis
- Market Share Analysis, 2025
- By Material
- By Connector Type
- By Application
- By End Use
- By Sales Channel
- Hungary
- Pricing Analysis
- Market Share Analysis, 2025
- By Material
- By Connector Type
- By Application
- By End Use
- By Sales Channel
- Kingdom of Saudi Arabia
- Pricing Analysis
- Market Share Analysis, 2025
- By Material
- By Connector Type
- By Application
- By End Use
- By Sales Channel
- Türkiye
- Pricing Analysis
- Market Share Analysis, 2025
- By Material
- By Connector Type
- By Application
- By End Use
- By Sales Channel
- South Africa
- Pricing Analysis
- Market Share Analysis, 2025
- By Material
- By Connector Type
- By Application
- By End Use
- By Sales Channel
- USA
- Market Structure Analysis
- Competition Dashboard
- Competition Benchmarking
- Market Share Analysis of Top Players
- By Regional
- By Material
- By Connector Type
- By Application
- By End Use
- By Sales Channel
- Emerging Startups
- Innovation Benchmarking
- Competition Analysis
- Competition Deep Dive
- TE Connectivity
- Overview
- Product Portfolio
- Profitability by Market Segments (Product/Region/Sales Channel)
- Sales Footprint
- Strategy Overview
- Marketing Strategy
- Product Strategy
- Channel Strategy
- Amphenol
- Molex
- Smiths Interconnect
- ITT Cannon
- Rosenberger
- Fischer Connectors
- Glenair
- Eaton
- Phoenix Contact
- TE Connectivity
- Case Studies
- Success Stories
- Recent Developments
- Competition Deep Dive
- Assumptions & Acronyms Used


