Electrophoresis Reagents Market Size and Share Forecast Outlook 2025 to 2035

The Electrophoresis Reagents Market is estimated to be valued at USD 2.9 billion in 2025 and is projected to reach USD 4.8 billion by 2035, registering a compound annual growth rate (CAGR) of 5.1% over the forecast period.
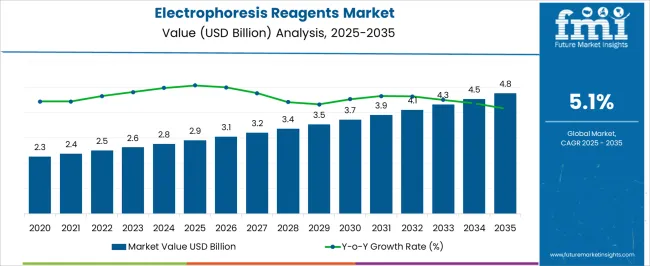
Quick Stats for Electrophoresis Reagents Market

  • Electrophoresis Reagents Market Value (2025): USD 2.9 billion
  • Electrophoresis Reagents Market Forecast Value (2035): USD 4.8 billion
  • Electrophoresis Reagents Market Forecast CAGR: 5.1%
  • Leading Segment in Electrophoresis Reagents Market in 2025: Gels (40.3%)
  • Key Growth Regions in Electrophoresis Reagents Market: North America, Asia-Pacific, Europe
  • Top Key Players in Electrophoresis Reagents Market: Thermo Fisher Scientific Inc, Bio-Rad Laboratories, Inc, Merck KGaA (Merck Millipore), Agilent Technologies Inc, GE Healthcare, Sigma-Aldrich Corporation, Lonza Group Ltd, Promega Corporation, Takara Bio Inc., QIAGEN N.V.

Electrophoresis Reagents Market Market Value Analysis

Electrophoresis Reagents Market Key Takeaways

Metric Value
Electrophoresis Reagents Market Estimated Value in (2025 E) USD 2.9 billion
Electrophoresis Reagents Market Forecast Value in (2035 F) USD 4.8 billion
Forecast CAGR (2025 to 2035) 5.1%

Why is the Electrophoresis Reagents Market Growing?

The Electrophoresis Reagents market is expanding steadily, driven by the increasing need for advanced molecular biology techniques across research, diagnostics, and industrial applications. Electrophoresis remains a fundamental process for separating and analyzing nucleic acids and proteins, and reagents are essential to ensure accuracy, sensitivity, and reproducibility. The rising prevalence of genetic disorders and cancers has intensified the demand for electrophoresis in clinical laboratories, while ongoing drug discovery initiatives are supporting broader utilization in pharmaceutical and biotechnology sectors.

Advances in electrophoresis technologies, including automated systems and next-generation gel formulations, are further boosting efficiency and reliability. Additionally, academic and research institutions are playing a critical role in sustaining demand as they adopt electrophoresis reagents for educational training and experimental research.

Increasing global investment in life sciences, genomics, and proteomics is reinforcing the long-term relevance of these reagents As the focus on personalized medicine and precision diagnostics grows, the electrophoresis reagents market is expected to remain a vital enabler of biological research and clinical testing, supported by innovation in product quality and cost-effective solutions.

Segmental Analysis

The electrophoresis reagents market is segmented by product type, end user, and geographic regions. By product type, electrophoresis reagents market is divided into Gels, Dyes, Buffers, and Others. In terms of end user, electrophoresis reagents market is classified into Academic Institutions, Pharmaceutical & Biotechnology Industry, Hospitals, and Diagnostic Centers. Regionally, the electrophoresis reagents industry is classified into North America, Latin America, Western Europe, Eastern Europe, Balkan & Baltic Countries, Russia & Belarus, Central Asia, East Asia, South Asia & Pacific, and the Middle East & Africa.
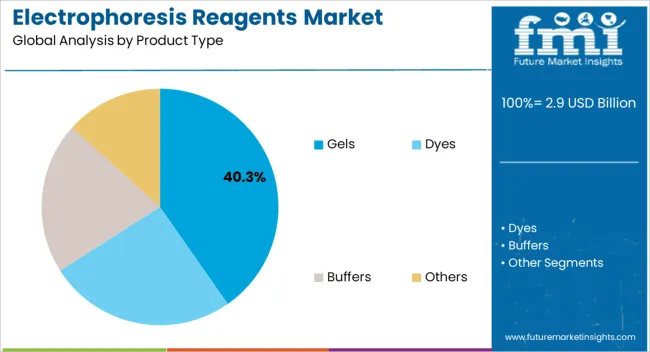
Insights into the Gels Product Type Segment

Electrophoresis Reagents Market Analysis By Product Type

The gels product type segment is expected to hold 40.3% of the electrophoresis reagents market revenue share in 2025, making it the leading product category. Gels continue to dominate due to their proven effectiveness in separating DNA, RNA, and proteins with high resolution and precision. Agarose and polyacrylamide gels remain widely used because of their versatility and reliability in research and diagnostic applications.

Researchers and clinicians prefer gels for their cost-effectiveness, reproducibility, and ease of customization for different experimental needs. The segment is also benefiting from continuous innovations in pre-cast gels and stain-free technologies, which improve convenience and reduce workflow times. Increasing adoption of gels in genetic testing, cancer diagnostics, and proteomics research further strengthens their market leadership.

Their critical role in enabling accurate analysis and interpretation of molecular structures supports consistent demand across academic, clinical, and industrial laboratories As biotechnology and life sciences research continue to advance, gels are anticipated to retain their position as the most widely utilized electrophoresis reagent type.
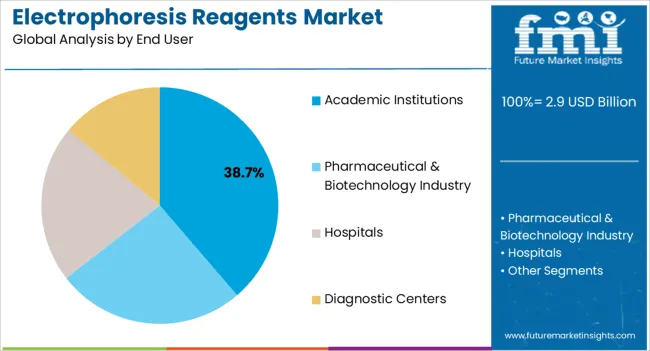
Insights into the Academic Institutions End User Segment

Electrophoresis Reagents Market Analysis By End User

The academic institutions segment is projected to account for 38.7% of the electrophoresis reagents market revenue share in 2025, positioning it as the leading end-user group. Growth in this segment is being driven by the increasing emphasis on research, training, and experimental learning in universities and research institutes worldwide. Electrophoresis reagents are indispensable for teaching molecular biology, genetics, and biochemistry, providing students with hands-on experience in analyzing DNA, RNA, and proteins.

Academic institutions also conduct a significant share of foundational and applied research, supporting advancements in genomics, proteomics, and biotechnology. Government funding, international collaborations, and expanding life sciences education programs are further boosting the adoption of electrophoresis reagents in this sector.

The availability of advanced research infrastructure in leading universities and growing investment in laboratory facilities across emerging economies are strengthening the segment’s role As global demand for skilled researchers rises, academic institutions are expected to remain a primary driver of electrophoresis reagent consumption, ensuring sustained growth for this market segment.

Market Overview

Electrophoresis Reagents Market Overview

Electrophoresis is a technique used for separation of DNA, RNA and Protein based on their size and charge. The techniques is used to determine the size and type of macromolecules from the sample. The techniques is based on application of electric charge at the ends of the assembly into which gel loaded with fluorescence dyes attached to sample is placed.

Depending upon the charge of the sample the macromolecules migrate from one end towards the other. After the process is completed the gel is placed under UV light source to see the bands formed my migration of the macromolecules.

Electrophoresis has wide applications like identification of molecular markers in genotyping of the organism species, for verifying amplification of gene sequences, to check quality and quantity of DNA, RNA and Protein samples after extraction and to separate DNA fragments in cloning.

Owing to increasing focus on biological therapies the based on alteration DNA and RNA the use of electrophoresis technique is increasing rapidly which is evidently expected to increase demand for electrophoresis reagents over the forecast period.
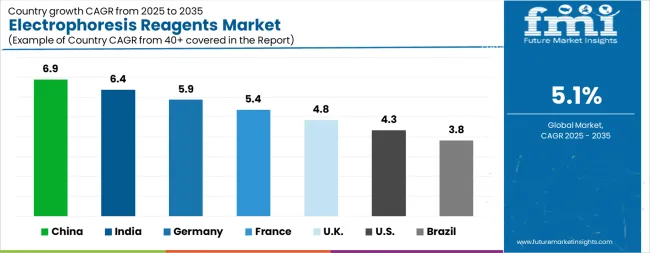
Analysis of Electrophoresis Reagents Market By Key Countries

Electrophoresis Reagents Market Cagr Analysis By Country

Country CAGR
China 6.9%
India 6.4%
Germany 5.9%
France 5.4%
UK 4.8%
USA 4.3%
Brazil 3.8%

Country-wise Analysis

The Electrophoresis Reagents Market is expected to register a CAGR of 5.1% during the forecast period, exhibiting varied country level momentum. China leads with the highest CAGR of 6.9%, followed by India at 6.4%. Developed markets such as Germany, France, and the UK continue to expand steadily, while the USA is likely to grow at consistent rates. Brazil posts the lowest CAGR at 3.8%, yet still underscores a broadly positive trajectory for the global Electrophoresis Reagents Market. In 2024, Germany held a dominant revenue in the Western Europe market and is expected to grow with a CAGR of 5.9%. The USA Electrophoresis Reagents Market is estimated to be valued at USD 1.1 billion in 2025 and is anticipated to reach a valuation of USD 1.6 billion by 2035. Sales are projected to rise at a CAGR of 4.3% over the forecast period between 2025 and 2035. While Japan and South Korea markets are estimated to be valued at USD 146.9 million and USD 82.7 million respectively in 2025.
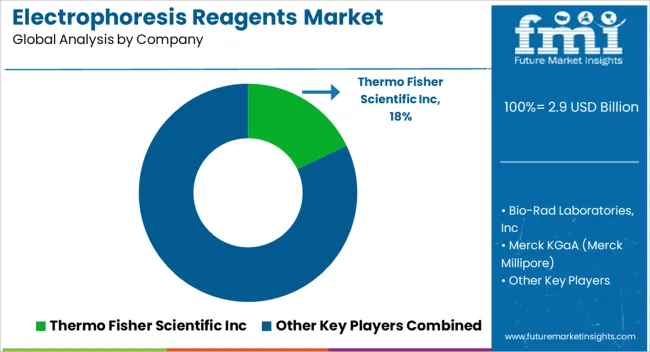
Key Players in the Electrophoresis Reagents Market

Electrophoresis Reagents Market Analysis By Company

  • Thermo Fisher Scientific Inc
  • Bio-Rad Laboratories, Inc
  • Merck KGaA (Merck Millipore)
  • Agilent Technologies Inc
  • GE Healthcare
  • Sigma-Aldrich Corporation
  • Lonza Group Ltd
  • Promega Corporation
  • Takara Bio Inc.
  • QIAGEN N.V.

Scope of the Report

Item Value
Quantitative Units USD 2.9 Billion
Product Type Gels, Dyes, Buffers, and Others
End User Academic Institutions, Pharmaceutical & Biotechnology Industry, Hospitals, and Diagnostic Centers
Regions Covered North America, Europe, Asia-Pacific, Latin America, Middle East & Africa
Country Covered United States, Canada, Germany, France, United Kingdom, China, Japan, India, Brazil, South Africa
Key Companies Profiled Thermo Fisher Scientific Inc, Bio-Rad Laboratories, Inc, Merck KGaA (Merck Millipore), Agilent Technologies Inc, GE Healthcare, Sigma-Aldrich Corporation, Lonza Group Ltd, Promega Corporation, Takara Bio Inc., and QIAGEN N.V.

Electrophoresis Reagents Market by Segments

Product Type:

  • Gels
  • Dyes
  • Buffers
  • Others

End User:

  • Academic Institutions
  • Pharmaceutical & Biotechnology Industry
  • Hospitals
  • Diagnostic Centers

Region:

  • North America
    • USA
    • Canada
    • Mexico
  • Latin America
    • Brazil
    • Chile
    • Rest of Latin America
  • Western Europe
    • Germany
    • UK
    • Italy
    • Spain
    • France
    • Nordic
    • BENELUX
    • Rest of Western Europe
  • Eastern Europe
    • Russia
    • Poland
    • Hungary
    • Balkan & Baltic
    • Rest of Eastern Europe
  • East Asia
    • China
    • Japan
    • South Korea
  • South Asia and Pacific
    • India
    • ASEAN
    • Australia & New Zealand
    • Rest of South Asia and Pacific
  • Middle East & Africa
    • Kingdom of Saudi Arabia
    • Other GCC Countries
    • Turkiye
    • South Africa
    • Other African Union
    • Rest of Middle East & Africa

Table of Content

  1. Executive Summary
    • Global Market Outlook
    • Demand-side Trends
    • Supply-side Trends
    • Technology Roadmap Analysis
    • Analysis and Recommendations
  2. Market Overview
    • Market Coverage / Taxonomy
    • Market Definition / Scope / Limitations
  3. Market Background
    • Market Dynamics
      • Drivers
      • Restraints
      • Opportunity
      • Trends
    • Scenario Forecast
      • Demand in Optimistic Scenario
      • Demand in Likely Scenario
      • Demand in Conservative Scenario
    • Opportunity Map Analysis
    • Product Life Cycle Analysis
    • Supply Chain Analysis
    • Investment Feasibility Matrix
    • Value Chain Analysis
    • PESTLE and Porter’s Analysis
    • Regulatory Landscape
    • Regional Parent Market Outlook
    • Production and Consumption Statistics
    • Import and Export Statistics
  4. Global Market Analysis 2020 to 2024 and Forecast, 2025 to 2035
    • Historical Market Size Value (USD Million) Analysis, 2020 to 2024
    • Current and Future Market Size Value (USD Million) Projections, 2025 to 2035
      • Y-o-Y Growth Trend Analysis
      • Absolute $ Opportunity Analysis
  5. Global Market Pricing Analysis 2020 to 2024 and Forecast 2025 to 2035
  6. Global Market Analysis 2020 to 2024 and Forecast 2025 to 2035, By Product Type
    • Introduction / Key Findings
    • Historical Market Size Value (USD Million) Analysis By Product Type , 2020 to 2024
    • Current and Future Market Size Value (USD Million) Analysis and Forecast By Product Type , 2025 to 2035
      • Gels
      • Dyes
      • Buffers
      • Others
    • Y-o-Y Growth Trend Analysis By Product Type , 2020 to 2024
    • Absolute $ Opportunity Analysis By Product Type , 2025 to 2035
  7. Global Market Analysis 2020 to 2024 and Forecast 2025 to 2035, By End User
    • Introduction / Key Findings
    • Historical Market Size Value (USD Million) Analysis By End User, 2020 to 2024
    • Current and Future Market Size Value (USD Million) Analysis and Forecast By End User, 2025 to 2035
      • Academic Institutions
      • Pharmaceutical & Biotechnology Industry
      • Hospitals
      • Diagnostic Centers
    • Y-o-Y Growth Trend Analysis By End User, 2020 to 2024
    • Absolute $ Opportunity Analysis By End User, 2025 to 2035
  8. Global Market Analysis 2020 to 2024 and Forecast 2025 to 2035, By Region
    • Introduction
    • Historical Market Size Value (USD Million) Analysis By Region, 2020 to 2024
    • Current Market Size Value (USD Million) Analysis and Forecast By Region, 2025 to 2035
      • North America
      • Latin America
      • Western Europe
      • Eastern Europe
      • East Asia
      • South Asia and Pacific
      • Middle East & Africa
    • Market Attractiveness Analysis By Region
  9. North America Market Analysis 2020 to 2024 and Forecast 2025 to 2035, By Country
    • Historical Market Size Value (USD Million) Trend Analysis By Market Taxonomy, 2020 to 2024
    • Market Size Value (USD Million) Forecast By Market Taxonomy, 2025 to 2035
      • By Country
        • USA
        • Canada
        • Mexico
      • By Product Type
      • By End User
    • Market Attractiveness Analysis
      • By Country
      • By Product Type
      • By End User
    • Key Takeaways
  10. Latin America Market Analysis 2020 to 2024 and Forecast 2025 to 2035, By Country
    • Historical Market Size Value (USD Million) Trend Analysis By Market Taxonomy, 2020 to 2024
    • Market Size Value (USD Million) Forecast By Market Taxonomy, 2025 to 2035
      • By Country
        • Brazil
        • Chile
        • Rest of Latin America
      • By Product Type
      • By End User
    • Market Attractiveness Analysis
      • By Country
      • By Product Type
      • By End User
    • Key Takeaways
  11. Western Europe Market Analysis 2020 to 2024 and Forecast 2025 to 2035, By Country
    • Historical Market Size Value (USD Million) Trend Analysis By Market Taxonomy, 2020 to 2024
    • Market Size Value (USD Million) Forecast By Market Taxonomy, 2025 to 2035
      • By Country
        • Germany
        • UK
        • Italy
        • Spain
        • France
        • Nordic
        • BENELUX
        • Rest of Western Europe
      • By Product Type
      • By End User
    • Market Attractiveness Analysis
      • By Country
      • By Product Type
      • By End User
    • Key Takeaways
  12. Eastern Europe Market Analysis 2020 to 2024 and Forecast 2025 to 2035, By Country
    • Historical Market Size Value (USD Million) Trend Analysis By Market Taxonomy, 2020 to 2024
    • Market Size Value (USD Million) Forecast By Market Taxonomy, 2025 to 2035
      • By Country
        • Russia
        • Poland
        • Hungary
        • Balkan & Baltic
        • Rest of Eastern Europe
      • By Product Type
      • By End User
    • Market Attractiveness Analysis
      • By Country
      • By Product Type
      • By End User
    • Key Takeaways
  13. East Asia Market Analysis 2020 to 2024 and Forecast 2025 to 2035, By Country
    • Historical Market Size Value (USD Million) Trend Analysis By Market Taxonomy, 2020 to 2024
    • Market Size Value (USD Million) Forecast By Market Taxonomy, 2025 to 2035
      • By Country
        • China
        • Japan
        • South Korea
      • By Product Type
      • By End User
    • Market Attractiveness Analysis
      • By Country
      • By Product Type
      • By End User
    • Key Takeaways
  14. South Asia and Pacific Market Analysis 2020 to 2024 and Forecast 2025 to 2035, By Country
    • Historical Market Size Value (USD Million) Trend Analysis By Market Taxonomy, 2020 to 2024
    • Market Size Value (USD Million) Forecast By Market Taxonomy, 2025 to 2035
      • By Country
        • India
        • ASEAN
        • Australia & New Zealand
        • Rest of South Asia and Pacific
      • By Product Type
      • By End User
    • Market Attractiveness Analysis
      • By Country
      • By Product Type
      • By End User
    • Key Takeaways
  15. Middle East & Africa Market Analysis 2020 to 2024 and Forecast 2025 to 2035, By Country
    • Historical Market Size Value (USD Million) Trend Analysis By Market Taxonomy, 2020 to 2024
    • Market Size Value (USD Million) Forecast By Market Taxonomy, 2025 to 2035
      • By Country
        • Kingdom of Saudi Arabia
        • Other GCC Countries
        • Turkiye
        • South Africa
        • Other African Union
        • Rest of Middle East & Africa
      • By Product Type
      • By End User
    • Market Attractiveness Analysis
      • By Country
      • By Product Type
      • By End User
    • Key Takeaways
  16. Key Countries Market Analysis
    • USA
      • Pricing Analysis
      • Market Share Analysis, 2024
        • By Product Type
        • By End User
    • Canada
      • Pricing Analysis
      • Market Share Analysis, 2024
        • By Product Type
        • By End User
    • Mexico
      • Pricing Analysis
      • Market Share Analysis, 2024
        • By Product Type
        • By End User
    • Brazil
      • Pricing Analysis
      • Market Share Analysis, 2024
        • By Product Type
        • By End User
    • Chile
      • Pricing Analysis
      • Market Share Analysis, 2024
        • By Product Type
        • By End User
    • Germany
      • Pricing Analysis
      • Market Share Analysis, 2024
        • By Product Type
        • By End User
    • UK
      • Pricing Analysis
      • Market Share Analysis, 2024
        • By Product Type
        • By End User
    • Italy
      • Pricing Analysis
      • Market Share Analysis, 2024
        • By Product Type
        • By End User
    • Spain
      • Pricing Analysis
      • Market Share Analysis, 2024
        • By Product Type
        • By End User
    • France
      • Pricing Analysis
      • Market Share Analysis, 2024
        • By Product Type
        • By End User
    • India
      • Pricing Analysis
      • Market Share Analysis, 2024
        • By Product Type
        • By End User
    • ASEAN
      • Pricing Analysis
      • Market Share Analysis, 2024
        • By Product Type
        • By End User
    • Australia & New Zealand
      • Pricing Analysis
      • Market Share Analysis, 2024
        • By Product Type
        • By End User
    • China
      • Pricing Analysis
      • Market Share Analysis, 2024
        • By Product Type
        • By End User
    • Japan
      • Pricing Analysis
      • Market Share Analysis, 2024
        • By Product Type
        • By End User
    • South Korea
      • Pricing Analysis
      • Market Share Analysis, 2024
        • By Product Type
        • By End User
    • Russia
      • Pricing Analysis
      • Market Share Analysis, 2024
        • By Product Type
        • By End User
    • Poland
      • Pricing Analysis
      • Market Share Analysis, 2024
        • By Product Type
        • By End User
    • Hungary
      • Pricing Analysis
      • Market Share Analysis, 2024
        • By Product Type
        • By End User
    • Kingdom of Saudi Arabia
      • Pricing Analysis
      • Market Share Analysis, 2024
        • By Product Type
        • By End User
    • Turkiye
      • Pricing Analysis
      • Market Share Analysis, 2024
        • By Product Type
        • By End User
    • South Africa
      • Pricing Analysis
      • Market Share Analysis, 2024
        • By Product Type
        • By End User
  17. Market Structure Analysis
    • Competition Dashboard
    • Competition Benchmarking
    • Market Share Analysis of Top Players
      • By Regional
      • By Product Type
      • By End User
  18. Competition Analysis
    • Competition Deep Dive
      • Thermo Fisher Scientific Inc
        • Overview
        • Product Portfolio
        • Profitability by Market Segments (Product/Age /Sales Channel/Region)
        • Sales Footprint
        • Strategy Overview
          • Marketing Strategy
          • Product Strategy
          • Channel Strategy
      • Bio-Rad Laboratories, Inc
      • Merck KGaA (Merck Millipore)
      • Agilent Technologies Inc
      • GE Healthcare
      • Sigma-Aldrich Corporation
      • Lonza Group Ltd
      • Promega Corporation
      • Takara Bio Inc.
      • QIAGEN N.V.
  19. Assumptions & Acronyms Used
  20. Research Methodology

List of Tables

  • Table 1: Global Market Value (USD Million) Forecast by Region, 2020-2035
  • Table 2: Global Market Value (USD Million) Forecast by Product Type , 2020-2035
  • Table 3: Global Market Value (USD Million) Forecast by End User, 2020-2035
  • Table 4: North America Market Value (USD Million) Forecast by Country, 2020-2035
  • Table 5: North America Market Value (USD Million) Forecast by Product Type , 2020-2035
  • Table 6: North America Market Value (USD Million) Forecast by End User, 2020-2035
  • Table 7: Latin America Market Value (USD Million) Forecast by Country, 2020-2035
  • Table 8: Latin America Market Value (USD Million) Forecast by Product Type , 2020-2035
  • Table 9: Latin America Market Value (USD Million) Forecast by End User, 2020-2035
  • Table 10: Western Europe Market Value (USD Million) Forecast by Country, 2020-2035
  • Table 11: Western Europe Market Value (USD Million) Forecast by Product Type , 2020-2035
  • Table 12: Western Europe Market Value (USD Million) Forecast by End User, 2020-2035
  • Table 13: Eastern Europe Market Value (USD Million) Forecast by Country, 2020-2035
  • Table 14: Eastern Europe Market Value (USD Million) Forecast by Product Type , 2020-2035
  • Table 15: Eastern Europe Market Value (USD Million) Forecast by End User, 2020-2035
  • Table 16: East Asia Market Value (USD Million) Forecast by Country, 2020-2035
  • Table 17: East Asia Market Value (USD Million) Forecast by Product Type , 2020-2035
  • Table 18: East Asia Market Value (USD Million) Forecast by End User, 2020-2035
  • Table 19: South Asia and Pacific Market Value (USD Million) Forecast by Country, 2020-2035
  • Table 20: South Asia and Pacific Market Value (USD Million) Forecast by Product Type , 2020-2035
  • Table 21: South Asia and Pacific Market Value (USD Million) Forecast by End User, 2020-2035
  • Table 22: Middle East & Africa Market Value (USD Million) Forecast by Country, 2020-2035
  • Table 23: Middle East & Africa Market Value (USD Million) Forecast by Product Type , 2020-2035
  • Table 24: Middle East & Africa Market Value (USD Million) Forecast by End User, 2020-2035

List of Figures

  • Figure 1: Global Market Pricing Analysis
  • Figure 2: Global Market Value (USD Million) Forecast 2020-2035
  • Figure 3: Global Market Value Share and BPS Analysis by Product Type , 2025 and 2035
  • Figure 4: Global Market Y-o-Y Growth Comparison by Product Type , 2025-2035
  • Figure 5: Global Market Attractiveness Analysis by Product Type
  • Figure 6: Global Market Value Share and BPS Analysis by End User, 2025 and 2035
  • Figure 7: Global Market Y-o-Y Growth Comparison by End User, 2025-2035
  • Figure 8: Global Market Attractiveness Analysis by End User
  • Figure 9: Global Market Value (USD Million) Share and BPS Analysis by Region, 2025 and 2035
  • Figure 10: Global Market Y-o-Y Growth Comparison by Region, 2025-2035
  • Figure 11: Global Market Attractiveness Analysis by Region
  • Figure 12: North America Market Incremental Dollar Opportunity, 2025-2035
  • Figure 13: Latin America Market Incremental Dollar Opportunity, 2025-2035
  • Figure 14: Western Europe Market Incremental Dollar Opportunity, 2025-2035
  • Figure 15: Eastern Europe Market Incremental Dollar Opportunity, 2025-2035
  • Figure 16: East Asia Market Incremental Dollar Opportunity, 2025-2035
  • Figure 17: South Asia and Pacific Market Incremental Dollar Opportunity, 2025-2035
  • Figure 18: Middle East & Africa Market Incremental Dollar Opportunity, 2025-2035
  • Figure 19: North America Market Value Share and BPS Analysis by Country, 2025 and 2035
  • Figure 20: North America Market Value Share and BPS Analysis by Product Type , 2025 and 2035
  • Figure 21: North America Market Y-o-Y Growth Comparison by Product Type , 2025-2035
  • Figure 22: North America Market Attractiveness Analysis by Product Type
  • Figure 23: North America Market Value Share and BPS Analysis by End User, 2025 and 2035
  • Figure 24: North America Market Y-o-Y Growth Comparison by End User, 2025-2035
  • Figure 25: North America Market Attractiveness Analysis by End User
  • Figure 26: Latin America Market Value Share and BPS Analysis by Country, 2025 and 2035
  • Figure 27: Latin America Market Value Share and BPS Analysis by Product Type , 2025 and 2035
  • Figure 28: Latin America Market Y-o-Y Growth Comparison by Product Type , 2025-2035
  • Figure 29: Latin America Market Attractiveness Analysis by Product Type
  • Figure 30: Latin America Market Value Share and BPS Analysis by End User, 2025 and 2035
  • Figure 31: Latin America Market Y-o-Y Growth Comparison by End User, 2025-2035
  • Figure 32: Latin America Market Attractiveness Analysis by End User
  • Figure 33: Western Europe Market Value Share and BPS Analysis by Country, 2025 and 2035
  • Figure 34: Western Europe Market Value Share and BPS Analysis by Product Type , 2025 and 2035
  • Figure 35: Western Europe Market Y-o-Y Growth Comparison by Product Type , 2025-2035
  • Figure 36: Western Europe Market Attractiveness Analysis by Product Type
  • Figure 37: Western Europe Market Value Share and BPS Analysis by End User, 2025 and 2035
  • Figure 38: Western Europe Market Y-o-Y Growth Comparison by End User, 2025-2035
  • Figure 39: Western Europe Market Attractiveness Analysis by End User
  • Figure 40: Eastern Europe Market Value Share and BPS Analysis by Country, 2025 and 2035
  • Figure 41: Eastern Europe Market Value Share and BPS Analysis by Product Type , 2025 and 2035
  • Figure 42: Eastern Europe Market Y-o-Y Growth Comparison by Product Type , 2025-2035
  • Figure 43: Eastern Europe Market Attractiveness Analysis by Product Type
  • Figure 44: Eastern Europe Market Value Share and BPS Analysis by End User, 2025 and 2035
  • Figure 45: Eastern Europe Market Y-o-Y Growth Comparison by End User, 2025-2035
  • Figure 46: Eastern Europe Market Attractiveness Analysis by End User
  • Figure 47: East Asia Market Value Share and BPS Analysis by Country, 2025 and 2035
  • Figure 48: East Asia Market Value Share and BPS Analysis by Product Type , 2025 and 2035
  • Figure 49: East Asia Market Y-o-Y Growth Comparison by Product Type , 2025-2035
  • Figure 50: East Asia Market Attractiveness Analysis by Product Type
  • Figure 51: East Asia Market Value Share and BPS Analysis by End User, 2025 and 2035
  • Figure 52: East Asia Market Y-o-Y Growth Comparison by End User, 2025-2035
  • Figure 53: East Asia Market Attractiveness Analysis by End User
  • Figure 54: South Asia and Pacific Market Value Share and BPS Analysis by Country, 2025 and 2035
  • Figure 55: South Asia and Pacific Market Value Share and BPS Analysis by Product Type , 2025 and 2035
  • Figure 56: South Asia and Pacific Market Y-o-Y Growth Comparison by Product Type , 2025-2035
  • Figure 57: South Asia and Pacific Market Attractiveness Analysis by Product Type
  • Figure 58: South Asia and Pacific Market Value Share and BPS Analysis by End User, 2025 and 2035
  • Figure 59: South Asia and Pacific Market Y-o-Y Growth Comparison by End User, 2025-2035
  • Figure 60: South Asia and Pacific Market Attractiveness Analysis by End User
  • Figure 61: Middle East & Africa Market Value Share and BPS Analysis by Country, 2025 and 2035
  • Figure 62: Middle East & Africa Market Value Share and BPS Analysis by Product Type , 2025 and 2035
  • Figure 63: Middle East & Africa Market Y-o-Y Growth Comparison by Product Type , 2025-2035
  • Figure 64: Middle East & Africa Market Attractiveness Analysis by Product Type
  • Figure 65: Middle East & Africa Market Value Share and BPS Analysis by End User, 2025 and 2035
  • Figure 66: Middle East & Africa Market Y-o-Y Growth Comparison by End User, 2025-2035
  • Figure 67: Middle East & Africa Market Attractiveness Analysis by End User
  • Figure 68: Global Market - Tier Structure Analysis
  • Figure 69: Global Market - Company Share Analysis

Frequently Asked Questions

How big is the electrophoresis reagents market in 2025?

The global electrophoresis reagents market is estimated to be valued at USD 2.9 billion in 2025.

What will be the size of electrophoresis reagents market in 2035?

The market size for the electrophoresis reagents market is projected to reach USD 4.8 billion by 2035.

How much will be the electrophoresis reagents market growth between 2025 and 2035?

The electrophoresis reagents market is expected to grow at a 5.1% CAGR between 2025 and 2035.

What are the key product types in the electrophoresis reagents market?

The key product types in electrophoresis reagents market are gels, dyes, buffers and others.

Which end user segment to contribute significant share in the electrophoresis reagents market in 2025?

In terms of end user, academic institutions segment to command 38.7% share in the electrophoresis reagents market in 2025.

Explore Similar Insights

Future Market Insights

Electrophoresis Reagents Market

Chat With

MaRIA

Hi There, I am MaRIA, Your Market Research Intelligence Assistant. How may I help you?