
- Market Size (2026)
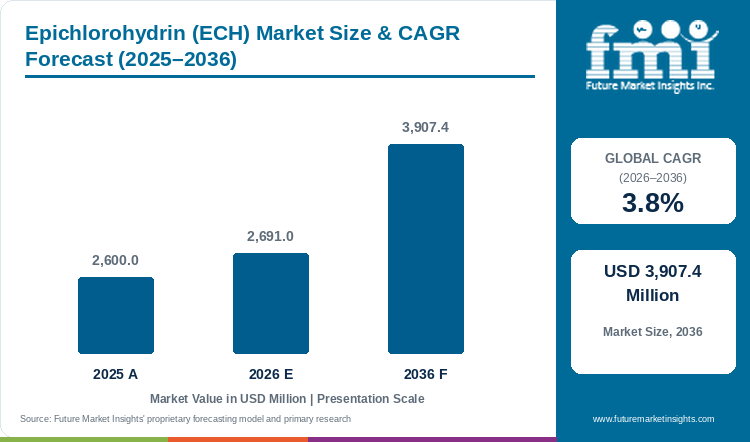
- USD 2691.0 Mn
- Forecast (2036)
- USD 3907.4 Mn
- CAGR (2026 to 2036)
- 3.8%
How big is the Epichlorohydrin (ECH) Market in 2026?
By 2036, FMI expects the global epichlorohydrin market to reach USD 3,907.4 million, growing at 3.8% a year from 2026 to 2036. The market was valued at USD 2,600.0 million in 2025. FMI estimates USD 2,691.0 million for 2026.
Epichlorohydrin (ECH) Market Size and Forecast
Table 1: Epichlorohydrin (ECH) Market Size and Forecast
| Market size and forecast | Value |
|---|---|
| Market size in 2025 | USD 2,600.0 million |
| Estimated market size in 2026 | USD 2,691.0 million |
| Projected market size by 2036 | USD 3,907.4 million |
| CAGR from 2026 to 2036 | 3.8% |
Source: Future Market Insights analysis of the epichlorohydrin (ECH) market, 2026.
The purchasing contest is between integrated petrochemical assets and newer glycerin-based supply. A supplier therefore needs a competitive route into resin production as well as available ECH. Grasim commenced commercial production at its 50,000-tonne-a-year Vilayat plant on 21 October 2026. Its regulatory filing describes a further extension of the company's chlor-alkali derivatives business. That addition creates another domestic supply option for Indian resin manufacturers.
Trade measures also change the location of resin conversion. In July 2025 the European Commission imposed definitive anti-dumping duties on epoxy resins from China, Taiwan and Thailand. They affect where a resin producer can profitably sell the output that consumes ECH. FMI expects sales growth to depend on selective expansion of resin production, replacement of imported feedstock and qualification of renewable-carbon material.
Key Market Trends & Insights
- ECH value is moving differently from tonnage. Spolchemie's epoxy-resin business recorded an approximately 8.0% sales decline in 2024 despite stabilized volumes.
- Residual monomer limits add a specification layer beyond ECH purity. WHO's provisional drinking-water guideline for ECH is 0.4 micrograms per litre, so resin makers must control residual monomer in the consuming resin.
- European resin buyers keep an established monomer supply connection to Asia. Thailand reported 3,035.4 tonnes of ECH exports to Belgium in 2025, separate from the downstream resin trade covered by anti-dumping measures.
Regional Highlights
- Share of global revenue grows for China and India. FMI projects China from 42.0% to 44.8% and India from 4.0% to 4.9% over 2026 to 2036.
- Revenue rises in the United States, Germany and Japan, though each loses global share. The 2036 outlook has the United States at 9.7% against 11.0% in 2026, Germany at 5.3% against 6.0% in 2026 and Japan at 4.4% against 5.0% in 2026.
Analyst Perspective
“Feedstock flexibility will matter most when it is matched with an economical route to qualified resin customers. Renewable carbon provides a basis for differentiation, but a producer still needs predictable purity and competitive delivered economics. Expansion in India and established Asian export routes will test the position of older merchant supply. The strongest commercial offers will make the source and specification of ECH clear while linking production commitments to credible downstream demand.”
- Nikhil Kaitwade, Principal Consultant, FMI
How is the Epichlorohydrin (ECH) Market segmented?
- By process: Propylene-based, Glycerin-based, and Other Routes.
- By application: Epoxy Resins, Synthetic Glycerin, Water Treatment and Paper Resins, and Surfactants and Other.
- By end use: Paints and Coatings, Electronics and Composites, Construction and Adhesives, Wind and Transportation, and Other.
- By region: North America, Latin America, Western Europe, East Asia, South Asia and Southeast Asia, and Rest of world.
Why does the Propylene-based segment lead by Process in the Epichlorohydrin (ECH) Market in 2026?
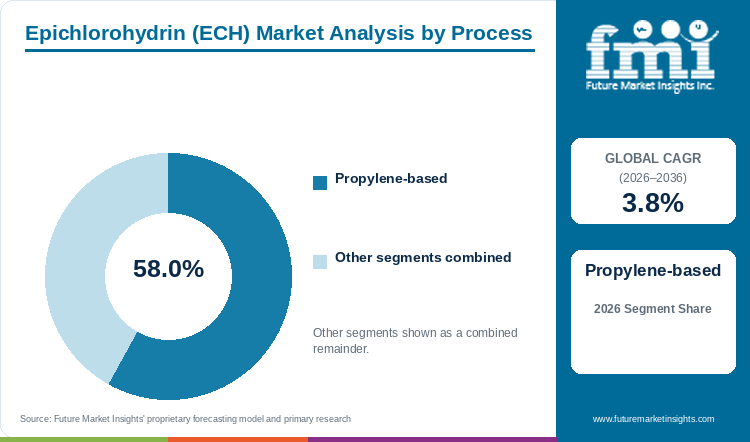
The Propylene-based segment holds 58.0% of the Epichlorohydrin (ECH) Market by process in 2026.
The conventional route benefits from integration with chlorine and downstream epoxy assets. Olin's annual filing identifies propylene, chlorine and caustic soda among the inputs supporting its allylics and aromatics chain. FMI interprets this as an important reason an established plant can remain competitive even as an alternative production route gains share. The operating decision concerns the economics of a linked asset base.
Glycerin-based production presents a different offer. AGC markets EPINITY as ECH made with renewable carbon from glycerol, while another producer describes its own glycerin route. The vegetable glycerin market is therefore relevant to raw-material availability and competing uses.
FMI forecasts glycerin-based ECH to increase its process share from 38.0% in 2026 to 43.1% by 2036. Propylene-based revenue still grows at 2.9% annually over the same period. The likely result is gradual mix change across a growing market. Suppliers with existing integrated assets have time to adjust commercial terms, but new capital must withstand competition from both routes.
Glycerin-based and Other Routes together hold the remaining 42.0% by process.
Table 2: Process, 2026 Share
| Leading Share | 2026 market share |
|---|---|
| Propylene-based | 58.0% |
| All Other Segments Combined Share | 42.0% |
Source: Future Market Insights analysis of the epichlorohydrin (ECH) market, 2026.
Why does the Epoxy Resins segment lead by Application in the Epichlorohydrin (ECH) Market in 2026?
The Epoxy Resins segment holds 74.0% of the Epichlorohydrin (ECH) Market by application in 2026.
Epoxy resins concentrate ECH demand in plants whose output serves several industries. HELM identifies resin production as a core application for its ECH offer. Demand therefore responds to the resin plant's customer mix and production decisions before it appears as an order for monomer. A strong coatings season and a weaker electronics cycle need not affect every ECH supplier equally.
The epoxy curing agent market provides a useful downstream comparison because resin systems are sold alongside application-specific curing requirements.
Water-treatment and paper resins remain a separate purchasing channel with 10.0% of application revenue in 2026. Their specifications place particular emphasis on residual monomer. WHO explains that control of ECH in treated drinking water rests on limiting the residual content of flocculants and their dose. These applications sustain specialist accounts at a smaller scale than epoxy demand. FMI's 4.1% forecast CAGR for the epoxy-resin application is consequently a central influence on the overall market.
Synthetic Glycerin, Water Treatment and Paper Resins and Surfactants and Other together hold the remaining 26.0% by application.
Table 3: Application, 2026 Share
| Leading Share | 2026 market share |
|---|---|
| Epoxy Resins | 74.0% |
| All Other Segments Combined Share | 26.0% |
Source: Future Market Insights analysis of the epichlorohydrin (ECH) market, 2026.
Why does the Paints and Coatings segment lead by End Use in the Epichlorohydrin (ECH) Market in 2026?
The Paints and Coatings segment holds 30.0% of the Epichlorohydrin (ECH) Market by end use in 2026.
Coatings provide several outlets for epoxy resin production, including industrial protection and construction-related systems. Their importance to ECH is visible in the European Commission's description of the downstream epoxy market. ECH suppliers sell into the resin chain, so a coating contract reaches them as resin purchases.
The epoxy paint market is one downstream expression of this demand. Its commercial cycle includes both new applications and maintenance purchasing. For ECH producers, the relevant signal is the resulting change in resin production.
FMI forecasts coatings-related ECH revenue to rise from USD 807.3 million in 2026 to USD 1,111.6 million in 2036. Its share nevertheless falls to 28.4%. Electronics and composites reach 30.7% by the end of the period. The end-use mix therefore calls for differentiated account coverage.
Electronics and Composites, Construction and Adhesives, Wind and Transportation and Other together hold the remaining 70.0% by end use.
Table 4: End Use, 2026 Share
| Leading Share | 2026 market share |
|---|---|
| Paints and Coatings | 30.0% |
| All Other Segments Combined Share | 70.0% |
Source: Future Market Insights analysis of the epichlorohydrin (ECH) market, 2026.
What are the key drivers restraints and opportunities?
Resin production remains the main demand driver. Feedstock exposure and uneven downstream profitability limit expansion, while renewable-carbon supply and regional sourcing open additional business.
Driver
Growth in epoxy-resin applications increases ECH purchasing across coatings, composites and construction-related systems.
Restraint
Additional ECH capacity can outpace profitable resin conversion, putting pressure on merchant prices and operating decisions.
Opportunity
Regional production and documented renewable-carbon material create alternatives for buyers reviewing supply concentration and product claims.
How do purchasing rules and qualification affect epichlorohydrin (ECH) market demand?
The clearest growth mechanism is integration between chlor-alkali derivatives and epoxy production. Grasim's Vilayat startup adds installed ECH capacity within an established chemicals group. A local producer can compete for domestic resin demand while adjusting its position between intermediate and downstream sales. Customer qualification and utilization after commissioning determine how much of that capacity becomes recurring business.
FMI expects India to record the fastest growth among the ten countries examined. China still retains the largest market value. These two findings imply different selling priorities. Indian expansion offers opportunities to establish new supply relationships. China's scale makes account retention and route efficiency more consequential. For a global supplier, a single price policy would overlook that difference.
What limits reliable epichlorohydrin (ECH) market supply and quality?
A resin plant can reduce ECH purchases even when the end-use market retains long-term potential. Olin confirmed in its January 2026 earnings call that the Guarujá epoxy plants had closed that month. The change concerns downstream resin capacity.
Process choice adds another exposure. Glycerin procurement links ECH economics to a feedstock with other commercial uses. Propylene-based operations remain exposed to their own integrated petrochemical cost structure. Buyers seeking a second route must still compare product specifications and delivered economics. Merely replacing one feedstock label with another does not settle the purchasing decision.
Where can suppliers win additional business in the epichlorohydrin (ECH) market?
Renewable-carbon ECH offers a basis for supply differentiation where downstream customers need to substantiate material claims. AGC's product information identifies glycerol as the renewable input to EPINITY. The opportunity is strongest where a resin customer can carry that documentation into its own product offer. A claim about feedstock origin should remain distinct from a claim about the finished product's total environmental impact.
Specialist water-treatment resin accounts provide another route to value. The water and wastewater treatment chemicals market contains many chemistries, of which ECH-derived resins are only a part. Suppliers should target the specific polymer manufacturers that consume ECH. Reliable residual-monomer control has more commercial relevance here than a broad claim about municipal water spending.
Epichlorohydrin (ECH) Market by Country (2026 to 2036)
Table 5: Epichlorohydrin (ECH) Market Country Growth Forecast
| Country | CAGR, 2026 to 2036 |
|---|---|
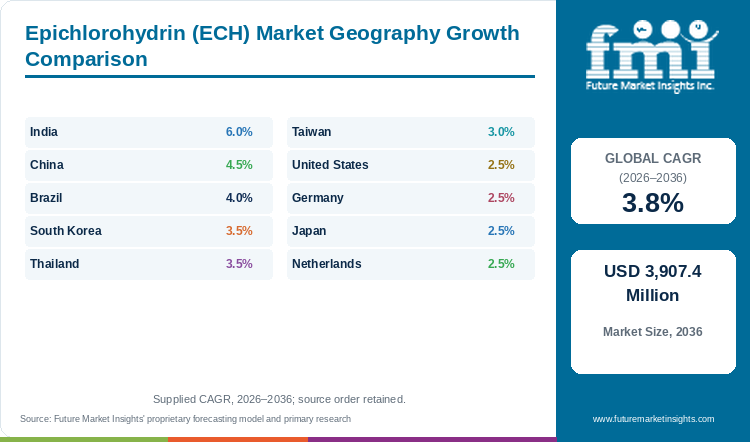
| India | 6.0% |
| China | 4.5% |
| Brazil | 4.0% |
| South Korea | 3.5% |
| Thailand | 3.5% |
| Taiwan | 3.0% |
| United States | 2.5% |
| Germany | 2.5% |
| Japan | 2.5% |
| Netherlands | 2.5% |
Source: Future Market Insights analysis of the epichlorohydrin (ECH) market, 2026.
India
The Vilayat startup gives India a concrete addition to domestic ECH supply. Grasim notified the stock exchanges that commercial production began on 21 October 2026 at a plant with 50,000 tonnes of annual installed capacity. The filing establishes operating commencement.
India records the fastest growth among the ten national markets examined. FMI forecasts a 6.0% CAGR between 2026 and 2036, with revenue increasing from USD 107.6 million to USD 192.2 million. The commercial opening is a change in the range of domestic sourcing options as well as higher demand. New supply can compete with imports once resin customers have accepted the product and purchasing terms. Growth of USD 84.6 million leaves India second among the ten named countries. Global revenue share for India increases from 4.0% to 4.9%. From 2026 to 2036, revenue in India rises 1.8 times and global revenue 1.5 times.
Trade history shows why the transition matters. Thailand reported 31,631.6 tonnes of ECH exports to India in 2025. It nevertheless identifies an established external route against which domestic suppliers will compete.
India's DGTR also completed an ECH anti-dumping investigation involving China, South Korea and Thailand in August 2024. The investigation record must be distinguished from a current customs-duty schedule. For buyers, origin and the applicable import terms require attention alongside price. FMI expects the strongest domestic offers to combine an acceptable specification with commercial flexibility during customer conversion.
China
China's ECH market is large enough for production route and downstream integration to shape competition within the country. Shandong Haili's corporate product listing includes ECH alongside chlor-alkali products. Jiangsu Yangnong Chemical Group describes glycerin-based and hydrogen-peroxide-based ECH processes. A resin customer's specification, location and purchasing arrangement remain relevant to the allocation of orders.
FMI estimates Chinese revenue at USD 1,130.2 million in 2026 and USD 1,750.4 million in 2036. The resulting country outlook carries a 4.5% CAGR for 2026 to 2036. Domestic producers must weigh new resin accounts against price competition in established industrial clusters. China moves from 42.0% of global revenue in 2026 to 44.8% in 2036. Growth of USD 620.2 million leaves China first among the ten named countries. Measured by 2026 revenue, China sits first of ten. China compounds at 4.5%, which is 0.7 points above the global 3.8%.
Export access creates an additional consideration. European duties introduced in July 2025 apply to selected epoxy resin imports from China. The direct duty falls downstream of ECH, but it can influence the production plans of export-oriented resin customers. An ECH seller with several domestic application outlets is less dependent on a single export channel than one tied to a narrowly focused resin account. FMI consequently sees China's growth opportunity in the quality of customer allocation as well as the scale of its production base.
Brazil
Brazil's ECH outlook must be read alongside changes in domestic resin conversion. One epoxy producer confirmed on 30 January 2026 that its Guarujá epoxy plants had closed that month. This changes a downstream outlet for ECH. The important distinction for suppliers is the product and location of the capacity removed. A resin shutdown should not be counted as the closure of an ECH manufacturing plant.
FMI forecasts Brazilian ECH revenue to increase from USD 53.8 million in 2026 to USD 79.5 million by 2036. The country CAGR is 4.0% for 2026 to 2036. Growth in the national market can coexist with the withdrawal of one resin unit. Customers can change supplier and product sourcing arrangements while other chemical applications continue to purchase ECH.
The commercial issue is where conversion takes place. A shift toward imported resin can reduce local monomer purchasing for a particular chain even when finished-system demand grows. Conversely, an operating local converter remains an ECH customer. The two outcomes require different sales coverage and should not be combined into a single downstream-consumption assumption.
For suppliers serving Brazil, the implication is to validate the status and product mix of individual accounts before committing volume. FMI expects selective growth to reward an accurate view of the remaining conversion base. A broad construction or coatings indicator is insufficient to prove that a specific ECH buyer will expand.
South Korea
South Korea's role is visible in actual ECH trading relationships. Thailand reported 20,938.9 tonnes shipped to South Korea in 2025. It nevertheless establishes a substantial purchasing connection between Korean buyers and a Southeast Asian supply origin.
Resin export conditions provide a separate commercial distinction. The European Commission terminated the Korean part of its epoxy-resin investigation in 2025 because it found insufficient evidence of dumping. That outcome differs from the measures imposed on China, Taiwan and Thailand. For ECH sellers, the practical implication is to assess the export position of each resin customer before assuming that all Asian accounts face the same market access.
FMI expects South Korean ECH sales to rise from USD 161.5 million in 2026 to USD 227.1 million in 2036. The country CAGR is 3.5% for 2026 to 2036. The opportunity is therefore larger than the pace forecast for Japan and Germany, although growth alone does not settle the choice between domestic and imported feedstock. South Korea's 3.5% CAGR sits 0.3 points below the global 3.8%. South Korea holds joint third place by 2026 revenue.
Commercial offers should follow the resin producer's application requirements and export commitments. A buyer serving several destinations may value an additional qualified ECH origin even when current supply is sufficient. The business case rests on continuity and competitive conversion, not on an assumed shortage inferred from import volumes.
Thailand
Thailand has a differentiated offer in glycerin-based ECH. AGC Chemicals Europe identifies EPINITY as a renewable-carbon product made in Thailand using glycerol. The feedstock route gives resin customers a defined material-origin proposition. It is more specific than a general environmental claim, although the final resin still needs its own documentation and appropriate boundaries for any product-level assertion.
The country's importance also extends through exports. Its reported 2025 ECH destinations include South Korea, India and the Netherlands. These relationships create exposure to several downstream resin markets. A supplier's commercial performance therefore depends on conditions outside Thailand as well as domestic chemical demand.
FMI forecasts Thai market revenue of USD 107.6 million in 2026 and USD 151.4 million in 2036, representing a 3.5% CAGR over 2026 to 2036. The opportunity concerns domestic value growth alongside the continued ability of Thai plants to compete internationally. These are related but separate measures of commercial activity. In the epichlorohydrin market, Thailand adds USD 43.8 million, ranking seventh for increase. Global revenue attributed to Thailand is 4.0% in 2026 and 3.9% in 2036.
Ownership history is relevant to supplier identification. Solvay completed the disposal of its Vinythai stake to AGC in 2017. A resin customer should align its supplier qualification with the current legal and manufacturing entity. This keeps the renewable-carbon proposition attached to the actual producer.
Taiwan
Taiwan's chemical-management framework gives ECH procurement an explicit regulatory context. The Chemical Administration lists epichlorohydrin as a Class 2 toxic chemical under CAS 106-89-8 and identifies approved categories of use. This is a practical boundary for chemical operators and distributors.
FMI projects revenue to increase from USD 134.6 million in 2026 to USD 180.3 million in 2036. The forecast CAGR is 3.0% over 2026 to 2036. Growth depends on actual resin and chemical conversion within that regulated supply chain. A forecast for the value of finished electronic products would be too remote to serve as a direct ECH volume measure. Global revenue share for Taiwan decreases from 5.0% to 4.6%. Taiwan records a USD 45.7 million increase, fifth of the ten.
Taiwanese resin exporters face another defined issue. The European Commission imposed epoxy-resin duties of 10.8% to 11.0% for Taiwan in July 2025. These concern downstream resin products. They can affect the economics of particular export accounts without constituting a tax on every ECH shipment.
The resulting procurement priorities vary by customer. A resin plant serving export markets must consider destination access when planning its monomer purchases. A local specialty-chemical buyer has a different exposure. FMI expects suppliers that distinguish those account types to make more credible volume commitments than those applying one electronics-led growth story to the whole country.
United States
The United States combines an integrated production position with access to imported material. One producer identifies Freeport as part of its allylics and epoxy manufacturing chain. Thailand's 2025 export returns also record shipments of ECH to the United States. These are distinct sourcing routes and their coexistence is more informative for buyers than assuming that domestic production eliminates import competition.
For American resin manufacturers, the relevant comparison is an equivalent specification delivered to the consuming site. A domestic offer may differ from imported material in transport arrangements and commercial lead time. Those differences should be negotiated against the buyer's production schedule. The evidence of imports does not by itself establish a national shortage or a permanent landed-cost advantage for one origin.
FMI forecasts US ECH revenue to grow from USD 296.0 million in 2026 to USD 377.9 million in 2036, with a 2.5% CAGR over 2026 to 2036. The moderate pace favours careful allocation of capital and sustained service to existing resin accounts. United States revenue increases 1.3 times, below the 1.5 times for the world total.
Supplier identity also needs care. The former Dow global epoxy and chlorinated-organics businesses transferred to their current owner in 2015. Treating the inherited assets as two separate current ECH offers would distort supplier concentration. For procurement teams, an accurate legal seller and production-site reference are essential starting points for a meaningful comparison.
Germany
German ECH purchasing sits within a European resin chain that competes on both cost and product specialization. The same producer lists Stade among the locations supporting its allylics and aromatics business. This provides a documented connection between local industrial infrastructure and upstream epoxy inputs.
The country outlook advances at a 2.5% CAGR from 2026 to 2036. FMI forecasts revenue of USD 161.5 million in 2026 and USD 206.1 million by 2036. At this pace, the commercial task is to preserve profitable resin conversion and maintain qualified accounts. A large new intermediate project would need a more specific customer case than the national growth rate alone provides. At 2.5%, the CAGR for Germany is 1.3 points below the global 3.8%. Germany shares third place on 2026 revenue across the ten countries.
The European Commission's 2025 epoxy-resin measures alter one part of that case by changing the terms for selected imports. Energy, operating configuration and the value of specialized products remain relevant to production choices. Producers should therefore avoid treating trade protection as a substitute for competitive conversion economics.
Renewable-carbon offers provide another option within the wider European supply base. Their relevance depends on whether German resin customers can substantiate and sell the resulting product distinction. FMI expects targeted application work to carry more weight than a general sustainability claim with no defined commercial outlet.
Japan
Osaka Soda's current corporate profile lists ECH and allyl chloride among its basic chemicals. Its functional-chemicals portfolio separately includes epichlorohydrin rubber. A producer's involvement in both monomer and specialty-polymer products does not make the revenues interchangeable, and rubber sales cannot simply be added to ECH market value.
Japan's outlook reaches USD 171.8 million by 2036 from USD 134.6 million in 2026. FMI forecasts a 2.5% CAGR during 2026 to 2036. The country presents a comparatively measured expansion case. Suppliers need to maintain existing qualified uses while selecting new accounts with a clear application requirement. Broad claims about electronics growth are insufficient to establish an ECH order without a resin conversion link. By absolute increase, Japan ranks eighth with USD 37.2 million over the decade.
Imports also form part of the supply picture. Thailand's 2025 returns identify ECH shipments to Japan. The record demonstrates cross-border availability but says little about the specification or contract structure of each shipment. A Japanese buyer considering another origin would still compare consistency and delivery terms at the level of its own process.
FMI sees the more defensible commercial opportunity in precise account coverage. Established basic-chemical supply, downstream specialty uses and imported alternatives create several forms of competition. An ECH supplier that separates these channels can focus technical and commercial resources where a change in source is feasible.
Netherlands
The Netherlands appears as a receiving destination in Thailand's ECH trade returns. Reported shipments reached 4,348.5 tonnes in 2025. Material entering a trading destination can also move onward, so gross trade must remain separate from domestic demand.
FMI estimates the Dutch ECH market at USD 80.7 million in 2026 and USD 103.1 million by 2036. A 2.5% CAGR is forecast across 2026 to 2036. The modest rate favours disciplined stock and contract management. The Netherlands moves from 3.0% of global revenue in 2026 to 2.6% in 2036. In the epichlorohydrin market, the Netherlands contributes USD 22.4 million of new revenue, last of ten. In the epichlorohydrin market, the Netherlands' 2026 revenue ranks ninth of ten. Revenue in the Netherlands multiplies 1.3 times by 2036, compared with 1.5 times worldwide.
The European resin trade framework adds a further distinction. Duties imposed in 2025 on selected Asian epoxy resins concern the finished intermediate resin category. The economics of importing monomer for European conversion may therefore differ from those of importing the resin itself. Monomer buyers still need to assess the economics of the consuming European resin plant.
FMI sees commercial value in matching imports to identifiable industrial demand and maintaining accurate documentation on origin and product scope. For distributors, the opportunity is to offer an economically useful supply position. Counting imported tonnes as Dutch consumption would overstate the size of that opportunity and obscure the role of onward trade.
Who are the notable companies in the Epichlorohydrin (ECH) Market?
Notable companies in the Epichlorohydrin (ECH) Market include Olin, Spolchemie, Shandong Haili Chemical, Jiangsu Yangnong Chemical, referring here to Jiangsu Yangnong Chemical Group and Aditya Birla Chemicals, through Grasim Industries.
Olin, Spolchemie and Jiangsu Yangnong Chemical Group illustrate three different ways of linking ECH to resin business. Olin operates an integrated epoxy chain. Spolchemie combines glycerin-based ECH with epoxy production in the Czech Republic. Yangnong's own portfolio describes alternative ECH routes alongside resin activity. Shandong Haili Chemical lists ECH in its Chinese chemical offer, while Osaka Soda places the product within a wider Japanese basic-chemicals portfolio.
Aditya Birla Chemicals is relevant through Grasim's new Vilayat plant. The commissioning creates a current operating reference for the group's Indian ECH position. The legal entity and production location matter when buyers assess an offer carrying a group brand.
Two distinctions prevent misleading comparisons. Dow's former global epoxy and chlorinated-organics businesses merged with Olin in 2015. Dow should not be counted as a second owner of those assets. Syensqo's documented composite resin and tooling activities sit downstream of monomer production. They provide insight into application requirements but do not establish merchant ECH capacity. The competitive comparison therefore separates current producers, downstream material companies and historical ownership references.
Integrated ECH and resin chains: Olin, Spolchemie, Jiangsu Yangnong Chemical Group, and Aditya Birla Chemicals through Grasim.
Regional chemical supply: Shandong Haili Chemical and Osaka Soda.
Historical or adjacent references: Dow and Syensqo.
Key Developments in the Epichlorohydrin (ECH) Market
- 21 October 2026: Grasim commenced commercial production at its Vilayat ECH plant. The regulatory announcement states 50,000 tonnes per annum of installed capacity. This establishes a new operating supply option in India.
- January 2026: Olin confirmed the closure of its Guarujá epoxy plants during its 30 January earnings call. The change affects downstream resin conversion in Brazil.
Key Players in the Epichlorohydrin (ECH) Market
- Olin
- Spolchemie
- Shandong Haili Chemical
- Jiangsu Yangnong Chemical, referring here to Jiangsu Yangnong Chemical Group
- Aditya Birla Chemicals, through Grasim Industries
- Osaka Soda
- Dow, for the production lineage transferred to Olin
- Syensqo, for downstream composite-material activity
Epichlorohydrin (ECH) Market Report Scope
Table 6: Epichlorohydrin (ECH) Market Report Scope
| Coverage field | Report scope |
|---|---|
| Market definition | Epichlorohydrin sold for epoxy resins, synthetic glycerin, water-treatment and paper resins, surfactants and other chemical uses. |
| Production coverage | Propylene-based, glycerin-based and other ECH routes. |
| Exclusions | Finished epoxy resin, formulated coating and composite product revenues are not added to ECH value. |
| Quantitative Units | USD million |
| Physical unit | Thousand tonnes of ECH sales, with price expressed in USD per tonne. |
| Segment coverage | Process, application and end use, retaining distinct classifications. |
| National coverage | China, United States, Germany, South Korea, Japan, Taiwan, India, Thailand, Netherlands and Brazil, plus a Rest of world aggregate. |
| Company coverage | Olin, Spolchemie, Shandong Haili Chemical, Jiangsu Yangnong Chemical Group, Aditya Birla Chemicals, Osaka Soda, Dow and Syensqo, with current and former roles distinguished. |
| Commercial coverage | Production routes, downstream conversion, renewable-carbon offers, trade exposure and supplier positioning. |
Source: Future Market Insights analysis of the epichlorohydrin (ECH) market, 2026.
Epichlorohydrin (ECH) Market Research Methodology
This assessment combines FMI's numerical ECH outlook with secondary review of corporate disclosures, official trade statistics and regulatory material. Product boundaries distinguish the monomer from downstream resin and formulated-system revenue. Company positions reflect documented products and ownership events. Country interpretation considers conversion activity and trade exposure, while percentage totals, physical units and forecast periods are checked for consistency. The analysis retains the difference between announced capacity, operating commencement and realized sales.
Epichlorohydrin (ECH) Market by Segments
Epichlorohydrin (ECH) Market segmented by Process:
- Propylene-based
- Glycerin-based
- Other Routes
Epichlorohydrin (ECH) Market segmented by Application:
- Epoxy Resins
- Synthetic Glycerin
- Water Treatment and Paper Resins
- Surfactants and Other
Epichlorohydrin (ECH) Market segmented by End Use:
- Paints and Coatings
- Electronics and Composites
- Construction and Adhesives
- Wind and Transportation
- Other
Epichlorohydrin (ECH) Market by Region
- North America
- United States
- Latin America
- Brazil
- Western Europe
- Germany
- Netherlands
- East Asia
- China
- South Korea
- Japan
- Taiwan
- South Asia
- India
- Southeast Asia
- Thailand
- Rest of world aggregate
Research Sources and Bibliography
- AGC Chemicals Europe. (Accessed 2026, November 9). EPINITY Bio-based Epichlorohydrin. Product information.
- Chemical Administration, Ministry of Environment, Taiwan. (Accessed 2026, November 9). Epichlorohydrin, CAS 106-89-8, listed substance 072-01.
- Directorate General of Trade Remedies, Government of India. (2024, August 14). Final findings, anti-dumping investigation concerning imports of Epichlorohydrin originating in or exported from Korea RP, Thailand and China PR, file 06/15/2023-DGTR. Investigation record.
- European Commission. (2025, July 25). Commission Implementing Regulation (EU) 2025/1505 imposing definitive measures on epoxy resins and terminating the investigation concerning the Republic of Korea. Official Journal of the European Union, July 28, 2025.
- European Commission, Directorate-General for Trade and Economic Security. (2025, July 28). Commission acts against unfairly traded epoxy resins from China, Taiwan and Thailand.
- Grasim Industries Limited. (2026, October 21). Commencement of commercial production of Epichlorohydrin Plant at Vilayat, Gujarat. Regulatory announcement. https://www.grasim.com/Upload/PDF/commencement-of-commercial-production-of-epichlorohydrin-plant.pdf
- HELM AG. (Accessed 2026, November 9). Epichlorohydrine, product information. https://www.helmag.com/en/products/detail/epichlorohydrine
- Jiangsu Yangnong Chemical Group. (Accessed 2026, November 9). Marketing Center, olefin derivatives and functional resins. https://www.yangnong.com.cn/yangnong/yxzx/A142004Gone1.html
- Olin Corporation. (2026, January 30). Fourth-quarter 2025 earnings conference call, management's prepared remarks. Transcript distributed through Olin's investor-relations service. https://s3.amazonaws.com/b2icontent.irpass.cc/1548/199302.pdf
- Olin Corporation. (2026, February 20). Annual report on Form 10-K for the year ended December 31, 2025. US Securities and Exchange Commission. https://www.sec.gov/Archives/edgar/data/74303/000007430326000027/oln-20251231.htm
- Osaka Soda Co., Ltd. (Accessed 2026, November 9). Corporate Profile, business fields. https://www.osaka-soda.co.jp/en/company/outline.html
- Shandong Haili Chemical. (Accessed 2026, November 9). Corporate website and product listing. https://www.hailichemical.com/en/index.aspx
- Solvay. (2017, February 23). Solvay completes the sale of its Vinythai stake to AGC Asahi Glass. https://www.solvay.com/en/press-release/solvay-completes-sale-its-vinythai-stake-agc-asahi-glass
- Spolek pro chemickou a hutní výrobu. (2025). Annual Report 2024, product portfolio and business assessment sections. Spolchemie. https://www.spolchemie.cz/wp-content/uploads/2025/09/Annual-Report_2024_en.pdf
- Syensqo. (Accessed 2026, November 9). Composite Materials solutions portfolio. https://www.syensqo.com/en/chemical-categories/our-composite-materials-solutions/product-portfolio
- The Dow Chemical Company. (2015, October 5). Dow closes transaction to separate significant portion of its chlorine value chain. Company release filed with the US Securities and Exchange Commission. https://www.sec.gov/Archives/edgar/data/29915/000094787115000718/ss455221_ex9902.htm
- World Bank, World Integrated Trade Solution. (Accessed 2026, November 9). Thailand exports of 1-Chloro-2,3-epoxypropane, HS 291030, by partner, 2025. UN Comtrade trade statistics. https://wits.worldbank.org/trade/comtrade/en/country/THA/year/2025/tradeflow/Exports/partner/ALL/product/291030
- World Health Organization. (2022). Epichlorohydrin chemical fact sheet. Guidelines for drinking-water quality, fourth edition incorporating the first and second addenda. https://www.ncbi.nlm.nih.gov/books/NBK579460/table/ch12.tab70/
Table of Content
- Key Takeaways
- Market Size and CAGR
- Top Growth Driver
- Fastest Growing Segment
- Leading Region
- Key Companies
- Emerging Opportunities
- Executive Summary
- Global Market Outlook
- Demand-side Trends
- Supply-side Trends
- Technology Roadmap Analysis
- Analysis and Recommendations
- Analyst Perspective (What is happening? Why now? What should investors know?)
- Key Questions Answered
- How large is the market?
- What is the CAGR?
- What are key trends?
- Which region dominates?
- Who are the leaders?
Read More...
- Market Overview
- Market Coverage / Taxonomy
- Market Definition / Scope / Limitations
- Research Methodology
- Chapter Orientation
- Analytical Lens and Working Hypotheses
- Market Structure, Signals, and Trend Drivers
- Benchmarking and Cross-market Comparability
- Market Sizing, Forecasting, and Opportunity Mapping
- Research Design and Evidence Framework
- Desk Research Programme (Secondary Evidence)
- Expert Input and Fieldwork (Primary Evidence)
- Tooling, Models, and Reference Databases
- Data Engineering and Model Build
- Quality Assurance and Audit Trail
- Market Background
- Market Dynamics (Drivers, Restraints, Opportunity, Trends)
- Scenario Forecast (Optimistic, Likely, Conservative)
- Impact Analysis
- AI Impact
- Sustainability Impact
- Regulatory Impact
- Technology Impact
- Consumer / Buyer Analysis
- Purchase Drivers
- Adoption Barriers
- Buyer Journey
- Opportunity Map Analysis
- Product Life Cycle Analysis
- Supply Chain Analysis
- Investment Feasibility Matrix
- Value Chain Analysis
- PESTLE and Porter's Analysis
- Regulatory Landscape
- Regional Parent Market Outlook
- Production and Consumption Statistics
- Import and Export Statistics
- Global Market Analysis and Forecast, 2021 to 2036
- Historical Market Size Value (USD Million) Analysis, 2021 to 2025
- Current and Future Market Size Value (USD Million) Projections, 2026 to 2036
- Y-o-Y Growth Trend Analysis
- Absolute $ Opportunity Analysis
- Global Market Pricing Analysis, 2021 to 2036
- Global Market Analysis and Forecast, By Process, 2021 to 2036
- Introduction / Key Findings
- Historical Market Size Value (USD Million) Analysis By Process, 2021 to 2025
- Current and Future Market Size Value (USD Million) Analysis and Forecast By Process, 2026 to 2036
- Propylene-based
- Glycerin-based
- Other Routes
- Y-o-Y Growth Trend Analysis By Process, 2021 to 2025
- Absolute $ Opportunity Analysis By Process, 2026 to 2036
- Global Market Analysis and Forecast, By Application, 2021 to 2036
- Introduction / Key Findings
- Historical Market Size Value (USD Million) Analysis By Application, 2021 to 2025
- Current and Future Market Size Value (USD Million) Analysis and Forecast By Application, 2026 to 2036
- Epoxy Resins
- Synthetic Glycerin
- Water Treatment and Paper Resins
- Surfactants and Other
- Y-o-Y Growth Trend Analysis By Application, 2021 to 2025
- Absolute $ Opportunity Analysis By Application, 2026 to 2036
- Global Market Analysis and Forecast, By End Use, 2021 to 2036
- Introduction / Key Findings
- Historical Market Size Value (USD Million) Analysis By End Use, 2021 to 2025
- Current and Future Market Size Value (USD Million) Analysis and Forecast By End Use, 2026 to 2036
- Paints and Coatings
- Electronics and Composites
- Construction and Adhesives
- Wind and Transportation
- Other
- Y-o-Y Growth Trend Analysis By End Use, 2021 to 2025
- Absolute $ Opportunity Analysis By End Use, 2026 to 2036
- Global Market Analysis and Forecast, By Region, 2021 to 2036
- Introduction
- Historical Market Size Value (USD Million) Analysis By Region, 2021 to 2025
- Current Market Size Value (USD Million) Analysis and Forecast By Region, 2026 to 2036
- North America
- Latin America
- Western Europe
- East Asia
- South Asia
- Market Attractiveness Analysis By Region
- North America Market Analysis and Forecast, By Country, 2021 to 2036
- Historical Market Size Value (USD Million) Trend Analysis By Market Taxonomy, 2021 to 2025
- Market Size Value (USD Million) Forecast By Market Taxonomy, 2026 to 2036
- By Country
- United States
- By Process
- By Application
- By End Use
- By Country
- Market Attractiveness Analysis
- By Country
- By Process
- By Application
- By End Use
- Key Takeaways
- Latin America Market Analysis and Forecast, By Country
- Historical Market Size Value (USD Million) Trend Analysis By Market Taxonomy, 2021 to 2025
- Market Size Value (USD Million) Forecast By Market Taxonomy, 2026 to 2036
- By Country
- Brazil
- By Process
- By Application
- By End Use
- By Country
- Market Attractiveness Analysis
- By Country
- By Process
- By Application
- By End Use
- Key Takeaways
- Western Europe Market Analysis and Forecast, By Country
- Historical Market Size Value (USD Million) Trend Analysis By Market Taxonomy, 2021 to 2025
- Market Size Value (USD Million) Forecast By Market Taxonomy, 2026 to 2036
- By Country
- Germany
- Netherlands
- By Process
- By Application
- By End Use
- By Country
- Market Attractiveness Analysis
- By Country
- By Process
- By Application
- By End Use
- Key Takeaways
- East Asia Market Analysis and Forecast, By Country
- Historical Market Size Value (USD Million) Trend Analysis By Market Taxonomy, 2021 to 2025
- Market Size Value (USD Million) Forecast By Market Taxonomy, 2026 to 2036
- By Country
- China
- South Korea
- Japan
- Taiwan
- By Process
- By Application
- By End Use
- By Country
- Market Attractiveness Analysis
- By Country
- By Process
- By Application
- By End Use
- Key Takeaways
- South Asia Market Analysis and Forecast, By Country
- Historical Market Size Value (USD Million) Trend Analysis By Market Taxonomy, 2021 to 2025
- Market Size Value (USD Million) Forecast By Market Taxonomy, 2026 to 2036
- By Country
- India
- Southeast Asia
- Thailand
- Rest of world aggregate
- By Process
- By Application
- By End Use
- By Country
- Market Attractiveness Analysis
- By Country
- By Process
- By Application
- By End Use
- Key Takeaways
- Key Countries Market Analysis
- United States
- Pricing Analysis
- Market Share Analysis, 2025
- By Process
- By Application
- By End Use
- Brazil
- Pricing Analysis
- Market Share Analysis, 2025
- By Process
- By Application
- By End Use
- Germany
- Pricing Analysis
- Market Share Analysis, 2025
- By Process
- By Application
- By End Use
- India
- Pricing Analysis
- Market Share Analysis, 2025
- By Process
- By Application
- By End Use
- China
- Pricing Analysis
- Market Share Analysis, 2025
- By Process
- By Application
- By End Use
- Japan
- Pricing Analysis
- Market Share Analysis, 2025
- By Process
- By Application
- By End Use
- South Korea
- Pricing Analysis
- Market Share Analysis, 2025
- By Process
- By Application
- By End Use
- Thailand
- Pricing Analysis
- Market Share Analysis, 2025
- By Process
- By Application
- By End Use
- Taiwan
- Pricing Analysis
- Market Share Analysis, 2025
- By Process
- By Application
- By End Use
- Netherlands
- Pricing Analysis
- Market Share Analysis, 2025
- By Process
- By Application
- By End Use
- United States
- Market Structure Analysis
- Competition Dashboard
- Competition Benchmarking
- Market Share Analysis of Top Players
- By Regional
- By Process
- By Application
- By End Use
- Emerging Startups
- Innovation Benchmarking
- Competition Analysis
- Competition Deep Dive
- Olin
- Overview
- Product Portfolio
- Profitability by Market Segments
- Sales Footprint
- Strategy Overview
- Marketing Strategy
- Product Strategy
- Channel Strategy
- Spolchemie
- Shandong Haili Chemical
- Jiangsu Yangnong Chemical Group
- Aditya Birla Chemicals / Grasim
- Osaka Soda
- Dow
- Syensqo
- Jiangsu Yangnong Chemical, referring here to Jiangsu Yangnong Chemical Group
- Aditya Birla Chemicals, through Grasim Industries
- Dow, for the production lineage transferred to Olin
- Syensqo, for downstream composite-material activity
- Olin
- Case Studies
- Success Stories
- Recent Developments
- Competition Deep Dive
- Assumptions & Acronyms Used
List of Tables
- Table 1: Global Market Value (USD Million) Forecast by Region, 2021 to 2036
- Table 2: Global Market Value (USD Million) Forecast by Process, 2021 to 2036
- Table 3: Global Market Value (USD Million) Forecast by Application, 2021 to 2036
- Table 4: Global Market Value (USD Million) Forecast by End Use, 2021 to 2036
- Table 5: North America Market Value (USD Million) Forecast by Country, 2021 to 2036
- Table 6: North America Market Value (USD Million) Forecast by Process, 2021 to 2036
- Table 7: North America Market Value (USD Million) Forecast by Application, 2021 to 2036
- Table 8: North America Market Value (USD Million) Forecast by End Use, 2021 to 2036
- Table 9: Latin America Market Value (USD Million) Forecast by Country, 2021 to 2036
- Table 10: Latin America Market Value (USD Million) Forecast by Process, 2021 to 2036
- Table 11: Latin America Market Value (USD Million) Forecast by Application, 2021 to 2036
- Table 12: Latin America Market Value (USD Million) Forecast by End Use, 2021 to 2036
- Table 13: Western Europe Market Value (USD Million) Forecast by Country, 2021 to 2036
- Table 14: Western Europe Market Value (USD Million) Forecast by Process, 2021 to 2036
- Table 15: Western Europe Market Value (USD Million) Forecast by Application, 2021 to 2036
- Table 16: Western Europe Market Value (USD Million) Forecast by End Use, 2021 to 2036
- Table 17: East Asia Market Value (USD Million) Forecast by Country, 2021 to 2036
- Table 18: East Asia Market Value (USD Million) Forecast by Process, 2021 to 2036
- Table 19: East Asia Market Value (USD Million) Forecast by Application, 2021 to 2036
- Table 20: East Asia Market Value (USD Million) Forecast by End Use, 2021 to 2036
- Table 21: South Asia Market Value (USD Million) Forecast by Country, 2021 to 2036
- Table 22: South Asia Market Value (USD Million) Forecast by Process, 2021 to 2036
- Table 23: South Asia Market Value (USD Million) Forecast by Application, 2021 to 2036
- Table 24: South Asia Market Value (USD Million) Forecast by End Use, 2021 to 2036
List of Figures
- Figure 1: Global Market Pricing Analysis
- Figure 2: Global Market Value (USD Million) Forecast 2021-2036
- Figure 3: Global Market Value Share and BPS Analysis by Process, 2026 and 2036
- Figure 4: Global Market Y-o-Y Growth Comparison by Process, 2026-2036
- Figure 5: Global Market Attractiveness Analysis by Process
- Figure 6: Global Market Value Share and BPS Analysis by Application, 2026 and 2036
- Figure 7: Global Market Y-o-Y Growth Comparison by Application, 2026-2036
- Figure 8: Global Market Attractiveness Analysis by Application
- Figure 9: Global Market Value Share and BPS Analysis by End Use, 2026 and 2036
- Figure 10: Global Market Y-o-Y Growth Comparison by End Use, 2026-2036
- Figure 11: Global Market Attractiveness Analysis by End Use
- Figure 12: Global Market Value (USD Million) Share and BPS Analysis by Region, 2026 and 2036
- Figure 13: Global Market Y-o-Y Growth Comparison by Region, 2026-2036
- Figure 14: Global Market Attractiveness Analysis by Region
- Figure 15: North America Market Incremental Dollar Opportunity, 2026-2036
- Figure 16: Latin America Market Incremental Dollar Opportunity, 2026-2036
- Figure 17: Western Europe Market Incremental Dollar Opportunity, 2026-2036
- Figure 18: East Asia Market Incremental Dollar Opportunity, 2026-2036
- Figure 19: South Asia Market Incremental Dollar Opportunity, 2026-2036
- Figure 20: North America Market Value Share and BPS Analysis by Country, 2026 and 2036
- Figure 21: North America Market Value Share and BPS Analysis by Process, 2026 and 2036
- Figure 22: North America Market Y-o-Y Growth Comparison by Process, 2026-2036
- Figure 23: North America Market Attractiveness Analysis by Process
- Figure 24: North America Market Value Share and BPS Analysis by Application, 2026 and 2036
- Figure 25: North America Market Y-o-Y Growth Comparison by Application, 2026-2036
- Figure 26: North America Market Attractiveness Analysis by Application
- Figure 27: North America Market Value Share and BPS Analysis by End Use, 2026 and 2036
- Figure 28: North America Market Y-o-Y Growth Comparison by End Use, 2026-2036
- Figure 29: North America Market Attractiveness Analysis by End Use
- Figure 30: Latin America Market Value Share and BPS Analysis by Country, 2026 and 2036
- Figure 31: Latin America Market Value Share and BPS Analysis by Process, 2026 and 2036
- Figure 32: Latin America Market Y-o-Y Growth Comparison by Process, 2026-2036
- Figure 33: Latin America Market Attractiveness Analysis by Process
- Figure 34: Latin America Market Value Share and BPS Analysis by Application, 2026 and 2036
- Figure 35: Latin America Market Y-o-Y Growth Comparison by Application, 2026-2036
- Figure 36: Latin America Market Attractiveness Analysis by Application
- Figure 37: Latin America Market Value Share and BPS Analysis by End Use, 2026 and 2036
- Figure 38: Latin America Market Y-o-Y Growth Comparison by End Use, 2026-2036
- Figure 39: Latin America Market Attractiveness Analysis by End Use
- Figure 40: Western Europe Market Value Share and BPS Analysis by Country, 2026 and 2036
- Figure 41: Western Europe Market Value Share and BPS Analysis by Process, 2026 and 2036
- Figure 42: Western Europe Market Y-o-Y Growth Comparison by Process, 2026-2036
- Figure 43: Western Europe Market Attractiveness Analysis by Process
- Figure 44: Western Europe Market Value Share and BPS Analysis by Application, 2026 and 2036
- Figure 45: Western Europe Market Y-o-Y Growth Comparison by Application, 2026-2036
- Figure 46: Western Europe Market Attractiveness Analysis by Application
- Figure 47: Western Europe Market Value Share and BPS Analysis by End Use, 2026 and 2036
- Figure 48: Western Europe Market Y-o-Y Growth Comparison by End Use, 2026-2036
- Figure 49: Western Europe Market Attractiveness Analysis by End Use
- Figure 50: East Asia Market Value Share and BPS Analysis by Country, 2026 and 2036
- Figure 51: East Asia Market Value Share and BPS Analysis by Process, 2026 and 2036
- Figure 52: East Asia Market Y-o-Y Growth Comparison by Process, 2026-2036
- Figure 53: East Asia Market Attractiveness Analysis by Process
- Figure 54: East Asia Market Value Share and BPS Analysis by Application, 2026 and 2036
- Figure 55: East Asia Market Y-o-Y Growth Comparison by Application, 2026-2036
- Figure 56: East Asia Market Attractiveness Analysis by Application
- Figure 57: East Asia Market Value Share and BPS Analysis by End Use, 2026 and 2036
- Figure 58: East Asia Market Y-o-Y Growth Comparison by End Use, 2026-2036
- Figure 59: East Asia Market Attractiveness Analysis by End Use
- Figure 60: South Asia Market Value Share and BPS Analysis by Country, 2026 and 2036
- Figure 61: South Asia Market Value Share and BPS Analysis by Process, 2026 and 2036
- Figure 62: South Asia Market Y-o-Y Growth Comparison by Process, 2026-2036
- Figure 63: South Asia Market Attractiveness Analysis by Process
- Figure 64: South Asia Market Value Share and BPS Analysis by Application, 2026 and 2036
- Figure 65: South Asia Market Y-o-Y Growth Comparison by Application, 2026-2036
- Figure 66: South Asia Market Attractiveness Analysis by Application
- Figure 67: South Asia Market Value Share and BPS Analysis by End Use, 2026 and 2036
- Figure 68: South Asia Market Y-o-Y Growth Comparison by End Use, 2026-2036
- Figure 69: South Asia Market Attractiveness Analysis by End Use
- Figure 70: Global Market - Tier Structure Analysis
- Figure 71: Global Market - Company Share Analysis
Frequently Asked Questions
How big is the epichlorohydrin (ECH) market in 2026?
FMI estimates the market at USD 2,691.0 million in 2026, up from USD 2,600.0 million in 2025. It is forecast to reach USD 3,907.4 million by 2036 at a 3.8% CAGR.
Which process leads the epichlorohydrin (ECH) market in 2026?
Propylene-based leads by process with 58.0% in 2026. All other segments together hold 42.0%.
Which application and end use lead in 2026?
Epoxy Resins holds 74.0% by application and Paints and Coatings holds 30.0% by end use in FMI's 2026 assessment.
Which market is forecast to grow fastest through 2036?
India has the highest forecast CAGR at 6.0% during 2026 to 2036, followed by China at 4.5%.
Do the European epoxy-resin duties apply directly to every ECH shipment?
The July 2025 measures discussed here apply to the specified epoxy resins from China, Taiwan and Thailand. Their scope concerns downstream resin market access.[18]
Preview the report firsthand - request a free sample
Get SampleGet the brochure for pricing and purchase details.
Get PDF
