

- Market Size (2026)
- USD 0.8 Bn
- Forecast (2036)
- USD 2.5 Bn
- CAGR (2026 to 2036)
- 11.7%
EV High-Voltage Wiring Harness Replacement Parts Market Size, Forecast and Outlook By FMI
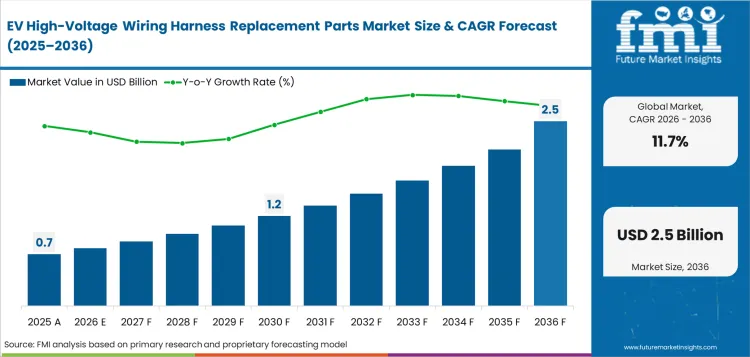
EV high-voltage wiring harness replacement parts market was valued at USD 0.7 billion in 2025 and is expected to reach USD 0.8 billion in 2026. Demand is forecast to reach USD 2.5 billion by 2036 at 11.7% CAGR during the forecast decade. Copper conductors are expected to hold 72.5% of conductor material demand in 2026. Battery EVs are anticipated to account for 61.5% of vehicle type demand in 2026.
Summary of the EV High-Voltage Wiring Harness Replacement Parts Market
- Demand and Growth Drivers
- EV repair demand is moving toward safer high-voltage part replacement. Workshops need cable assemblies and connector kits that can pass insulation checks after repair.
- Older electric vehicles are creating more service work outside warranty coverage. Fleet operators need faster repair routes so vehicles can return to service without long delays.
- Collision repair is adding demand for approved high-voltage wiring parts. Damaged cables near the battery or inverter must be replaced with parts that match the original vehicle layout.
- Product and Segment View
- HV cable assemblies hold a central role because many repair jobs need complete routed leads. Correct cable length and shielding help workshops avoid rework.
- Battery EVs create stronger replacement need than plug-in hybrids. Pure electric platforms carry more high-voltage wiring across the battery and drive system.
- Copper conductors continue to be preferred in service parts. Repair centers trust copper because it supports stable current flow and familiar joining methods.
- Geography and Competitive Outlook
- China and India offer wider service demand as electric vehicle use expands. Local repair networks will need better access to safe high-voltage replacement parts.
- Germany and the United Kingdom have better repair readiness due to trained workshops and established EV service practices. Suppliers with clear fitment data can serve these channels more easily.
- Competition depends on product safety and vehicle-specific part coverage. Companies with tested insulation performance and strong connector design will be preferred by service networks.
- Analyst Opinion
- Nikhil Kaitwade, Principal Consultant at FMI says, “High-voltage harness replacement is becoming a safety-based repair market for EV workshops. The part may look simple, but the risk profile is closer to a certified electrical system. Dealers and fleet service groups need harness kits that match vehicle routing and insulation class. Shielding and connector lock design guide final part approval. Suppliers with repair instructions and validation records are expected to have better access as older EVs move beyond warranty.”
- EV High-Voltage Wiring Harness Replacement Parts Market Value Analysis
- The EV high-voltage wiring harness replacement parts market is moving from rare warranty repair into a more defined EV service parts area.
- Demand is supported by older electric vehicles that need safe cable assemblies and connector kits after wear or collision repair.
- Authorized dealers and certified workshops need approved parts because high-voltage repairs must pass isolation checks before vehicle release.
- Service value is supported by battery and inverter repair needs as workshops shift toward fault-specific harness kits.
Key Takeaways, Market Size, and Forecast
- EV high-voltage wiring harness replacement parts market stood at USD 0.7 billion in 2025.
- By 2036, the industry is forecast to reach USD 2.5 billion.
- Market value is expected to rise at 11.7% CAGR during the forecast decade.
- Market is predicted to create incremental opportunity of USD 1.7 billion from 2026 to 2036.
- Copper conductors are expected to hold 72.5% of conductor material demand in 2026.
- Battery EVs are anticipated to represent 61.5% of vehicle type demand in 2026.
- India at 13.5% CAGR and China at 12.6% CAGR are forecast to witness steady market expansion by 2036.
EV High-Voltage Wiring Harness Replacement Parts Market Definition
The EV high-voltage wiring harness replacement parts market refers to the range of service parts used for replacing or repairing damaged high-voltage electrical routing systems in electric vehicles. It is also used to ensure reliable power distribution and proper connectivity in critical EV components.
EV High-Voltage Wiring Harness Replacement Parts Market Inclusions
Market scope covers EV high-voltage wiring harness replacement parts categorized by component type, including HV cable assemblies and shielded connectors. HVIL leads, junction leads and protective sleeves complete component coverage. Vehicle type includes battery EVs and plug-in hybrids. Fuel cell EVs, electric buses and electric trucks complete the vehicle scope. Voltage class includes 400V systems and 800V systems. Above 800V platforms are included. Sales channel includes authorized dealers and certified workshops. Fleet service, parts distributors and online sellers complete channel coverage.
Conductor material includes copper conductors and aluminum conductors. Hybrid conductors complete material coverage. The scope also includes replacement harness parts used in battery packs, inverters, onboard chargers and charge inlet circuits where high-voltage cable routing and insulation safety are part of the repair process. Revenue scope covers 2026 to 2036. The key stakeholders include EV manufacturers, wiring harness suppliers, connector manufacturers, authorized service centers, certified EV workshops, fleet service operators, parts distributors, insurance repair networks and high-voltage training providers.
EV High-Voltage Wiring Harness Replacement Parts Market Exclusions
Scope excludes complete battery packs and traction motors. Inverters and onboard chargers are excluded unless only the attached harness part is sold. Low-voltage body harnesses fall outside scope. General wire harness tape is excluded unless supplied for high-voltage harness protection. Charging station cables are outside scope, but vehicle-side inlet repair kits may qualify.
EV High-Voltage Wiring Harness Replacement Parts Market Research Methodology
- Primary Research: FMI analysts reviewed EV service needs and high-voltage harness supplier portfolios. Wire harness programs across major EV countries were checked.
- Desk Research: FMI analysts used public EV sales data and vehicle safety rules. Company releases and electric vehicle test equipment references supported the validation process.
- Market Sizing and Forecasting: Market size was estimated using hybrid bottom-up and top-down method based on global EV parc expansion and service incidence assumptions. Harness pricing and channel mix adjusted the forecast.
- Data Validation: Forecast checks compared electric car sales and battery deployment. High-voltage safety rules and supplier developments were reviewed.
Why is the EV High-Voltage Wiring Harness Replacement Parts Market Growing?
- Older EVs are creating steady service need as high-voltage cable damage can stop charging or traction power.
- Safety rules make approved harness parts important since poor insulation can create shock and fire risk.
- Battery and drive unit repair programs need connector kits made for exact vehicle routing and safe current flow.
High-voltage wiring repair is becoming more important as EVs move beyond early warranty coverage. A damaged cable or connector can stop the vehicle even if the battery and motor still work. Workshops need parts with the right insulation rating and secure locking design. Poor fit can delay isolation checks after repair. Approved cable assemblies help service centers finish repairs with less rework.
Safety rules are raising the quality bar for replacement parts. The United States updated electric powertrain safety rules through Federal Motor Vehicle Safety Standard (FMVSS) No. 305a in December 2024. The rule keeps attention on electrical shock protection after crashes. Repairers need parts able to protect high-voltage circuits after collision work. Connector durability and safety test equipment supports these checks by helping suppliers prove contact strength and insulation safety.
Higher electrical loads are making cable design more sensitive. High-voltage cable assemblies need heat control and EMI shielding as EV platforms move toward faster charging and higher output. Service parts must match the original routing path because cable bend and connector angle affect repair safety. Suppliers with clear part data and workshop guidance can support dealers and certified EV repair centers better.
Market Segmentation Analysis
- HV cable assemblies are expected to lead component type demand with 39.0% share.
- Battery EVs are anticipated to contribute 61.5% of vehicle type demand in 2026.
- In 2026, 400V systems are forecast to account for 57.0% share.
- Authorized dealers are expected to hold 46.0% share in 2026.
- Copper conductors are forecast to account for 72.5% of material demand in 2026.
The market is divided into five primary segment groups based on component type and vehicle type. Voltage class, sales channel and conductor material complete the structure. Component type covers HV cable assemblies and shielded connectors. HVIL leads and junction leads complete the group. Vehicle type covers battery EVs and plug-in hybrids. Fuel cell EVs, electric buses and electric trucks complete the vehicle scope. Voltage class covers 400V systems and 800V systems. Above 800V platforms complete the voltage scope. Sales channel covers authorized dealers and certified workshops. Fleet service, parts distributors and online sellers complete the channel scope. Conductor material covers copper conductors and aluminum conductors.
Insights into EV High-Voltage Wiring Harness Replacement Parts Market by Component Type
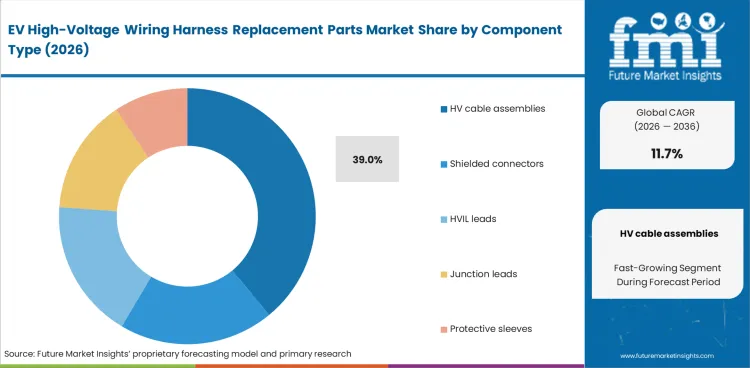
- HV cable assemblies are expected to hold 39.0% share in 2026. Many repair jobs need full routed leads with correct insulation and shielding in one kit.
- Shielded connectors and HVIL leads support safer repair work because poor contact or an open interlock loop can delay post-repair checks.
Insights into EV High-Voltage Wiring Harness Replacement Parts Market by Vehicle Type
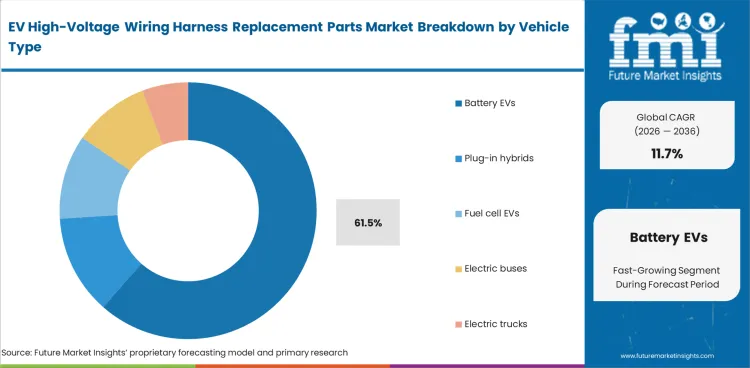
- Battery EVs are anticipated to account for 61.5% share in 2026 since pure electric platforms carry longer high-voltage cable paths around battery packs and drive units.
- Electric buses and electric trucks need durable cable assemblies as heavier duty cycles create more vibration and thermal stress.
Insights into EV High-Voltage Wiring Harness Replacement Parts Market by Voltage Class
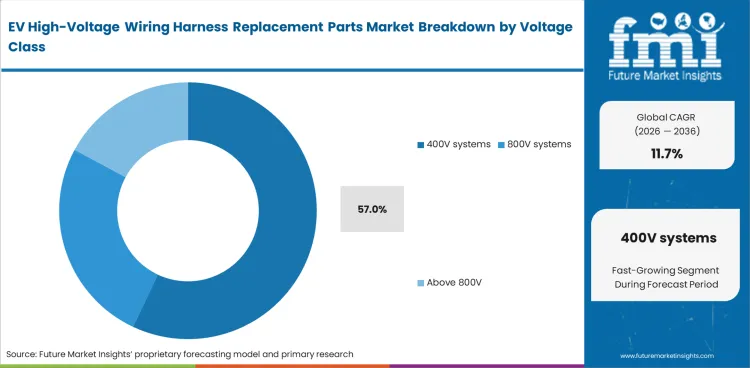
- In 2026, 400V systems are forecast to account for 57.0% share as many current EVs use this layout and create a broad repair pool.
- 800V systems and above 800V platforms is expected to lift average part value because faster charging and higher output need better insulation control.
Insights into EV High-Voltage Wiring Harness Replacement Parts Market by Sales Channel
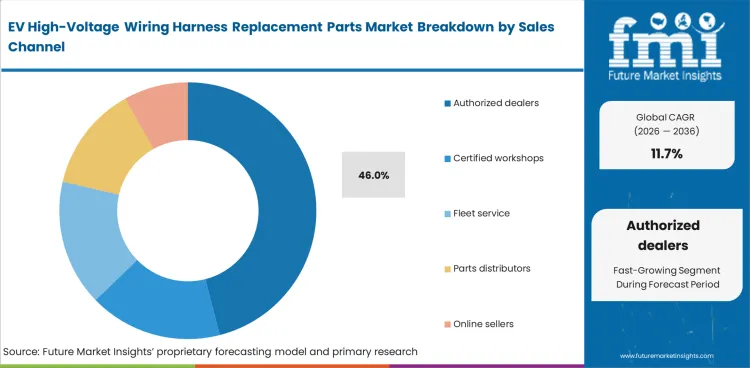
- Authorized dealers are expected to represent 46.0% share in 2026 because high-voltage repair needs approved isolation steps and trained technicians.
- Certified workshops and fleet service providers is projected to expand as older EVs move beyond warranty and vehicle downtime becomes harder for operators to absorb.
Insights into EV High-Voltage Wiring Harness Replacement Parts Market by Conductor Material
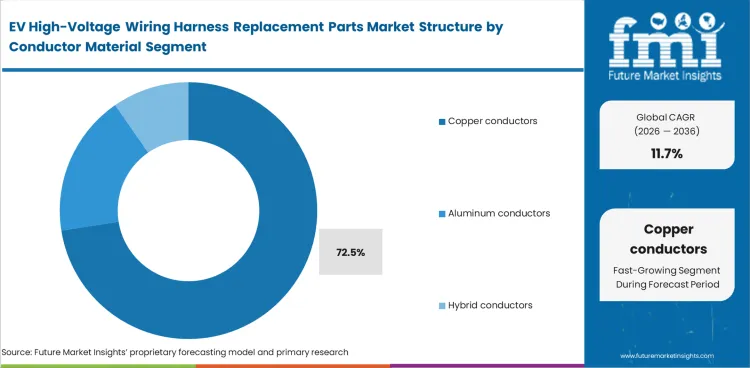
- Copper conductors are forecast to hold 72.5% share in 2026 as repair shops trust copper for stable current flow and proven crimping behavior.
- Aluminum and hybrid conductors adoption is estimated to expand in weight-sensitive EV designs.
EV High-Voltage Wiring Harness Replacement Parts Market Drivers, Restraints, and Opportunities
- EV parc aging is raising demand for safe high-voltage cable and connector replacement.
- Limited access to approved parts can slow repair work as high-voltage service needs trained staff.
- Battery repair and modular service kits create a higher-value route for suppliers with vehicle-specific harness data.
Aging EV Parc Raises Cable Service
Older EVs are creating a practical service need for high-voltage wiring parts. Global EV battery deployment reached 1.2 TWh in 2025, with light-duty vehicles using most of that capacity. Larger battery use means more high-voltage circuits moving through vehicle bodies. Cable wear can come from crash repair or heat near power electronics. Exact-fit kits reduce repair uncertainty for dealers and fleet service centers.
Approved Part Access Limits Repairs
High-voltage work carries risk if parts do not match the original vehicle design. Replacement automotive connectors need correct seals and locks for safe current flow. A wrong terminal can create heat or fail an isolation test. Smaller workshops may struggle if approved parts are hard to source. Certified aftermarket suppliers can enter the market by offering validated kits with clear repair steps.
Battery Repair Opens Kit Demand
Battery pack repair is moving attention toward smaller high-voltage parts with high service value. Energy storage high-voltage connector parts offer useful design overlap for safe current transfer and insulation control. Short leads and junction leads can lower replacement cost compared with full assembly change. HVIL loop kits support safe fault checks after repair. Suppliers with routing guides and test instructions can serve dealers and specialist EV repair shops.
Analysis of EV High-Voltage Wiring Harness Replacement Parts Market by Key Countries
.webp "Top Country Growth Comparison Ev High Voltage Wiring Harness Replacement Parts Market Cagr (2026 2036)")
| Country | CAGR |
|---|---|
| United States | 10.8% |
| China | 12.6% |
| India | 13.5% |
| Germany | 11.2% |
| France | 10.9% |
| Japan | 9.8% |
| United Kingdom | 11.4% |
Source: Future Market Insights, 2026.
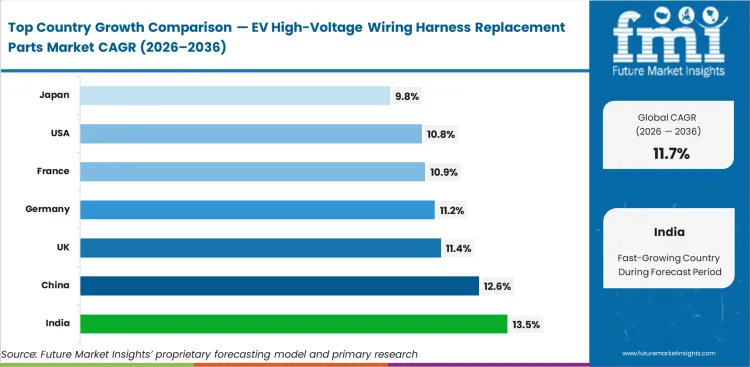
EV High-Voltage Wiring Harness Replacement Parts Market CAGR Analysis by Country
- India is expected to record 13.5% CAGR through 2036.
- China is forecast to expand at 12.6% CAGR during the forecast period.
- The United Kingdom is anticipated to move ahead at 11.4% CAGR by 2036.
- Germany is expected to advance at 11.2% CAGR through 2036.
- The United States is expected to expand at 10.8% CAGR during the forecast period.
- Industry in France is forecast to rise at 10.9% CAGR by 2036.
Demand Outlook for EV High-Voltage Wiring Harness Replacement Parts Market in the United States
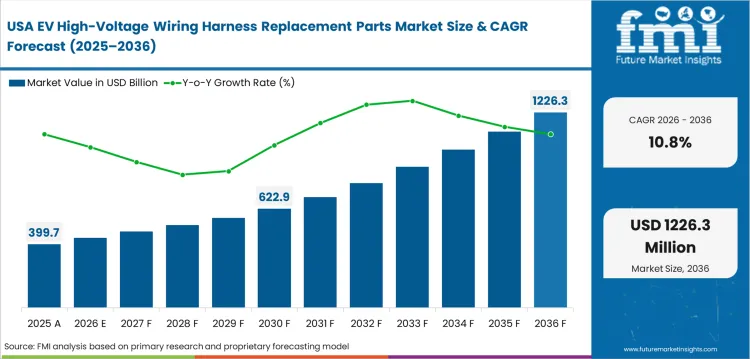
The market in the United States is projected to expand at a CAGR of 10.8% through 2036 as EV repair becomes more safety controlled. Federal EV safety rules keep high-voltage service tied to approved isolation checks and safe cable routing. Dealers need vehicle-specific leads because incorrect length or shielding can delay post-repair release. Certified workshops are likely to handle more replacement work as older EVs move outside warranty coverage.
- Collision repair raises demand for insulated cable assemblies near battery and inverter circuits.
- Charge inlet service creates need for locked connectors and short replacement leads.
- Fleet service providers need approved parts to reduce vehicle downtime after electrical faults.
Sales Analysis of EV High-Voltage Wiring Harness Replacement Parts Market in China
China has a large service pool for EV high-voltage wiring repair. The market is expected to record 12.6% CAGR during the forecast period. International Energy Agency (IEA) recorded above 13.0 million electric car sales in China in 2025. High vehicle volume creates repeat need for battery-side cables and inverter leads. Local parts channels will need better fitment data as more repairs move outside OEM warranty networks.
- Battery EV volume supports steady demand for connector kits across service centers.
- Domestic EV platforms need model-specific cable lengths and terminal layouts.
- Local harness supply can reduce delays for workshops handling high daily repair loads.
Demand Outlook for EV High-Voltage Wiring Harness Replacement Parts Market in India
India’s industry outlook is likely to hold 13.5% CAGR through 2036 as EV use expands from smaller vehicles into cars and buses. India registered 56.75 lakh electric vehicles by February 2025. High-voltage repair skills are uneven across the service network. Dealers and fleet service providers will need approved parts with clear safety steps as electric buses and delivery vehicles age.
- Bus fleets need durable cable assemblies with clear replacement instructions.
- Delivery EVs can lift demand for charge inlet leads and battery-side wiring kits.
- Local parts access will matter as service centers try to reduce repair time.
Opportunity Analysis of EV High-Voltage Wiring Harness Replacement Parts Market in Germany
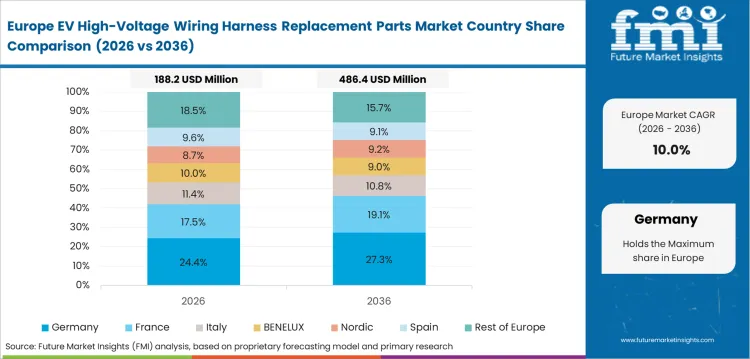
Germany’s EV service network is established as compared to other European markets. Adoption in Germany is anticipated to grow at a CAGR of 11.2% during the forecast decade. IEA recorded about 850,000 electric car sales in Germany in 2025. Service centers are familiar with complex thermal and high-voltage systems. Replacement demand will favor cable assemblies with precise fitment data and supplier-backed validation records.
- OEM service culture supports approved replacement parts for battery and inverter circuits.
- Independent workshops can expand access as high-voltage training improves.
- E-axle service work supports demand for short power leads and shielded connector kits.
Sales Analysis of EV High-Voltage Wiring Harness Replacement Parts Market in France
France is forecast to register 10.9% CAGR in this market during the forecast period as battery electric use supports passenger car service demand. IEA stated France recorded around 25.0% electric car sales share in 2025. Pure electric models create more replacement content than plug-in hybrid platforms. Service channels will need validated cable assemblies as high-voltage repairs increase outside early warranty periods.
- Battery electric uptake supports demand for charge inlet leads and battery connector kits.
- Repairers need approved parts to protect warranty records and safety documents.
- Fleet electrification can lift repeat demand for routed cable kits in urban service networks.
Future Outlook for EV High-Voltage Wiring Harness Replacement Parts Market in Japan
Japan’s energy ministry noted in June 2024 that the EV sales ratio stood near 2.0%. Hybrid vehicle depth keeps high-voltage service work active. Japan is expected to advance at 9.8% CAGR through 2036 as EV penetration builds at a slower pace compared to other countries. Full BEV harness replacement demand is expected to build gradually as charging and battery repair work expands.
- Hybrid repair experience supports safe handling of insulated cable systems.
- BEV expansion will create new demand for battery-side harnesses.
- Compact vehicle designs need neat cable routing and reliable connector locks.
Future Outlook for EV High-Voltage Wiring Harness Replacement Parts Market in the United Kingdom
The United Kingdom is forecast to rise at 11.4% CAGR by 2036 as EV sales intensity expands the repair pool. IEA reported above 1 in 3 new cars sold in the United Kingdom in 2025 were electric. Policy pressure supports wider EV use, which creates more service work for dealers and independent workshops. Suppliers with fast catalog coverage can support fleets and private owners better.
- The zero-emission vehicle mandate supports wider EV parc expansion.
- Independent workshops need training and parts data before handling high-voltage cable repair.
- Fleet service providers need reliable lead kits for repeated charge inlet and battery-side repairs.
Competitive Landscape and Strategic Positioning
- Supplier selection depends on validated cable assemblies and secure connector locks.
- Shielding performance and vehicle fitment depth guide workshop confidence.
- Suppliers stand out with high-voltage product breadth and repair-network test records.
- Wire harness specialists have an edge once replacement parts match battery and inverter routing.
- Entry barriers include electrical isolation proof and high-voltage technician support.
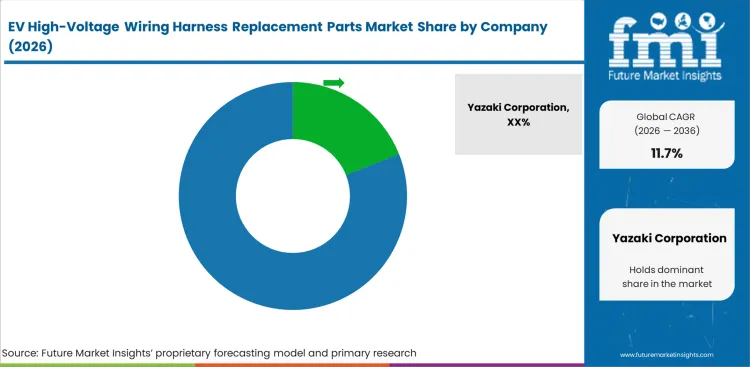
Competitive positioning in the EV high-voltage wiring harness replacement parts market is dependent on high-voltage product depth and repair fitment accuracy. A key player in the sector, Versigent, states that its high-voltage electrical distribution systems cover wire harnesses and cable assemblies up to 1000V. Its focused product depth supports EV repair demand tied to battery and inverter routing. Zonal wiring harness platforms will shape future part design as EV electrical layouts become more centralized.
Lear has scale in E-systems and power distribution modules. Its product mix includes high-voltage distribution modules and wire-to-board connectors, which support repair needs near battery and body electrical interfaces. Yazaki and Sumitomo Electric Industries bring deep wiring system experience across global vehicle programs. TE Connectivity adds connector depth for charging and high-voltage interfaces.
Specialist suppliers need proof of insulation safety and fitment accuracy to win repair channel trust. Samvardhana Motherson and LEONI support the market through wiring systems scale and regional production access. Amphenol and Molex strengthen connector supply through automotive-grade interface products. Replacement part suppliers with clear routing data and service documentation can support certified workshops as EV repair work expands.
Key Companies in the EV High-Voltage Wiring Harness Replacement Parts Market
- Global Harness Specialists: Yazaki Corporation and Sumitomo Electric Industries hold service positions through high-voltage harness design and global vehicle program access.
- Focused Electrical Distribution Supplier: Versigent Limited supports the market through high-voltage cable assemblies and former Aptiv EDS product depth.
- Integrated Electrical Suppliers: Lear Corporation and TE Connectivity participate through connectors and power distribution modules.
- Production and Service Participants: Samvardhana Motherson International and LEONI Group support replacement part access through wiring systems scale.
Competitive Benchmarking: EV High-Voltage Wiring Harness Replacement Parts Market
| Company | HV Harness Depth | Connector System Fit | Repair Validation Support | Geographic Footprint |
|---|---|---|---|---|
| Yazaki Corporation | High | High | High | Global with Japan strength |
| Sumitomo Electric Industries | High | Medium | High | Asia and Europe centered |
| Versigent Limited | High | High | Medium | Global with North America strength |
| Lear Corporation | Medium | High | Medium | Global with USA strength |
| TE Connectivity | Medium | High | High | Global connector depth |
| Samvardhana Motherson International | Medium | Medium | Medium | Global production footprint |
| LEONI Group | Medium | Medium | Medium | Europe and Egypt supply depth |
Source: Future Market Insights competitive analysis, 2026.
Key Developments in EV High-Voltage Wiring Harness Replacement Parts Market
- In December 2025, Samvardhana Motherson International Limited entered exclusive negotiations to potentially acquire 100% of the wiring harness business of Nexans Autoelectric GmbH.
- In April 2026, Versigent launched as an independent public company after separation from Aptiv’s Electrical Distribution Systems business.
Key Players in the EV High-Voltage Wiring Harness Replacement Parts Market
Major Global Players
- Yazaki Corporation
- Sumitomo Electric Industries
- Versigent Limited
- Lear Corporation
- TE Connectivity
Specialist and Regional Players
- Samvardhana Motherson International
- LEONI Group
- Amphenol Corporation
- Molex LLC
- Furukawa Electric Co., Ltd.
Report Scope and Coverage
| Parameter | Details |
|---|---|
| Quantitative Units | USD 0.8 billion to USD 2.5 billion at 11.7% CAGR |
| Market Definition | Replacement high-voltage wiring harness parts used in EV battery circuits and inverter circuits. Charging and drive circuits are included. |
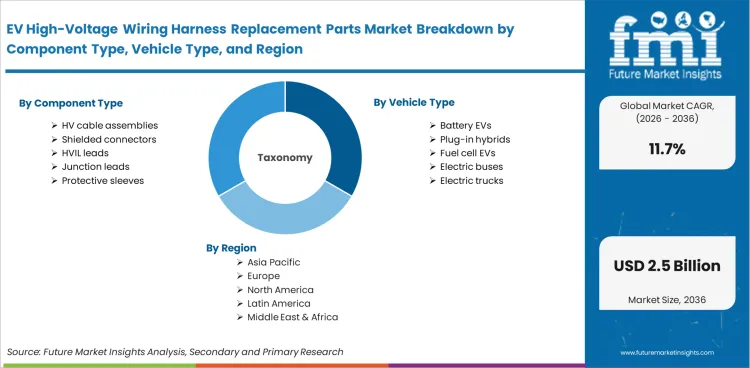
| Segments Covered | Component Type: HV Cable Assemblies, Shielded Connectors, HVIL Leads, Junction Leads, Protective Sleeves. Vehicle Type: Battery EVs, Plug-in Hybrids, Fuel Cell EVs, Electric Buses, Electric Trucks. Voltage Class: 400V Systems, 800V Systems, Above 800V Systems. Sales Channel: Authorized Dealers, Certified Workshops, Fleet Service, Parts Distributors, Online Sellers. Conductor Material: Copper Conductors, Aluminum Conductors, Hybrid Conductors. |
| Regions Covered | North America, Latin America, Western Europe, Eastern Europe, East Asia, South Asia Pacific, Middle East and Africa |
| Countries Covered | United States, China, India, Germany, France, Japan and United Kingdom complete named coverage |
| Key Companies Profiled | Yazaki Corporation, Sumitomo Electric Industries, Versigent Limited, Lear Corporation, TE Connectivity, Samvardhana Motherson International and LEONI Group |
| Forecast Period | 2026 to 2036 |
| Approach | Hybrid bottom-up and top-down method using EV sales and parc expansion. High-voltage part pricing and supplier activity completed the checks. |
Source: Future Market Insights, 2026.
EV High-Voltage Wiring Harness Replacement Parts Market Breakdown by Component Type, Vehicle Type, Voltage Class, Sales Channel, Conductor Material, and Region
EV High-Voltage Wiring Harness Replacement Parts Market Segmented by Component Type
- HV cable assemblies
- Shielded connectors
- HVIL leads
- Junction leads
- Protective sleeves
EV High-Voltage Wiring Harness Replacement Parts Market Segmented by Vehicle Type
- Battery EVs
- Plug-in hybrids
- Fuel cell EVs
- Electric buses
- Electric trucks
EV High-Voltage Wiring Harness Replacement Parts Market Segmented by Voltage Class
- 400V systems
- 800V systems
- Above 800V
EV High-Voltage Wiring Harness Replacement Parts Market Segmented by Sales Channel
- Authorized dealers
- Certified workshops
- Fleet service
- Parts distributors
- Online sellers
EV High-Voltage Wiring Harness Replacement Parts Market Segmented by Conductor Material
- Copper conductors
- Aluminum conductors
- Hybrid conductors
EV High-Voltage Wiring Harness Replacement Parts Market Segmented by Region
- North America
- Latin America
- Western Europe
- Eastern Europe
- East Asia
- South Asia and Pacific
- Middle East and Africa
Research Sources and Bibliography
- International Energy Agency. (2026, May). Electric vehicle batteries. International Energy Agency.
- International Energy Agency. (2026, May). Trends in electric cars. International Energy Agency.
- Ministry of Heavy Industries. (2025, February 11). Electrical vehicles in rural and semi-urban areas. Press Information Bureau, Government of India.
- Agency for Natural Resources and Energy. (2024, June 24). Subsidies upgraded for the purchase of clean energy vehicles toward the realization of GX in the automobile sector. Ministry of Economy, Trade and Industry.
- National Highway Traffic Safety Administration. (2024, December 20). Federal Motor Vehicle Safety Standards; FMVSS No. 305a Electric-Powered Vehicles: Electric Powertrain Integrity Global Technical Regulation No. 20 Incorporation by Reference. Federal Register.
- Versigent Limited. (2026, April 1). Versigent launches as new publicly traded company. Versigent Limited.
- Versigent Limited. (2026). High voltage electrical distribution systems. Versigent Limited.
- Lear Corporation. (2024). Automotive electrical & electronic systems. Lear Corporation.
- Samvardhana Motherson International Limited. (2025, December 22). Motherson reaches an agreement to acquire 100% of the wiring harness business of Nexans Autoelectric GmbH. Samvardhana Motherson International Limited.
This Report Answers
- How large will the EV high-voltage wiring harness replacement parts market be in 2026?
- What is the 2036 value outlook for EV high-voltage wiring harness replacement parts?
- Which CAGR is expected for the market between 2026 and 2036?
- Which component type is expected to lead demand in 2026?
- Why do battery EVs represent the main vehicle type for replacement parts?
- Which countries are expected to expand faster in the forecast decade?
- How do authorized dealers and certified workshops shape channel demand?
- Why do insulation and shielding checks affect supplier selection?
Frequently Asked Questions
What is the current size of the EV high-voltage wiring harness replacement parts market?
The market is expected to reach USD 0.8 billion in 2026 after standing at USD 0.7 billion in 2025.
What is the expected market value by 2036?
EV high-voltage wiring harness replacement parts market is forecast to reach USD 2.5 billion by 2036.
What CAGR is expected for the market?
Demand is expected to rise at 11.7% CAGR from 2026 to 2036.
Which component type is expected to lead in 2026?
HV cable assemblies are expected to lead component type demand with 39.0% share in 2026.
Battery EVs are anticipated to account for 61.5% of vehicle type demand in 2026.
Battery EVs are anticipated to account for 61.5% of vehicle type demand in 2026.
Which country is expected to expand faster?
India is expected to record 13.5% CAGR through 2036 as EV registrations and service needs increase.
Preview the report firsthand - request a free sample
Get SampleGet the brochure for pricing and purchase details.
Get PDFTable of Content
- Executive Summary
- Global Market Outlook
- Demand-side Trends
- Supply-side Trends
- Technology Roadmap Analysis
- Analysis and Recommendations
- Market Overview
- Market Coverage / Taxonomy
- Market Definition / Scope / Limitations
- Research Methodology
- Chapter Orientation
- Analytical Lens and Working Hypotheses
- Market Structure, Signals, and Trend Drivers
- Benchmarking and Cross-market Comparability
- Market Sizing, Forecasting, and Opportunity Mapping
- Research Design and Evidence Framework
- Desk Research Programme (Secondary Evidence)
- Company Annual and Sustainability Reports
- Peer-reviewed Journals and Academic Literature
- Corporate Websites, Product Literature, and Technical Notes
- Earnings Decks and Investor Briefings
- Statutory Filings and Regulatory Disclosures
- Technical White Papers and Standards Notes
- Trade Journals, Industry Magazines, and Analyst Briefs
- Conference Proceedings, Webinars, and Seminar Materials
- Government Statistics Portals and Public Data Releases
- Press Releases and Reputable Media Coverage
- Specialist Newsletters and Curated Briefings
- Sector Databases and Reference Repositories
- FMI Internal Proprietary Databases and Historical Market Datasets
- Subscription Datasets and Paid Sources
- Social Channels, Communities, and Digital Listening Inputs
- Additional Desk Sources
- Expert Input and Fieldwork (Primary Evidence)
- Primary Modes
- Qualitative Interviews and Expert Elicitation
- Quantitative Surveys and Structured Data Capture
- Blended Approach
- Why Primary Evidence is Used
- Field Techniques
- Interviews
- Surveys
- Focus Groups
- Observational and In-context Research
- Social and Community Interactions
- Stakeholder Universe Engaged
- C-suite Leaders
- Board Members
- Presidents and Vice Presidents
- R&D and Innovation Heads
- Technical Specialists
- Domain Subject-matter Experts
- Scientists
- Physicians and Other Healthcare Professionals
- Governance, Ethics, and Data Stewardship
- Research Ethics
- Data Integrity and Handling
- Primary Modes
- Tooling, Models, and Reference Databases
- Desk Research Programme (Secondary Evidence)
- Data Engineering and Model Build
- Data Acquisition and Ingestion
- Cleaning, Normalisation, and Verification
- Trends
- Scenario Forecast
- Demand in Optimistic Scenario
- Demand in Likely Scenario
- Demand in Conservative Scenario
- Opportunity Map Analysis
- Product Life Cycle Analysis
- Supply Chain Analysis
- Investment Feasibility Matrix
- Value Chain Analysis
- PESTLE and Porter’s Analysis
- Regulatory Landscape
- Regional Parent Market Outlook
- Production and Consumption Statistics
- Import and Export Statistics
- Global Market Analysis 2021 to 2025 and Forecast, 2026 to 2036
- Historical Market Size Value (USD Million) Analysis, 2021 to 2025
- Current and Future Market Size Value (USD Million) Projections, 2026 to 2036
- Y-o-Y Growth Trend Analysis
- Absolute $ Opportunity Analysis
- Global Market Pricing Analysis 2021 to 2025 and Forecast 2026 to 2036
- Global Market Analysis 2021 to 2025 and Forecast 2026 to 2036, By Cover Type
- Introduction / Key Findings
- Historical Market Size Value (USD Million) Analysis By Cover Type , 2021 to 2025
- Current and Future Market Size Value (USD Million) Analysis and Forecast By Cover Type , 2026 to 2036
- Tethered caps
- Hinged doors
- Sliding lids
- Magnetic covers
- Gasket covers
- Tethered caps
- Y-o-Y Growth Trend Analysis By Cover Type , 2021 to 2025
- Absolute $ Opportunity Analysis By Cover Type , 2026 to 2036
- Global Market Analysis 2021 to 2025 and Forecast 2026 to 2036, By Material
- Introduction / Key Findings
- Historical Market Size Value (USD Million) Analysis By Material, 2021 to 2025
- Current and Future Market Size Value (USD Million) Analysis and Forecast By Material, 2026 to 2036
- TPE seals
- Polyamide
- Polypropylene
- Silicone rubber
- PC ABS
- TPE seals
- Y-o-Y Growth Trend Analysis By Material, 2021 to 2025
- Absolute $ Opportunity Analysis By Material, 2026 to 2036
- Global Market Analysis 2021 to 2025 and Forecast 2026 to 2036, By Charging Interface
- Introduction / Key Findings
- Historical Market Size Value (USD Million) Analysis By Charging Interface, 2021 to 2025
- Current and Future Market Size Value (USD Million) Analysis and Forecast By Charging Interface, 2026 to 2036
- CCS covers
- Type 2 covers
- NACS covers
- GB/T covers
- CHAdeMO covers
- LEV covers
- CCS covers
- Y-o-Y Growth Trend Analysis By Charging Interface, 2021 to 2025
- Absolute $ Opportunity Analysis By Charging Interface, 2026 to 2036
- Global Market Analysis 2021 to 2025 and Forecast 2026 to 2036, By Vehicle Type
- Introduction / Key Findings
- Historical Market Size Value (USD Million) Analysis By Vehicle Type, 2021 to 2025
- Current and Future Market Size Value (USD Million) Analysis and Forecast By Vehicle Type, 2026 to 2036
- Passenger EVs
- Light commercial EVs
- Electric buses
- Two-wheelers
- Off-highway EVs
- Passenger EVs
- Y-o-Y Growth Trend Analysis By Vehicle Type, 2021 to 2025
- Absolute $ Opportunity Analysis By Vehicle Type, 2026 to 2036
- Global Market Analysis 2021 to 2025 and Forecast 2026 to 2036, By Sales Channel
- Introduction / Key Findings
- Historical Market Size Value (USD Million) Analysis By Sales Channel, 2021 to 2025
- Current and Future Market Size Value (USD Million) Analysis and Forecast By Sales Channel, 2026 to 2036
- OEM fitment
- Aftermarket kits
- Service replacement
- Fleet spares
- OEM fitment
- Y-o-Y Growth Trend Analysis By Sales Channel, 2021 to 2025
- Absolute $ Opportunity Analysis By Sales Channel, 2026 to 2036
- Global Market Analysis 2021 to 2025 and Forecast 2026 to 2036, By Region
- Introduction
- Historical Market Size Value (USD Million) Analysis By Region, 2021 to 2025
- Current Market Size Value (USD Million) Analysis and Forecast By Region, 2026 to 2036
- North America
- Latin America
- Western Europe
- Eastern Europe
- East Asia
- South Asia and Pacific
- Middle East & Africa
- Market Attractiveness Analysis By Region
- North America Market Analysis 2021 to 2025 and Forecast 2026 to 2036, By Country
- Historical Market Size Value (USD Million) Trend Analysis By Market Taxonomy, 2021 to 2025
- Market Size Value (USD Million) Forecast By Market Taxonomy, 2026 to 2036
- By Country
- USA
- Canada
- Mexico
- By Cover Type
- By Material
- By Charging Interface
- By Vehicle Type
- By Sales Channel
- By Country
- Market Attractiveness Analysis
- By Country
- By Cover Type
- By Material
- By Charging Interface
- By Vehicle Type
- By Sales Channel
- Key Takeaways
- Latin America Market Analysis 2021 to 2025 and Forecast 2026 to 2036, By Country
- Historical Market Size Value (USD Million) Trend Analysis By Market Taxonomy, 2021 to 2025
- Market Size Value (USD Million) Forecast By Market Taxonomy, 2026 to 2036
- By Country
- Brazil
- Chile
- Rest of Latin America
- By Cover Type
- By Material
- By Charging Interface
- By Vehicle Type
- By Sales Channel
- By Country
- Market Attractiveness Analysis
- By Country
- By Cover Type
- By Material
- By Charging Interface
- By Vehicle Type
- By Sales Channel
- Key Takeaways
- Western Europe Market Analysis 2021 to 2025 and Forecast 2026 to 2036, By Country
- Historical Market Size Value (USD Million) Trend Analysis By Market Taxonomy, 2021 to 2025
- Market Size Value (USD Million) Forecast By Market Taxonomy, 2026 to 2036
- By Country
- Germany
- UK
- Italy
- Spain
- France
- Nordic
- BENELUX
- Rest of Western Europe
- By Cover Type
- By Material
- By Charging Interface
- By Vehicle Type
- By Sales Channel
- By Country
- Market Attractiveness Analysis
- By Country
- By Cover Type
- By Material
- By Charging Interface
- By Vehicle Type
- By Sales Channel
- Key Takeaways
- Eastern Europe Market Analysis 2021 to 2025 and Forecast 2026 to 2036, By Country
- Historical Market Size Value (USD Million) Trend Analysis By Market Taxonomy, 2021 to 2025
- Market Size Value (USD Million) Forecast By Market Taxonomy, 2026 to 2036
- By Country
- Russia
- Poland
- Hungary
- Balkan & Baltic
- Rest of Eastern Europe
- By Cover Type
- By Material
- By Charging Interface
- By Vehicle Type
- By Sales Channel
- By Country
- Market Attractiveness Analysis
- By Country
- By Cover Type
- By Material
- By Charging Interface
- By Vehicle Type
- By Sales Channel
- Key Takeaways
- East Asia Market Analysis 2021 to 2025 and Forecast 2026 to 2036, By Country
- Historical Market Size Value (USD Million) Trend Analysis By Market Taxonomy, 2021 to 2025
- Market Size Value (USD Million) Forecast By Market Taxonomy, 2026 to 2036
- By Country
- China
- Japan
- South Korea
- By Cover Type
- By Material
- By Charging Interface
- By Vehicle Type
- By Sales Channel
- By Country
- Market Attractiveness Analysis
- By Country
- By Cover Type
- By Material
- By Charging Interface
- By Vehicle Type
- By Sales Channel
- Key Takeaways
- South Asia and Pacific Market Analysis 2021 to 2025 and Forecast 2026 to 2036, By Country
- Historical Market Size Value (USD Million) Trend Analysis By Market Taxonomy, 2021 to 2025
- Market Size Value (USD Million) Forecast By Market Taxonomy, 2026 to 2036
- By Country
- India
- ASEAN
- Australia & New Zealand
- Rest of South Asia and Pacific
- By Cover Type
- By Material
- By Charging Interface
- By Vehicle Type
- By Sales Channel
- By Country
- Market Attractiveness Analysis
- By Country
- By Cover Type
- By Material
- By Charging Interface
- By Vehicle Type
- By Sales Channel
- Key Takeaways
- Middle East & Africa Market Analysis 2021 to 2025 and Forecast 2026 to 2036, By Country
- Historical Market Size Value (USD Million) Trend Analysis By Market Taxonomy, 2021 to 2025
- Market Size Value (USD Million) Forecast By Market Taxonomy, 2026 to 2036
- By Country
- Kingdom of Saudi Arabia
- Other GCC Countries
- Turkiye
- South Africa
- Other African Union
- Rest of Middle East & Africa
- By Cover Type
- By Material
- By Charging Interface
- By Vehicle Type
- By Sales Channel
- By Country
- Market Attractiveness Analysis
- By Country
- By Cover Type
- By Material
- By Charging Interface
- By Vehicle Type
- By Sales Channel
- Key Takeaways
- Key Countries Market Analysis
- USA
- Pricing Analysis
- Market Share Analysis, 2025
- By Cover Type
- By Material
- By Charging Interface
- By Vehicle Type
- By Sales Channel
- Canada
- Pricing Analysis
- Market Share Analysis, 2025
- By Cover Type
- By Material
- By Charging Interface
- By Vehicle Type
- By Sales Channel
- Mexico
- Pricing Analysis
- Market Share Analysis, 2025
- By Cover Type
- By Material
- By Charging Interface
- By Vehicle Type
- By Sales Channel
- Brazil
- Pricing Analysis
- Market Share Analysis, 2025
- By Cover Type
- By Material
- By Charging Interface
- By Vehicle Type
- By Sales Channel
- Chile
- Pricing Analysis
- Market Share Analysis, 2025
- By Cover Type
- By Material
- By Charging Interface
- By Vehicle Type
- By Sales Channel
- Germany
- Pricing Analysis
- Market Share Analysis, 2025
- By Cover Type
- By Material
- By Charging Interface
- By Vehicle Type
- By Sales Channel
- UK
- Pricing Analysis
- Market Share Analysis, 2025
- By Cover Type
- By Material
- By Charging Interface
- By Vehicle Type
- By Sales Channel
- Italy
- Pricing Analysis
- Market Share Analysis, 2025
- By Cover Type
- By Material
- By Charging Interface
- By Vehicle Type
- By Sales Channel
- Spain
- Pricing Analysis
- Market Share Analysis, 2025
- By Cover Type
- By Material
- By Charging Interface
- By Vehicle Type
- By Sales Channel
- France
- Pricing Analysis
- Market Share Analysis, 2025
- By Cover Type
- By Material
- By Charging Interface
- By Vehicle Type
- By Sales Channel
- India
- Pricing Analysis
- Market Share Analysis, 2025
- By Cover Type
- By Material
- By Charging Interface
- By Vehicle Type
- By Sales Channel
- ASEAN
- Pricing Analysis
- Market Share Analysis, 2025
- By Cover Type
- By Material
- By Charging Interface
- By Vehicle Type
- By Sales Channel
- Australia & New Zealand
- Pricing Analysis
- Market Share Analysis, 2025
- By Cover Type
- By Material
- By Charging Interface
- By Vehicle Type
- By Sales Channel
- China
- Pricing Analysis
- Market Share Analysis, 2025
- By Cover Type
- By Material
- By Charging Interface
- By Vehicle Type
- By Sales Channel
- Japan
- Pricing Analysis
- Market Share Analysis, 2025
- By Cover Type
- By Material
- By Charging Interface
- By Vehicle Type
- By Sales Channel
- South Korea
- Pricing Analysis
- Market Share Analysis, 2025
- By Cover Type
- By Material
- By Charging Interface
- By Vehicle Type
- By Sales Channel
- Russia
- Pricing Analysis
- Market Share Analysis, 2025
- By Cover Type
- By Material
- By Charging Interface
- By Vehicle Type
- By Sales Channel
- Poland
- Pricing Analysis
- Market Share Analysis, 2025
- By Cover Type
- By Material
- By Charging Interface
- By Vehicle Type
- By Sales Channel
- Hungary
- Pricing Analysis
- Market Share Analysis, 2025
- By Cover Type
- By Material
- By Charging Interface
- By Vehicle Type
- By Sales Channel
- Kingdom of Saudi Arabia
- Pricing Analysis
- Market Share Analysis, 2025
- By Cover Type
- By Material
- By Charging Interface
- By Vehicle Type
- By Sales Channel
- Turkiye
- Pricing Analysis
- Market Share Analysis, 2025
- By Cover Type
- By Material
- By Charging Interface
- By Vehicle Type
- By Sales Channel
- South Africa
- Pricing Analysis
- Market Share Analysis, 2025
- By Cover Type
- By Material
- By Charging Interface
- By Vehicle Type
- By Sales Channel
- USA
- Market Structure Analysis
- Competition Dashboard
- Competition Benchmarking
- Market Share Analysis of Top Players
- By Regional
- By Cover Type
- By Material
- By Charging Interface
- By Vehicle Type
- By Sales Channel
- Competition Analysis
- Competition Deep Dive
- TE Connectivity plc
- Overview
- Product Portfolio
- Profitability by Market Segments (Product/Age /Sales Channel/Region)
- Sales Footprint
- Strategy Overview
- Marketing Strategy
- Product Strategy
- Channel Strategy
- Aptiv PLC
- Yazaki Corporation
- Sumitomo Wiring Systems, Ltd.
- ITT Cannon
- HARTING Technology Group
- Amphenol Corporation
- TE Connectivity plc
- Competition Deep Dive
- Assumptions & Acronyms Used


