

- Market Size (2026)
- USD 1.2 Bn
- Forecast (2036)
- USD 2.1 Bn
- CAGR (2026 to 2036)
- 5.6%
How big is the Excavation Safety Fencing Market in 2026?
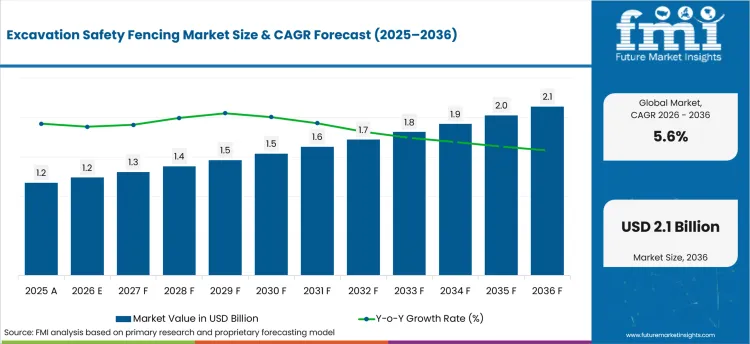
USD 1,240.6 million in 2026 and USD 2,139.3 million by 2036 at a 5.6% CAGR.
Sales in the excavation safety fencing market are projected to grow at 5.6% CAGR through 2036, driving valuation to USD 2,139.3 million by 2036 from USD 1,240.6 million in 2026. Contractors face direct schedule and liability exposure when an open cut remains accessible after crews leave. That pressure links site perimeter control to construction worker safety during daily setup and shift handover. In December 2025 OSHA proposed $1.224 million in penalties after a follow-up excavation inspection in Connecticut. The case is expected to keep documented barrier placement and visible access control close to contractor approval decisions.
India and China are projected to favor locally stocked systems that move quickly between utility and transport works. United States and United Kingdom contractors are expected to stress documented installation guidance because enforcement and tender review shape site approval. Engineering teams examine panel stability and gate placement before release while procurement teams compare rental response with replacement stock and crew instructions. In March 2025 the National Development and Reform Commission reported that China upgraded 66,000 kilometers of old gas pipelines. The work is expected to keep repeat demand visible for temporary fencing panels near linear utility projects. Procurement teams are expected to favor systems crews install correctly on site without delaying excavation work.
| Metric | Value |
|---|---|
| 2025 Market Size | USD 1,174.8 million |
| 2026 Market Size | USD 1,240.6 million |
| 2036 Market Size | USD 2,139.3 million |
| Forecast CAGR (2026–2036) | 5.6% |
| Fence Type Focus | Temporary Mesh Fencing |
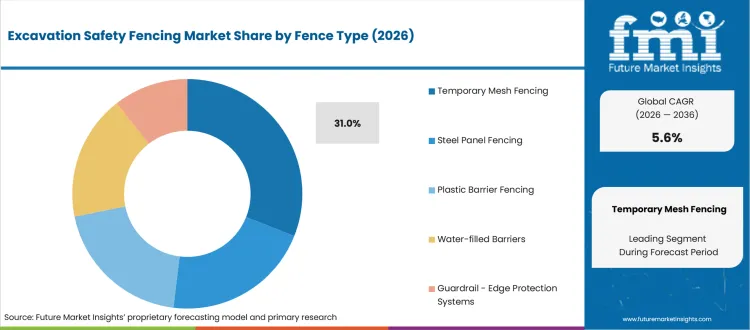
| Temporary Mesh Fencing Share (2026) | 31.0% |
| Height Focus | 1.2–1.8 m |
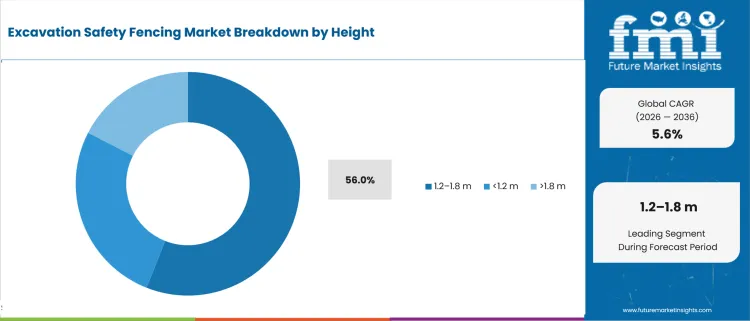
| 1.2–1.8 m Share (2026) | 56.0% |
| Application Focus | Open Trench Protection |
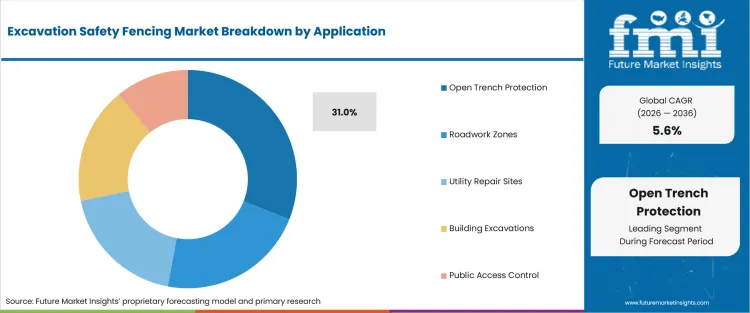
| Open Trench Protection Share (2026) | 31.0% |
| Fastest-growing Country | India |
| India CAGR by 2036 | 7.4% |
Summary of the Excavation Safety Fencing Market
| Market Signal | Commercial Impact |
| Demand and Growth Drivers | Excavation fencing demand is expected to follow the points where contractors must separate workers and the public from an active cut. Rental response and visible site control shape whether a crew keeps the same fencing system across repeat jobs.
|
| Product and Segment View | Temporary mesh fencing is projected to carry the fence-type position because crews move panels between short-duration cuts and height choice is expected to follow visibility needs near access routes.
|
| Geography and Growth Outlook | Country growth is expected to split between project volume and approval discipline because India and China are projected to create placement cycles while established procurement systems stress written setup guidance.
|
| Competitive Landscape | Competition is expected to separate manufacturers that control panel design from rental groups controlling delivery. Contractors compare availability when a cut opens unexpectedly before reviewing stability guidance and service response.
|
| Analyst Perspective | Trade-remedy exposure has become a practical sourcing issue for temporary steel fencing accounts across projects. Contractors are expected to compare landed-cost stability and local stock depth before switching a proven system.
- Nikhil Kaitwade, Principal Consultant at Future Market Insights |
Source: FMI's proprietary forecasting model and primary research
How is the excavation safety fencing market segmented?
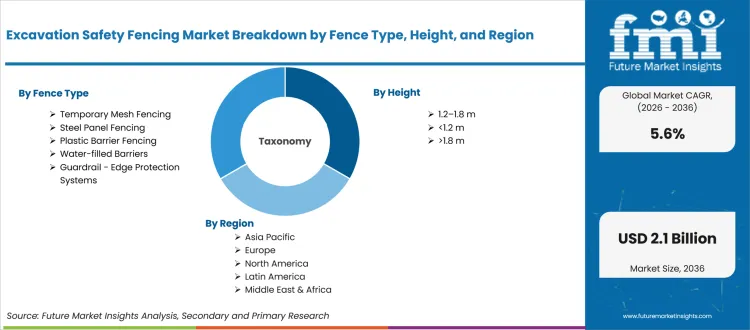
The excavation safety fencing industry is segmented by fence type, height, application, end use, sales model, and region.
The scope separates fence type from height because crews match barrier format to site conditions. Fence type covers temporary mesh fencing, steel panels, plastic barriers, water-filled barriers, guardrail and edge protection systems. Height bands cover below 1.2 m, from 1.2 to 1.8 m, and above 1.8 m. Applications include open trench protection, roadwork zones, utility repair sites, building excavations, and public access control. End use covers construction contractors, utilities, municipal or road agencies, and industrial sites while sales models include rental, direct purchase, and distributor or contractor supply. Regions span North America, Latin America, Europe, East Asia, South Asia, Oceania, and Middle East and Africa.
What supports demand for temporary mesh fencing within the fence type category?
Short street excavations create a different perimeter problem from long fenced construction compounds on major sites. Crews need panels they move as the cut advances while gates remain visible to pedestrians. Heras joined Garda Group in April 2025 after competition clearance and combined wider perimeter service coverage across Europe. The change is expected to sharpen account comparisons around temporary systems that pair standard panel layouts with local delivery and setup support.
- Based on fence type, temporary mesh fencing is projected to account for 31.0% in 2026 due to its fit with repeat utility and road repair work. In August 2025 ZND served as temporary fence sponsor for the Mubadala Citi DC Open. Use at the event is expected to keep panel movement and access control inside reviews for layouts that change quickly.
- Temporary mesh fencing is drawing demand from civil contractors owing to its ability to follow changing excavation lengths without rebuilding a rigid perimeter. In May 2026 EPA said the funding would be distributed based on the best available information on the location of approximately 4 million lead service lines across the country. Related work-zone warning tape is expected to remain a secondary visual control while fencing separates the public from each short excavation.
How is 1.2-1.8 m positioned within the height category?
Height selection is expected to reflect visibility and handling limits around short excavation work zones. A barrier must remain obvious to pedestrians without blocking sight lines used by vehicle spotters. In April 2026 the Department for Transport said 25% of the funding uplift would be held back until local authorities met incentive requirements. The approach is expected to keep compact barriers and clear access routes under review across road repair sites.
- By height, the 1.2-1.8 m category is estimated to hold 56.0% in 2026 owing to the balance between visible separation and manageable handling. In March 2025 the Department for Transport set out England’s strategic road network interim settlement for 2025-26. The program is expected to keep height selection tied to visibility and handling around active maintenance works.
- Demand for the 1.2-1.8 m category is expected to grow among municipal works teams because compact street layouts require repeated panel movement. In January 2026 the Office of Rail and Road reported 89 government-agreed changes to the RIS2 enhancements portfolio. Related perimeter security systems are anticipated to shape gate-control reviews on larger compounds where revised schedules alter work-zone access.
What drives open trench protection demand within the application category?
Open trenches concentrate fencing decisions where unauthorized entry exposes a person to a hazardous cut. OSHA’s April 2026 Yarmouth enforcement release cited 33 repeat violations after a fatal cave-in during trench work. The case is expected to keep perimeter control connected to broader excavation planning and competent supervision. Contractors therefore examine gate location and barrier stability before access routes are released beside water or sewer work.
- In 2026, open trench protection is expected to lead the application category with 31.0% share because barriers directly control public access near an open cut. In January 2026 the USA Department of Labor reported trench hazards at a Bessemer worksite, keeping edge barriers and controlled access inside contractor reviews before nearby routes reopen.
- Construction contractors are increasingly purchasing open trench protection because short municipal repair windows require frequent traffic reopening. In May 2025 FHWA requested transportation safety outreach and education that includes work-zone safety. Related personal protective equipment is expected to remain part of worker protection planning while fencing keeps unapproved people outside the excavation work area.
What are the drivers, restraints, and opportunities in the excavation safety fencing market?
Near-term purchases are projected to reflect excavation enforcement and trade-remedy costs while rapid-response utility work is expected to open the opportunity outlined below.
- Driver: Contractor demand is expected to rise where excavation enforcement makes visible access control part of daily site planning.
- Restraint: Trade-remedy exposure is anticipated to complicate landed-cost comparisons for steel fencing imported from China.
- Opportunity: Utility renewal programs are projected to open rental and service accounts for vendors able to dispatch complete perimeter layouts quickly.
Contractors working near open cuts face direct exposure when basic controls are incomplete during active excavation work. In April 2026 OSHA cited an Alabama construction company for 8 serious violations after a fatal incident. The enforcement record is expected to keep fencing choices connected to site inspections and safe access routes. Rental groups that document installation steps are projected to receive more repeat work when supervisors need a barrier layout before excavation crews return.
Import pricing creates a separate problem for steel-panel accounts that depend on long supply routes. The USA International Trade Administration announced final determinations in March 2026 and reported a China-wide antidumping rate of 184.27%. Procurement teams are expected to compare origin and duty exposure before locking annual fencing schedules. The restraint is projected to favor contractors that hold local stock or use rental channels when landed-cost changes make direct replacement planning less predictable.
Utility works create a clear route from the restraint to a service opportunity because crews often need barriers before a purchase cycle finishes. In February 2026 Press Information Bureau said government capital outlay had risen 4.2x from FY 2018 to FY 2026 budget estimates. The project base is expected to support recurring excavation work in transport and urban services. Providers that coordinate fencing delivery with site schedules are projected to gain attention from contractors seeking fewer logistics handoffs within the excavation permit window.
Which country CAGRs are profiled in the excavation safety fencing market?
.webp "Top Country Growth Comparison Excavation Safety Fencing Market Cagr (2026 2036)")
| Country | CAGR |
|---|---|
| United States | 4.7% |
| China | 6.7% |
| India | 7.4% |
| Germany | 4.3% |
| United Kingdom | 5.0% |
| Japan | 4.0% |
| Canada | 5.2% |
Source: FMI's proprietary forecasting model and primary research
How do country-level CAGRs compare in the excavation safety fencing market?
Country growth is projected to reflect crew movement and public access while India and China are expected to create placement cycles through utility and transport work. United States and United Kingdom accounts are anticipated to stress setup guidance after enforcement or temporary works review. Germany and Japan are projected to favor clear load assumptions before site release while Canada is estimated to emphasize rental response across spread-out municipal programs. In August 2025 Office for National Statistics data showed UK infrastructure new work rose 3.2% during the second quarter of 2025. This infrastructure activity is expected to keep excavation barriers central to work-zone planning.
- EPA’s national lead-pipe inventory keeps replacement excavation visible across USA water systems and city streets. United States demand is projected to grow at 4.7% CAGR by 2036 owing to water utility renewal and enforcement exposure. In November 2025 EPA estimated 4 million lead service lines remained across the country in public water systems. The inventory is expected to keep short street openings and restoration work active during utility replacement programs. National Construction Rentals and United Rentals provide rental channels that contractors use when projects move between cities. Selection is anticipated to depend on dispatch speed and gate options alongside written setup guidance. The next competitive question concerns which network keeps compatible replacement panels close enough to avoid reopening delays after damage.
- Pipeline transport investment increased during 2025 even as broader fixed-asset investment weakened across the country. Contractors serving urban utility corridors compare local fabrication and fast replacement before committing to a panel format. China’s excavation safety fencing demand is forecast to rise at 6.7% CAGR over the forecast period owing to repeated utility and transport work. In January 2026 the National Bureau of Statistics of China reported investment in electricity and gas supply alongside water supply increased 9.1% during 2025. The investment increase is expected to keep excavation perimeters active around utility construction even when broader infrastructure investment varies. Anping County Xingpeng Hardware Co. Ltd. appears in the USA trade case as a temporary steel fencing producer or exporter. Local accounts are anticipated to focus on batch consistency and replacement access before switching systems across recurring municipal works.
- India’s public works pipeline is widening the number of places where contractors need temporary separation around active cuts. The practical constraint remains uneven availability of complete systems outside established construction hubs in many states. India is estimated to post 7.4% CAGR over the forecast period owing to transport and urban service investment. Official data from Press Information Bureau placed Jal Jeevan Mission tap-water coverage at around 154.4 million rural households in February 2025. The program is expected to sustain village water works that create repeated short-duration excavation sites. Projects tendered by the National Highways Authority of India and delivered by contractors such as Larsen & Toubro are projected to keep safety documentation visible during tender and subcontractor review. Vendors are anticipated to gain accounts where stock depth matches project sequencing across several states without forcing crews to improvise missing gates or feet.
- Cold weather gave Germany a sharp reminder that civil engineering activity shifts quickly between months. Contractors therefore need perimeter systems that remain available even when schedules move after frost or site access delays. In March 2026 Destatis recorded a 7.5% decline in civil engineering production during January 2026. Excavation safety fencing demand in Germany is estimated to expand at 4.3% CAGR through 2036 owing to technical review and infrastructure maintenance. Heras Mobile and regional rental channels are expected to be judged on written load assumptions and service coverage near active works. Procurement teams are anticipated to compare system stability before approving screens or wind-catching attachments during technical reviews. Commercial tension is expected to arise between standardized national specifications and local crews needing replacement parts at short notice.
- Japan’s dense work zones often place excavation edges beside narrow pedestrian routes and existing utility networks. Japan demand is anticipated to advance at 4.0% CAGR through 2036 due to renewal work and careful site release procedures. The construction base is expected to keep temporary barriers close to traffic marshaling and phased access planning. Taisei Corporation and other general contractors are projected to expect clear installation drawings when work fronts change inside constrained cities. Rental availability is estimated to carry less weight than repeatable setup and reliable panel condition on high-visibility sites.
- In the United Kingdom demand is anticipated to advance at 5.0% CAGR through 2036 due to utility renewal and roadworks scheduling. Altrad Generation’s UK branch network is expected to face closer service comparisons while rental accounts weigh delivery time and setup support. In June 2026 HSE urged construction companies to maintain perimeter fencing or hoarding and secure sites when crews leave so United Kingdom contractors keep access control inside daily site review. In June 2025 Office for National Statistics data showed infrastructure new work increased 3.5% in the three months to April 2025. Related traffic control coatings are projected to remain part of the same work-zone procurement conversation.
- Canada’s municipal and utility work spans wide service areas where one depot does not cover every replacement need. In April 2026 Statistics Canada reported that non-residential building investment edged up 0.7% in February 2026. The construction base is expected to support recurring perimeter demand around service connections and site access changes. United Rentals Canada gives national contractors a channel linking equipment rental with temporary site needs. Canada’s excavation safety fencing sector is projected to record 5.2% CAGR during the assessment period owing to municipal construction and utility repair. Accounts are anticipated to compare delivery radius and winter-ready feet before placing repeat orders during winter work. The route to account expansion is expected to favor service networks that keep compatible panels and gates available across several provinces.
Who are the notable companies in the excavation safety fencing market?
Heras Mobile, ZND, Oxford Plastics, SONCO, National Construction Rentals, United Rentals, Sunbelt Rentals, National Trench Safety, Altrad Generation, and Trench Shoring Company are the notable companies shaping this market.
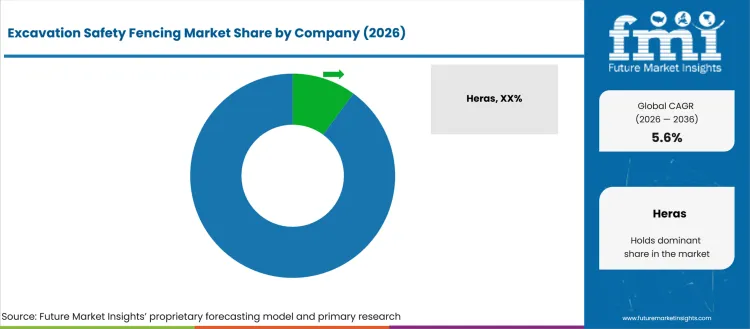
The competitive field is expected to split between panel manufacturers and rental networks alongside trench specialists. Contractors judge a supplier first on whether compatible panels and gates are available when a cut opens. Technical review then moves to wind exposure and the choice of feet or braces before field release. In March 2026 the USA International Trade Administration reported a 49.19% all-others subsidy rate in its temporary steel fencing determination. The trade exposure is expected to make local stock and origin documentation part of account review. Adjacent needs such as acoustic site barriers are projected to reward vendors that coordinate several temporary site controls through one service route.
- Heras Mobile and ZND compete where contractors want standardized temporary perimeter systems backed by installation guidance. Heras brings European perimeter coverage while ZND links panel supply with site-specific wind guidance for exposed worksites. Both are expected to be judged on bracing options and replacement compatibility across repeat construction accounts.
- Contractors in pedestrian-heavy work zones compare lighter barrier formats with conventional mesh panels near city streets. Oxford Plastics brings molded barrier systems and narrow layout options while SONCO supplies chain-link temporary fence panels with access components. Account decisions are projected to depend on visibility and handling needs near public routes and crossings.
- National Construction Rentals and United Rentals compete on delivery reach while Sunbelt Rentals adds broad event and project service capacity. These rental networks are expected to fit contractors that move between cities or need replacement stock quickly. Account retention is projected to depend on compatible inventory and reliable installation support across regions.
- National Trench Safety pairs trench equipment with traffic safety services while Altrad Generation combines temporary fencing with broader groundworks supply. Trench Shoring Company adds regional trench and temporary fence support in the western United States. These firms are expected to compete where contractors prefer fewer service handoffs around excavation work.
Competitive Benchmarking: Excavation Safety Fencing Market
| Company | Excavation Perimeter Fit | Rental Deployment | Specification Support | Service Reach |
|---|---|---|---|---|
| Heras Mobile | High | Medium | High | Global |
| ZND | High | Medium | High | Global |
| Oxford Plastics | High | Medium | High | Global |
| SONCO | High | High | Medium | Country-specific; United States |
| National Construction Rentals | High | High | Medium | Country-specific; United States |
| United Rentals | High | High | High | Regional; North America and Australia |
| Sunbelt Rentals | Medium | High | Medium | Regional; North America |
| National Trench Safety | High | High | High | Regional; United States and United Kingdom |
| Altrad Generation | High | High | High | Regional; United Kingdom and Ireland |
| Trench Shoring Company | High | High | High | Regional; Western United States |
Source: Future Market Insights competitive analysis, 2026. Ratings reflect relative portfolio relevance and workflow fit. Service capability and geographic reach shape the remaining comparison.
Key Developments in the Excavation Safety Fencing Market
- In June 2025, ZND published temporary fencing guidance for high-wind sites and outlined bracing choices for exposed locations. The company linked panel selection with site exposure and installer decisions instead of treating a temporary fence as a uniform layout.
- In February 2025, Altrad Generation acquired the UK assets and branch operations of Heras Mobile Fencing & Security. The transaction added temporary fencing and steel hoarding operations to Altrad Generation’s construction equipment network.
Key Players in the Excavation Safety Fencing Market
Temporary perimeter manufacturers
- Heras Mobile
- ZND
- Oxford Plastics
- SONCO
Rental and jobsite service providers
- National Construction Rentals
- United Rentals
- Sunbelt Rentals
Trench safety and groundworks specialists
- National Trench Safety
- Altrad Generation
- Trench Shoring Company
Excavation Safety Fencing Market - Report Scope
| Coverage field | Report scope |
|---|---|
| Market breakdown | By fence type, height, application, end use, sales model, and region |
| Quantitative Units | Revenue in USD Million, CAGR in % |
| Market Definition | Temporary and semi-temporary fencing or barrier systems used to separate excavation work areas from workers, vehicles, and public access routes. |
| Regions Covered | North America, Latin America, Europe, East Asia, South Asia, Oceania, and Middle East and Africa |
| Countries Covered | United States, Canada, China, Japan, South Korea, India, Thailand, Indonesia, Germany, United Kingdom, France, Italy, Spain, Australia, New Zealand, Brazil, Mexico, Argentina, GCC countries, South Africa, and Turkey |
| Key Companies Profiled | Heras Mobile, ZND, Oxford Plastics, SONCO, National Construction Rentals, United Rentals, Sunbelt Rentals, National Trench Safety, Altrad Generation, and Trench Shoring Company |
| Forecast Period | 2026 to 2036 |
| Approach | Hybrid methodology using bottom-up project and channel estimates with top-down construction and infrastructure checks |
Source: Future Market Insights – analysis driven by proprietary forecasting models and primary research
Excavation Safety Fencing Market - Research Methodology
| Method | Approach |
|---|---|
| Primary Research | FMI interviews civil contractors and rental managers alongside safety supervisors who use temporary barriers near excavation work. Interviews test purchase timing and rental duration before comparing approval factors such as gate access and replacement response. Discussion also covers panel handling and bracing practice across short road cuts and utility repairs. Findings are coded by end use and sales model before they enter the forecasting process. |
| Desk Research | Desk research reviews construction activity and infrastructure programs alongside excavation guidance and company product documentation. Country signals are mapped to excavation exposure instead of broad construction size alone within the final model. Analysts compare the type and timing of works with the need for temporary access control near open cuts. |
| Market Sizing and Forecasting | Market sizing combines fence-type demand with rental utilization and direct-purchase replacement cycles for each country forecast. Estimates are built from country project activity before being checked against channel coverage and company disclosures. Analysts compare temporary mesh use with height and application assumptions to avoid double counting between rental and direct-purchase demand. Forecasts are then tested against service reach and replacement frequency across contractor accounts. |
| Data Validation | Forecasts are reconciled through contractor feedback and rental service checks before country and segment estimates are finalized. The process compares panel availability and application mix alongside sourcing changes across procurement scenarios. Analysts test whether country forecasts remain consistent with the disclosed segment shares and sales-model logic. |
Source: Future Market Insights (FMI) analysis, based on proprietary forecasting model and primary research
Excavation Safety Fencing Market by Segments
Excavation Safety Fencing Market segmented by Fence Type:
- Temporary Mesh Fencing
- Steel Panel Fencing
- Plastic Barrier Fencing
- Water-filled Barriers
- Guardrail / Edge Protection Systems
Excavation Safety Fencing Market segmented by Height:
- <1.2 m
- 1.2-1.8 m
- >1.8 m
Excavation Safety Fencing Market segmented by Application:
- Open Trench Protection
- Roadwork Zones
- Utility Repair Sites
- Building Excavations
- Public Access Control
Excavation Safety Fencing Market segmented by End Use:
- Construction Contractors
- Utilities
- Municipal / Road Agencies
- Industrial Sites
Excavation Safety Fencing Market segmented by Sales Model:
- Rental
- Direct Purchase
- Distributor / Contractor Supply
Excavation Safety Fencing Market by Region:
- North America
- United States
- Canada
- Latin America
- Brazil
- Mexico
- Argentina
- Europe
- Germany
- United Kingdom
- France
- Italy
- Spain
- East Asia
- China
- Japan
- South Korea
- South Asia
- India
- Thailand
- Indonesia
- Oceania
- Australia
- New Zealand
- Middle East and Africa
- GCC Countries
- South Africa
- Türkiye
Research Sources and Bibliography
- USA Department of Labor, Occupational Safety and Health Administration. (2025, June). US Department of Labor urges safe practices during trench and excavation work. Occupational Safety and Health Administration.
- USA Department of Labor, Occupational Safety and Health Administration. (2025, December). US Department of Labor cites Connecticut earthwork contractor for continued violations after follow-up inspection, proposes $1.2M fine. Occupational Safety and Health Administration.
- National Development and Reform Commission. (2025, March). Report on China's national economic, social development plan. State Council of the People's Republic of China.
- Health and Safety Executive. (2025, July). Latest annual work-related fatalities published. Health and Safety Executive.
- Heras Mobile Fencing & Security. (2025, May). Stable and long-lasting: what characterises modern temporary fencing? Heras Mobile Fencing & Security.
- Press Information Bureau. (2025, February). HIGHLIGHTS OF UNION BUDGET 2025-26. Government of India.
- USA International Trade Administration. (2025, February). Commerce Initiates Antidumping and Countervailing Investigations of Temporary Steel Fencing from the People’s Republic of China. USA Department of Commerce.
- Heras Mobile Fencing & Security. (2025, April). Heras joins Garda Group to strengthen its position in European perimeter security. Heras Mobile Fencing & Security.
- ZND. (2025, August). ZND Temporary Fence Sponsor of Mubadala DC Open. ZND.
- USA Environmental Protection Agency. (2026, May). EPA Announces $2.9 Billion for States to Reduce Lead in Drinking Water and Protect Americans' Health. USA Environmental Protection Agency.
- Department for Transport. (2026, April). Highways maintenance block: formula allocations 2025 to 2026. UK Government.
- Department for Transport. (2025, March). Strategic road network: interim settlement 2025 to 2026. UK Government.
- Office of Rail and Road. (2026, January). Enhancements delivery. Office of Rail and Road.
- USA Department of Labor, Occupational Safety and Health Administration. (2026, April). US Department of Labor cites construction contractor with 7 willful, 33 repeat violations after fatal Yarmouth cave-in. Occupational Safety and Health Administration.
- USA Department of Labor. (2026, January). US Department of Labor investigation finds Birmingham construction company willfully exposed workers to trench collapse at Bessemer worksite. USA Department of Labor.
- Federal Highway Administration. (2025, May). Budget Estimates Fiscal Year 2026. USA Department of Transportation.
- USA Department of Labor, Occupational Safety and Health Administration. (2026, April). US Department of Labor investigation finds Alabama construction company exposed workers to trenching hazards following fatal incident. Occupational Safety and Health Administration.
- USA International Trade Administration. (2026, March). Final Affirmative Determinations in the Antidumping and Countervailing Duty Investigations of Temporary Steel Fencing from the People’s Republic of China. USA Department of Commerce.
- Press Information Bureau. (2026, February). HIGHLIGHTS OF UNION BUDGET 2026-27. Government of India.
- Office for National Statistics. (2025, August). GDP first quarterly estimate, UK: April to June 2025. Office for National Statistics.
- USA Environmental Protection Agency. (2025, November). 2025 Update to the 7th Drinking Water Infrastructure Needs Survey and Assessment (DWINSA). USA Environmental Protection Agency.
- National Bureau of Statistics of China. (2026, January). Investment in Fixed Assets in 2025. National Bureau of Statistics of China.
- Ministry of Jal Shakti, Press Information Bureau. (2025, February). Jal Jeevan Mission: Ensuring Tap Water for 15 Crore Rural Families. Government of India.
- Federal Statistical Office (Destatis). (2026, March). Production in January 2026: -0.5% on the previous month. Federal Statistical Office.
- Health and Safety Executive. (2026, June). HSE urges construction companies to strengthen site security. Health and Safety Executive.
- Office for National Statistics. (2025, June). GDP monthly estimate, UK: April 2025. Office for National Statistics.
- Statistics Canada. (2026, April). Investment in building construction, February 2026. Statistics Canada.
- ZND. (2025, June). Temporary Fencing for High Winds: ZND Solutions. ZND.
- Altrad. (2025, February). Altrad Generation Announces Acquisition of UK Assets and Branch Operations of Heras Mobile Fencing & Security. Altrad.
- USA Bureau of Labor Statistics. (2026, February). NATIONAL CENSUS OF FATAL OCCUPATIONAL INJURIES IN 2024. USA Bureau of Labor Statistics.
- Statistics Canada. (2026, June). Investment in building construction, April 2026. Statistics Canada.
This bibliography is provided for reader reference and uses primary government, standards-body, official trade body, and company sources.
This Report Answers
- What is the excavation safety fencing market value in 2026 and 2036?
- What CAGR is the excavation safety fencing market projected to record from 2026 to 2036?
- Which segments shape demand across fence type, height, application, end use, and sales model?
- Which excavation hazards and project pressures are expected to support purchase or rental activity?
- How are country CAGRs projected to differ across the profiled markets?
- Which companies compete across product fit, rental deployment, specification support, and service reach?
- What should contractors and rental managers address before broader account expansion or sourcing commitment?
- How are claims review and safety documentation expected to affect vendor selection for excavation work?
Frequently Asked Questions
What is driving growth in the Excavation Safety Fencing Market?
Demand is projected to rise on excavation enforcement and recurring utility work. Rental response and visible access control are expected to support purchases.
Who are the key players in the Excavation Safety Fencing Market?
Key players include Heras Mobile and ZND alongside Sunbelt Rentals and National Trench Safety. Competition is projected to center on availability and field support.
What is a significant restraint in the Excavation Safety Fencing Market?
Trade-remedy costs and uneven local stock are significant restraints. Adoption is anticipated to slow when replacement panels cannot match approved site layouts.
Why should executives track the Excavation Safety Fencing Market?
Executives should track the market because excavation work combines safety exposure with recurring infrastructure maintenance. Fencing selection affects response speed and public access control across active sites.
What business problem does the Excavation Safety Fencing Market address?
The market addresses the need to separate open excavations from workers and public routes. Portable systems help contractors adjust site boundaries when work fronts move.
What should contractors and rental managers evaluate before selecting suppliers?
Contractors and rental managers should evaluate panel stability and gate access before selecting suppliers. Replacement stock and local delivery response should also support repeated site use.
What limits return on investment for purchasers?
Return on investment is expected to weaken when damaged panels remain unavailable or incompatible with existing feet. Uneven fleet standardization also raises handling and replacement costs.
How do suppliers build long-term account confidence?
Suppliers build account confidence by keeping compatible panels and gates available across recurring projects. Clear setup guidance and dependable field response support repeat purchasing decisions.
Preview the report firsthand - request a free sample
Get SampleGet the brochure for pricing and purchase details.
Get PDFTable of Content
- Key Takeaways
- Market Size and CAGR
- Top Growth Driver
- Fastest Growing Segment
- Leading Region
- Key Companies
- Emerging Opportunities
- Executive Summary
- Global Market Outlook
- Demand-side Trends
- Supply-side Trends
- Technology Roadmap Analysis
- Analysis and Recommendations
- Analyst Perspective (What is happening? Why now? What should investors know?)
- Key Questions Answered
- How large is the market?
- What is the CAGR?
- What are key trends?
- Which region dominates?
- Who are the leaders?
- Market Overview
- Market Coverage / Taxonomy
- Market Definition / Scope / Limitations
- Research Methodology
- Chapter Orientation
- Analytical Lens and Working Hypotheses
- Market Structure, Signals, and Trend Drivers
- Benchmarking and Cross-market Comparability
- Market Sizing, Forecasting, and Opportunity Mapping
- Research Design and Evidence Framework
- Desk Research Programme (Secondary Evidence)
- Expert Input and Fieldwork (Primary Evidence)
- Tooling, Models, and Reference Databases
- Data Engineering and Model Build
- Quality Assurance and Audit Trail
- Market Background
- Market Dynamics (Drivers, Restraints, Opportunity, Trends)
- Scenario Forecast (Optimistic, Likely, Conservative)
- Impact Analysis
- AI Impact
- Sustainability Impact
- Regulatory Impact
- Technology Impact
- Consumer / Buyer Analysis
- Purchase Drivers
- Adoption Barriers
- Buyer Journey
- Opportunity Map Analysis
- Product Life Cycle Analysis
- Supply Chain Analysis
- Investment Feasibility Matrix
- Value Chain Analysis
- PESTLE and Porter's Analysis
- Regulatory Landscape
- Regional Parent Market Outlook
- Production and Consumption Statistics
- Import and Export Statistics
- Global Market Analysis and Forecast, 2021 to 2036
- Historical Market Size Value (USD Million) & Volume (Units) Analysis, 2021 to 2025
- Current and Future Market Size Value (USD Million) & Volume (Units) Projections, 2026 to 2036
- Y-o-Y Growth Trend Analysis
- Absolute $ Opportunity Analysis
- Global Market Pricing Analysis, 2021 to 2036
- Global Market Analysis and Forecast, By Fence Type, 2021 to 2036
- Introduction / Key Findings
- Historical Market Size Value (USD Million) & Volume (Units) Analysis By Fence Type, 2021 to 2025
- Current and Future Market Size Value (USD Million) & Volume (Units) Analysis and Forecast By Fence Type, 2026 to 2036
- Temporary Mesh Fencing
- Steel Panel Fencing
- Plastic Barrier Fencing
- Water-filled Barriers
- Guardrail - Edge Protection Systems
- Temporary Mesh Fencing
- Y-o-Y Growth Trend Analysis By Fence Type, 2021 to 2025
- Absolute $ Opportunity Analysis By Fence Type, 2026 to 2036
- Global Market Analysis and Forecast, By Height, 2021 to 2036
- Introduction / Key Findings
- Historical Market Size Value (USD Million) & Volume (Units) Analysis By Height, 2021 to 2025
- Current and Future Market Size Value (USD Million) & Volume (Units) Analysis and Forecast By Height, 2026 to 2036
- 1.2–1.8 m
- <1.2 m
- >1.8 m
- 1.2–1.8 m
- Y-o-Y Growth Trend Analysis By Height, 2021 to 2025
- Absolute $ Opportunity Analysis By Height, 2026 to 2036
- Global Market Analysis and Forecast, By Application, 2021 to 2036
- Introduction / Key Findings
- Historical Market Size Value (USD Million) & Volume (Units) Analysis By Application, 2021 to 2025
- Current and Future Market Size Value (USD Million) & Volume (Units) Analysis and Forecast By Application, 2026 to 2036
- Open Trench Protection
- Roadwork Zones
- Utility Repair Sites
- Building Excavations
- Public Access Control
- Open Trench Protection
- Y-o-Y Growth Trend Analysis By Application, 2021 to 2025
- Absolute $ Opportunity Analysis By Application, 2026 to 2036
- Global Market Analysis and Forecast, By End Use, 2021 to 2036
- Introduction / Key Findings
- Historical Market Size Value (USD Million) & Volume (Units) Analysis By End Use, 2021 to 2025
- Current and Future Market Size Value (USD Million) & Volume (Units) Analysis and Forecast By End Use, 2026 to 2036
- Construction Contractors
- Utilities
- Municipal - Road Agencies
- Industrial Sites
- Construction Contractors
- Y-o-Y Growth Trend Analysis By End Use, 2021 to 2025
- Absolute $ Opportunity Analysis By End Use, 2026 to 2036
- Global Market Analysis and Forecast, By Sales Model, 2021 to 2036
- Introduction / Key Findings
- Historical Market Size Value (USD Million) & Volume (Units) Analysis By Sales Model, 2021 to 2025
- Current and Future Market Size Value (USD Million) & Volume (Units) Analysis and Forecast By Sales Model, 2026 to 2036
- Rental
- Direct Purchase
- Distributor - Contractor Supply
- Rental
- Y-o-Y Growth Trend Analysis By Sales Model, 2021 to 2025
- Absolute $ Opportunity Analysis By Sales Model, 2026 to 2036
- Global Market Analysis and Forecast, By Region, 2021 to 2036
- Introduction
- Historical Market Size Value (USD Million) & Volume (Units) Analysis By Region, 2021 to 2025
- Current Market Size Value (USD Million) & Volume (Units) Analysis and Forecast By Region, 2026 to 2036
- North America
- Latin America
- Europe
- East Asia
- South Asia
- Oceania
- Middle East and Africa
- Market Attractiveness Analysis By Region
- North America Market Analysis and Forecast, By Country, 2021 to 2036
- Historical Market Size Value (USD Million) & Volume (Units) Trend Analysis By Market Taxonomy, 2021 to 2025
- Market Size Value (USD Million) & Volume (Units) Forecast By Market Taxonomy, 2026 to 2036
- By Country
- United States
- Canada
- By Fence Type
- By Height
- By Application
- By End Use
- By Sales Model
- By Country
- Market Attractiveness Analysis
- By Country
- By Fence Type
- By Height
- By Application
- By End Use
- By Sales Model
- Key Takeaways
- Latin America Market Analysis and Forecast, By Country
- Historical Market Size Value (USD Million) & Volume (Units) Trend Analysis By Market Taxonomy, 2021 to 2025
- Market Size Value (USD Million) & Volume (Units) Forecast By Market Taxonomy, 2026 to 2036
- By Country
- Brazil
- Mexico
- Argentina
- By Fence Type
- By Height
- By Application
- By End Use
- By Sales Model
- By Country
- Market Attractiveness Analysis
- By Country
- By Fence Type
- By Height
- By Application
- By End Use
- By Sales Model
- Key Takeaways
- Europe Market Analysis and Forecast, By Country
- Historical Market Size Value (USD Million) & Volume (Units) Trend Analysis By Market Taxonomy, 2021 to 2025
- Market Size Value (USD Million) & Volume (Units) Forecast By Market Taxonomy, 2026 to 2036
- By Country
- Germany
- United Kingdom
- France
- Italy
- Spain
- By Fence Type
- By Height
- By Application
- By End Use
- By Sales Model
- By Country
- Market Attractiveness Analysis
- By Country
- By Fence Type
- By Height
- By Application
- By End Use
- By Sales Model
- Key Takeaways
- East Asia Market Analysis and Forecast, By Country
- Historical Market Size Value (USD Million) & Volume (Units) Trend Analysis By Market Taxonomy, 2021 to 2025
- Market Size Value (USD Million) & Volume (Units) Forecast By Market Taxonomy, 2026 to 2036
- By Country
- China
- Japan
- South Korea
- By Fence Type
- By Height
- By Application
- By End Use
- By Sales Model
- By Country
- Market Attractiveness Analysis
- By Country
- By Fence Type
- By Height
- By Application
- By End Use
- By Sales Model
- Key Takeaways
- South Asia Market Analysis and Forecast, By Country
- Historical Market Size Value (USD Million) & Volume (Units) Trend Analysis By Market Taxonomy, 2021 to 2025
- Market Size Value (USD Million) & Volume (Units) Forecast By Market Taxonomy, 2026 to 2036
- By Country
- India
- Thailand
- Indonesia
- By Fence Type
- By Height
- By Application
- By End Use
- By Sales Model
- By Country
- Market Attractiveness Analysis
- By Country
- By Fence Type
- By Height
- By Application
- By End Use
- By Sales Model
- Key Takeaways
- Oceania Market Analysis and Forecast, By Country
- Historical Market Size Value (USD Million) & Volume (Units) Trend Analysis By Market Taxonomy, 2021 to 2025
- Market Size Value (USD Million) & Volume (Units) Forecast By Market Taxonomy, 2026 to 2036
- By Country
- Australia
- New Zealand
- By Fence Type
- By Height
- By Application
- By End Use
- By Sales Model
- By Country
- Market Attractiveness Analysis
- By Country
- By Fence Type
- By Height
- By Application
- By End Use
- By Sales Model
- Key Takeaways
- Middle East and Africa Market Analysis and Forecast, By Country
- Historical Market Size Value (USD Million) & Volume (Units) Trend Analysis By Market Taxonomy, 2021 to 2025
- Market Size Value (USD Million) & Volume (Units) Forecast By Market Taxonomy, 2026 to 2036
- By Country
- GCC Countries
- South Africa
- Türkiye
- By Fence Type
- By Height
- By Application
- By End Use
- By Sales Model
- By Country
- Market Attractiveness Analysis
- By Country
- By Fence Type
- By Height
- By Application
- By End Use
- By Sales Model
- Key Takeaways
- Key Countries Market Analysis
- United States
- Pricing Analysis
- Market Share Analysis, 2025
- By Fence Type
- By Height
- By Application
- By End Use
- By Sales Model
- China
- Pricing Analysis
- Market Share Analysis, 2025
- By Fence Type
- By Height
- By Application
- By End Use
- By Sales Model
- India
- Pricing Analysis
- Market Share Analysis, 2025
- By Fence Type
- By Height
- By Application
- By End Use
- By Sales Model
- Germany
- Pricing Analysis
- Market Share Analysis, 2025
- By Fence Type
- By Height
- By Application
- By End Use
- By Sales Model
- United Kingdom
- Pricing Analysis
- Market Share Analysis, 2025
- By Fence Type
- By Height
- By Application
- By End Use
- By Sales Model
- Japan
- Pricing Analysis
- Market Share Analysis, 2025
- By Fence Type
- By Height
- By Application
- By End Use
- By Sales Model
- Canada
- Pricing Analysis
- Market Share Analysis, 2025
- By Fence Type
- By Height
- By Application
- By End Use
- By Sales Model
- United States
- Market Structure Analysis
- Competition Dashboard
- Competition Benchmarking
- Market Share Analysis of Top Players
- By Regional
- By Fence Type
- By Height
- By Application
- By End Use
- By Sales Model
- Emerging Startups
- Innovation Benchmarking
- Competition Analysis
- Competition Deep Dive
- Heras Mobile
- Overview
- Product Portfolio
- Profitability by Market Segments (Product/Region/Sales Channel)
- Sales Footprint
- Strategy Overview
- Marketing Strategy
- Product Strategy
- Channel Strategy
- ZND
- Oxford Plastics
- SONCO
- National Construction Rentals
- United Rentals
- Sunbelt Rentals
- National Trench Safety
- Altrad Generation
- Trench Shoring Company
- Heras Mobile
- Case Studies
- Success Stories
- Recent Developments
- Competition Deep Dive
- Assumptions & Acronyms Used


