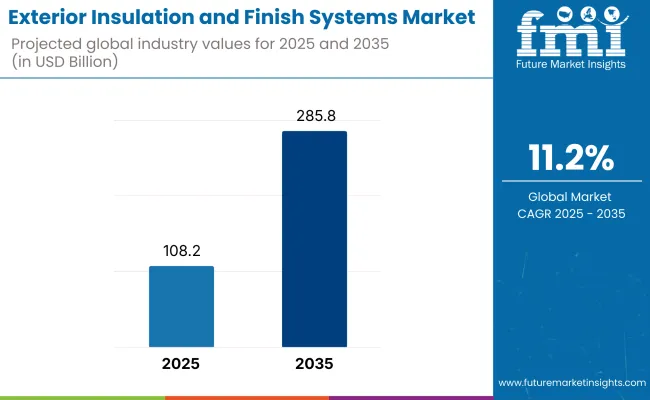
Global Exterior Insulation Finish Systems (EIFS) landscape gathered any momentum lately due to rising demand from energy conserving buildings among applicable application. According to Future Market Insights (FMI), the industry is projected to be about USD 108.2 billion in 2025 and may expand further to USD 285.8 billion by 2035 at a 10.2% CAGR through 2035.

In 2024, the Exterior Insulation and Finish Systems (EIFS) segment saw considerable growth due to increasing demand for energy-efficient building solutions and tighter environmental regulations. The sector grew considerably in North America and Europe, where governments encouraged greener construction through tighter building energy codes and subsidies for retrofitting existing buildings with EIFS.
Emerging trends in insulation materials such as expanded polystyrene (EPS) and mineral wool that enhance energy efficiency and sustainability. Regionally, North America and Europe are the early adopters because of stringent energy regulations, while emerging segments in Asia-Pacific and the Middle East offer promising growth opportunities.
With construction activity on the rise globally, EIFS is set to become a key player in improving building performance, lowering energy use, and supporting sustainable urban development.
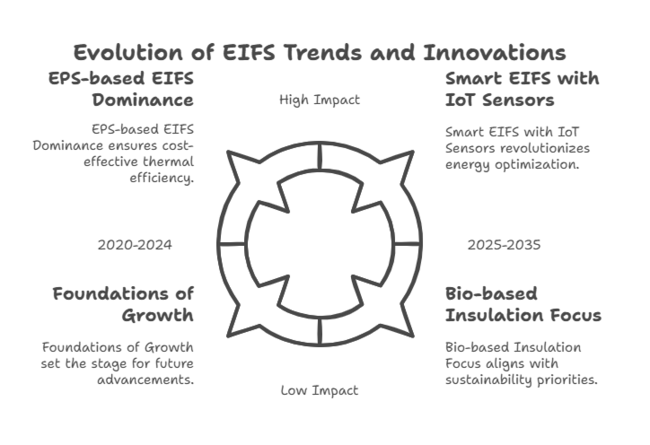
| 2020 to 2024: Foundations of Growth & Technological Advancements | 2025 to 2035: Smart EIFS, Sustainable Innovation & emerging sectors |
|---|---|
| Significant demand driven by energy efficiency regulations and green construction practices. | Expected surge in smart EIFS with IoT sensors for real-time monitoring and data-driven energy optimization. |
| Retrofitting older buildings to comply with energy codes. | Focus on bio-based insulation and solar-integrated EIFS as sustainability becomes a priority. |
| EPS-based EIFS dominated due to cost-effectiveness and thermal efficiency. | The increased adoption of mineral wool-based EIFS due to its superior fire resistance and energy efficiency. |
| Enhanced fire resistance and moisture control through advanced material innovations. | Asia-Pacific and Middle East sectors expected to drive growth as urbanization accelerates. |
| Adoption of automation in installation processes to reduce time and labor costs. | Rise of net-zero energy buildings, where EIFS plays a key role in achieving sustainability goals. |
| Strong industry growth in North America and Europe due to stricter regulations. | Major demand in emerging industries like India, China, and the Middle East for large-scale projects. |

Key Priorities of Stakeholders
Regional Variance:
Adoption of Advanced EIFS Technologies
High Variance:
Convergent & Divergent Perspectives on ROI:
Material & Design Preferences
Consensus:
Regional Variance:
Cost Sensitivity & Pricing Trends
Shared Challenges:
Regional Differences:
Industry-Specific Challenges
Manufacturers:
End-Users:
Future Investment Priorities
Alignment:
Divergence:
Regulatory & Policy Impact
Conclusion: Variance vs. Consensus
Strategic Insight:
A one-size-fits-all approach is not feasible. Companies must tailor strategies to regional needs:
| Countries | Government Regulations Impacting EIFS |
|---|---|
| United States |
|
| United Kingdom |
|
| European Union |
|
| Germany |
|
| Australia |
|
| Canada |
|
| Japan |
|
| South Korea |
|
Leading players in the Exterior Insulation and Finish Systems (EIFS) landscape are utilizing a variety of price strategies, innovations, and strategic alliances. Additionally, they are expanding geographically to strengthen their presence and drive growth.
Price is a vital aspect that is being pursued by most of the companies at competitive levels to deliver high-grade EIFS services at competitive pricing while maintaining quality and performance criteria, including energy efficiency and lifespan. To increase their industry share, EIFS firms are entering into strategic alliances with building companies, architectural design companies, and energy efficiency regulators.
These alliances enable firms to access new customer segments and drive product adoption in residential, commercial, and industrial segments. Additionally, geographical expansion to emerging sectors in Asia-Pacific and Africa, where urbanization is growing at a rapid pace, has enabled firms to leverage high-growth prospects.

| Company Name | Market Share (%) & Key Strengths |
|---|---|
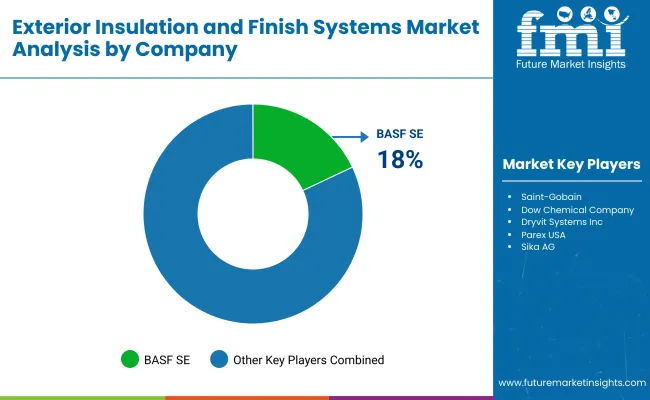
| BASF SE | 18%, BASF SE holds the largest share at 18%, making it a dominant player in the EIFS industry. |
| Saint-Gobain | 15%, Saint-Gobain, with a 15% share, is another major player. Known for its expertise in building materials. |
| Dow Chemical Company | 12%, Dow Chemical Company holds 12% of the EIFS space, recognized for its innovation in chemical solutions for construction. |
| Dryvit Systems Inc. | 10%, With a 10% share, Dryvit Systems Inc., a part of the BASF group, is a key manufacturer of EIFS. Known for its comprehensive EIFS solutions. |
| Parex USA | 9%, Parex USA holds 9% of the industry and is known for offering advanced EIFS products for energy-efficient building designs. |
| Sika AG | 8%, Sika AG holds an 8% market share, driven by its expertise in providing innovative construction solutions. |
| Sto SE & Co. KGaA | 7%, Sto SE & Co. KGaA holds a 7% share in the EIFS sector. The company is known for offering superior thermal insulation and aesthetic finishes. |
| Owens Corning | 6%, Owens Corning, with a 6% share, is a key player in the EIFS industry. Known for its fiberglass insulation. |
| Durabond Products Limited | 5%, Durabond Products Limited holds 5% of the EIFS landscape. The company offers a variety of high-performance exterior insulation systems, focusing on thermal insulation and moisture resistance. |
| Others | 10%, The remaining 10% of the market share is held by various other companies providing specialized EIFS solutions. |
Key Developments
Here are key developments and news in the Exterior Insulation and Finish Systems (EIFS) industry from 2024 onwards:
The global EIFS landscape is driven by various macroeconomic variables such as economic growth, urbanization, building industry trends, and environmental policy. With accelerated urbanization and an increasing population worldwide, especially in emerging nations, demand for residential and commercial buildings is accelerating.
Such growth is fueling the demand for energy-efficient insulation solutions such as EIFS. In developed economies, governments are implementing more stringent building codes and environmental policies, compelling sustainable construction, and further accelerating EIFS adoption.
Furthermore, the industry is gaining from the trend towards green building certifications (e.g., LEED), which promote the use of materials with energy-saving qualities and better insulation. Supply chain disruptions, material prices, and economic downturns can threaten the expansion of the EIFS landscape.
Demand might face temporary turbulence in sectors with unstable construction activity levels, such as during periods of post-pandemic recovery. Long-term growth remains robust, fueled by ongoing interest in sustainability and energy efficiency.
There are two type of EIFS Products Polymer Based EIFS and Polymer Modified EIFS. Polymer Based EIFS is synthetic, specifically made of acrylic or silicone which guarantees high flexibility and friction resistance. It is also ideal for buildings situated in regions prone to extreme weather conditions and high humidity, where enhanced thermal insulation and moisture proofing are a must.
Polymer Modified EIFS systems, which include other materials as part of their makeup as in these provide a stronger, more durable solution for commercial or industrial structures which need extra protection from impact, wear and extreme environmental conditions.
Insulation material plays a critical role in the performance and effectiveness of EIFS. The most commonly utilized of the insulation materials is EPS is cheap, lightweight, and an excellent thermal insulator, making it widely used in both residential and non-residential sectors.
It is used extensively in both residential and non-residential sector. Mineral wool, in contrast, is more fire-resistant and offers superior sound insulation, making it ideal for buildings that need to meet fire protection or soundproofing regulations, such as residential high-rises, hotels, and schools.
The end-user segment is divided into residential and non-residential buildings. There are mainly two types of applications of EIFS in the residential sector, which are largely used for the purpose of energy efficiency, curb appeal, and reduction in heating and cooling costs. It's used on new houses, renovation projects and environmentally friendly building projects.
Other non-residential buildings, including commercial, industrial and institutional structures, also commonly use EIFS. Such applications typically emphasize not just energy efficiency but durability, weather resistance and adherence to strict building codes.
Leading Companies in the EIFS landscape with governments around the world tightening energy efficiency standards and environmental regulations. EIFS is also showing great promise, due to its ability to improve insulation, limit energy bills, and afford architectural flexibility. A global push to pursue energy-efficient systems in new constructions and building retrofits has had a positive impact on the industry.
The EIFS landscape offers growth opportunities for companies to expand their footprint in emerging sectors by partnering with local organizations and customizing their products to fulfill the regional requirements. Additionally, ongoing R&D investment for innovative high-performance EIFS is imperative, including fire-resistant and eco-friendly materials.
They should also work with architects and construction companies to recommend EIFS to homeowners and business owners, while stressing that the maintenance will save them money and energy in the long run.

The USA is a major sector for Exterior Insulation and Finish Systems (EIFS) as the demand for energy-efficient building solutions and sustainable construction practices continues to grow. EIFS products are especially in demand in the residential and commercial sectors, where increasingly stringent energy codes are driving builders to specify high-performance insulation systems.
Also, the adoption of green building standards like LEED and Energy Star is expected to increase the demand for EIFS products as they help save energy and promote environmental sustainability. Companies such as BASF SE, Owens Corning, and Dryvit Systems Inc. control the sector. As the USA government sets its sights on energy-efficient solutions and carbon-neutral buildings, the EIFS industry is projected to experience significant growth through 2035.
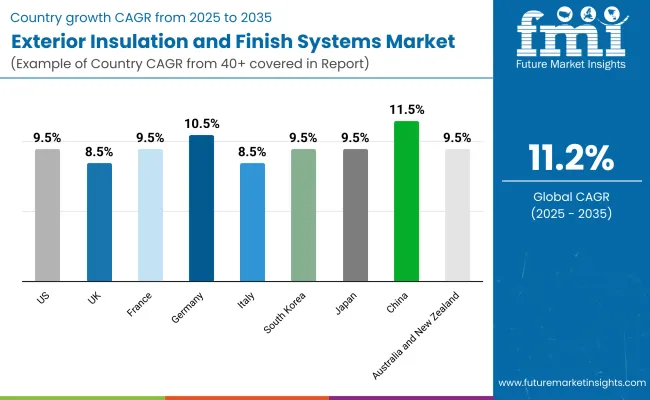
FMI opines that the United States exterior insulation and finish systems sales will grow at nearly 9.5% CAGR through 2025 to 2035.
In the UK, there is a surge in the demand for Exterior Insulation and Finish Systems (EIFS) due to strict regulations being introduced to enhance energy effectiveness and decrease carbon dioxide emissions in buildings. The EIFS products are best suited for performing design-level estate works with an emphasis on thermal performance for existing buildings, particularly in the residential sector.
The Green Homes Grant scheme, launched to retrofit homes to improve energy efficiency, has also stimulated the use of EIFS in refurbishment schemes. In the UK EIFS landscape, Saint-Gobain and Sika AG are major players and they are focusing on providing high-performance insulation materials having government sustainability goals.
FMI opines that the United Kingdom exterior insulation and finish systems sales will grow at nearly 8.5% CAGR through 2025 to 2035.
The growth of the EIFS landscape in France is driven by the focus on sustainable construction practices and energy efficiency in the country. In France, the framework of the Energy Transition Law requires strict energy performance requirements for buildings, leading to the development of the EIFS system in the residential and non-residential sectors.
The use of these products can improve thermal insulation in outer walls of buildings, energy saving, and decreasing the amount of greenhouse gas emissions. Property renovation, and older buildings are in particular, is one important growth area for EIFS as French authorities source to improve energy-efficiency of the French property stock.
FMI opines that the France exterior insulation and finish systems sales will grow at nearly 9.5% CAGR through 2025 to 2035.
The exterior insulation and finish system (EIFS) sector is doing well due to the country's goal of being carbon-neutral. One of the most impressive features of the EIFS system is its thermal insulation ability to achieve Passivhaus and other energy performance targets, which have made EIFS systems very popular.
Major players such as Saint-Gobain and Sika AG are catering to these regulations by providing cutting-edge insulation and cladding solutions for the German building compliance landscape. This has resulted in a greater emphasis on sustainable construction materials, such as EIFS, with certifications for green building like DGNB (German Sustainable Building Council).
FMI opines that the Germany exterior insulation and finish systems sales will grow at nearly 10.5% CAGR through 2025 to 2035.
Italy’s EIFS sector is evolving but not as fast as in some other countries in Europe. With a large number of buildings in the country being older, with the architectural heritage being a big feature of the country, there is significant potential for EIFS in building renovations. The growing adoption of energy-efficient methods to comply with EU energy directives has witnessed a growing demand for EIFS systems in Italy.
This is why EIFS is a solution that has become popular to building owners seeking to renovate their thermal performance. Key international players like BASF SE and Saint-Gobain are increasing their footprint in Italy, with a strong emphasis on sustainable, energy-efficient products.
FMI opines that the Itlay exterior insulation and finish systems sales will grow at nearly 8.5% CAGR through 2025 to 2035.
And EIFS growth is accelerating in South Korea, driven by government policies to promote construction in green buildings and energy-efficient structures. Government policies, such as the Green Building Certification System (G-SEED) and initiatives to establish Zero Energy Building (ZEB) certification, have fostered the use of EIFS systems in residential and commercial construction.
As South Korea’s urban population grows and demand for high-rise buildings increases, the need for high-performance insulation solutions, such as EIFS, has grown. Domestically, companies such as Fowler and international giants like BASF SE, Owens Corning and Sika AG are benefiting from the increase in demand for energy-efficient solutions.
FMI opines that the South Korea exterior insulation and finish systems sales will grow at nearly 9.5% CAGR through 2025 to 2035.
Japan’s EIFS landscape is developing in response to natural disaster resilience and energy efficiency requirements. Because the country is susceptible to extreme weather events like earthquakes, typhoons, and heavy rainfall, the emphasis has been on the durability of buildings, and thermal efficiency.
The better insulation and weather-resistance functionality presented by EIFS products are key reasons behind the increasing penetration of the same in residential as well as commercial industry. Growth in the non-residential sector is being driven by the Japan construction market's generally aging infrastructure and the need for building renovations.
FMI opines that the Japan exterior insulation and finish systems sales will grow at nearly 9.5% CAGR through 2025 to 2035.
China's EIFS landscape is experiencing significant growth, which can be attributed to the mass urbanization, the growing requirement for energy-efficient structures, and a rising focus on sustainability in the country. Policies encouraging green building have be established and have generated demand, including the green building action plan and energy-efficient building codes published by Chinese government.
China’s massive residential and commercial construction industries, along with the growing demand for retrofitting existing buildings, are driving the growth of the EIFS industry. FMI opines that the China exterior insulation and finish systems sales will grow at nearly 11.5% CAGR through 2025 to 2035.
The International Thermal Insulation Association (ITTA) believes that EIFS segment growth in Australia, New Zealand, is particularly strong because of a growing emphasis on energy efficiency pollution and pollution reduction during construction.
Both countries have established building codes and green building standards that promote the adoption of materials and technologies that decrease energy usage, enhance thermal performance, and advance sustainability. Cities in Australia, such as Sydney, Melbourne and Brisbane, are focused on providing energy-efficient buildings through the government’s National Construction Code (NCC) and other state-based initiatives.
This is pushing for the adoption of EIFS as a viable solution for providing thermal insulation and minimizing total energy use in the same way it has done with regards to mechanical energy consumption. FMI opines that the Australia and New Zealand exterior insulation and finish systems sales will grow at nearly 9.5% CAGR through 2025 to 2035.
EIFS offers superior thermal insulation, enhances energy efficiency, increases building appearance, and provides moisture resistance, making it a widely used option for residential and commercial building.
EIFS systems are made to last. With regular maintenance, they can last 30 years or more, retaining their insulation and finish characteristics.
EIFS systems typically incorporate materials like expanded polystyrene (EPS) for insulation and acrylic-based finishes for the outer surface. These are utilized to deliver better thermal performance and weather resistance.
Yes, EIFS can be installed as a retrofit to existing buildings to enhance insulation and appearance. It is widely applied in residential and commercial building rehabilitation.
Though EIFS systems are typically high in fire resistance, their performance against fire hinges on the content. Systems incorporated with mineral wool insulation are superior to those which utilize expanded polystyrene.


Full Research Suite comprises of:
Market outlook & trends analysis
Interviews & case studies
Strategic recommendations
Vendor profiles & capabilities analysis
5-year forecasts
8 regions and 60+ country-level data splits
Market segment data splits
12 months of continuous data updates
DELIVERED AS:
PDF EXCEL ONLINE
Exterior Polyurethane Varnish Market Size and Share Forecast Outlook 2025 to 2035
Exterior Paint Retail Market Size and Share Forecast Outlook 2025 to 2035
Aircraft Exterior Lighting Market Growth - Trends & Forecast 2025 to 2035
Automotive Exterior Trim Parts Market Growth - Trends & Forecast 2025 to 2035
Automotive Decorative Exterior Trim Market Size and Share Forecast Outlook 2025 to 2035
Insulation Tester Market Size and Share Forecast Outlook 2025 to 2035
Insulation Films Market Size and Share Forecast Outlook 2025 to 2035
Insulation Paper Market Size and Share Forecast Outlook 2025 to 2035
Insulation Market Size and Share Forecast Outlook 2025 to 2035
Insulation Coatings Market Size and Share Forecast Outlook 2025 to 2035
Insulation Boards Market Size and Share Forecast Outlook 2025 to 2035
Insulation Testing Instrument Market Size and Share Forecast Outlook 2025 to 2035
OEM Insulation Market Size and Share Forecast Outlook 2025 to 2035
Pipe Insulation Films Market Size and Share Forecast Outlook 2025 to 2035
Thin Insulation Market Size and Share Forecast Outlook 2025 to 2035
Pipe Insulation Market Size and Share Forecast Outlook 2025 to 2035
Cold Insulation Materials Market Size and Share Forecast Outlook 2025 to 2035
Cork Insulation Market Size and Share Forecast Outlook 2025 to 2035
Pipe Insulation Products Market Size and Share Forecast Outlook 2025 to 2035
Wool Insulation Market Size and Share Forecast Outlook 2025 to 2035

Thank you!
You will receive an email from our Business Development Manager. Please be sure to check your SPAM/JUNK folder too.
Chat With
MaRIA