
- Market Size (2026)
- USD 385.8 Mn
- Forecast (2036)
- USD 622.5 Mn
- CAGR (2026 to 2036)
- 4.9%
Facial Ice Rollers Market Summary
USD 385.8 million in 2026 and USD 622.5 million by 2036 at a 4.9% CAGR.
The global facial ice rollers market was valued at USD 367.8 million in 2025 and is estimated to reach USD 385.8 million in 2026. Growing at 4.9% CAGR between 2026-2036, the market is anticipated to reach USD 622.5 million by 2036. As per FMI research, everyday essentials are likely to account for leading share, worth 39.0% of total revenue in 2026. E-commerce reached 17.1% of US retail sales in the second quarter of 2026 [1], and internet sales were 27.5% of UK retail sales in 2025 [2]. Specialty beauty retail adds reach: Therabody added more than 650 Ulta Beauty stores in March 2026, taking distribution to more than 1,000 doors [3]. Beauty demand abroad is also rising, as overseas online purchases of Korean cosmetics grew 20.4% in 2025.[4].
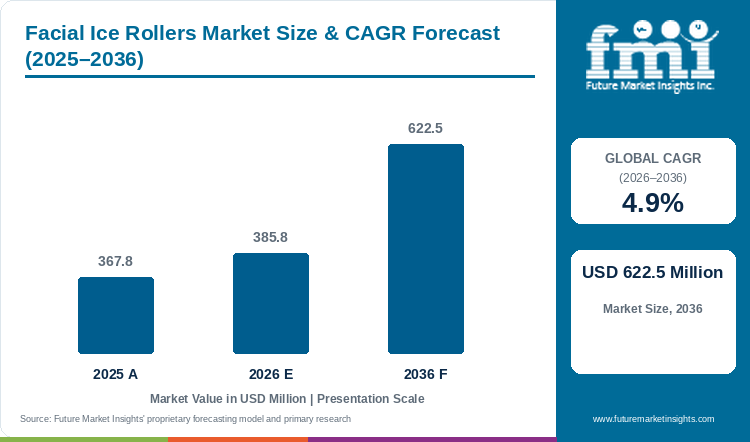
Table 1: Market Size and Forecast for the Facial Ice Rollers Market (USD Million), 2025 to 2036
| Market size and forecast | Value |
|---|---|
| 2025 market size | USD 367.8 million |
| Estimated market size in 2026 | USD 385.8 million |
| Projected market size by 2036 | USD 622.5 million |
| CAGR (2026 to 2036) | 4.9% |
| Added revenue, 2026 to 2036 | USD 236.7 million |
Key Market Trends & Insights
- By product type: Everyday essentials are likely to hold leading share of the facial ice rollers market in 2026, representing 39.0% of total market revenue.
- By nature: Conventional products are likely to lead with a market share of 48.0% in 2026.
- By use occasion: Daily routine use is set to hold sway, with 45.0% of the market in 2026.
- By price tier: Mid-range products are expected to lead with a market share of 40.0% in 2026.
- By sales channel: E-commerce and DTC is projected to hold 43.0% of the market in 2026.
Regional Highlights
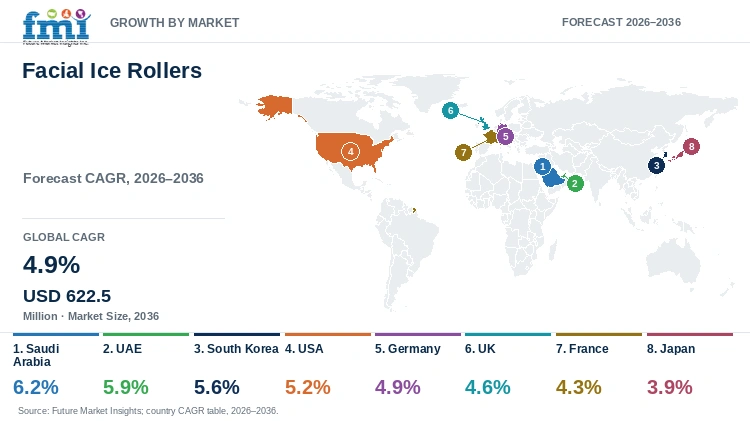
- Fastest-growing country: Saudi Arabia is expected to record the highest growth rate of all profiled markets, with a projected CAGR of 6.2% between 2026 and 2036.
- Growth across other countries: The UAE is projected to expand at a CAGR of 5.9%, followed by South Korea at 5.6%. The USA is set to grow at 5.2% CAGR, Germany at 4.9%, the UK at 4.6%, France at 4.3%, and Japan at 3.9%.
Online buying is routine in the larger markets. In the EU, 78% of internet users aged 16 to 74 bought online in 2025 [5], and in France the share of people aged 15 and over who bought online rose from 40% in 2013 to 63% in 2024 [6]. Japan sits lower on goods: B2C e-commerce reached JPY 26.1 trillion in 2024, up 5.1%, with a goods e-commerce ratio of 9.8% [7].
Price, and not awareness, separates the products. A Skin Gym CryoRoll costs USD 18.00 at Ulta [8], and the TheraFace Depuffing Wand that Therabody put on Ulta.com on 5 August 2025, with more than 300 Ulta Beauty stores planned, is listed at USD 169.99 [9]. One device sale carries the revenue of 9.4 roller sales. When Hyperice launched its X 2 Knee and X 2 Shoulder in August 2025, it set the US price at USD 449 for cold down to 4°C and five cooling and five heating levels [10].
Two outside forces cap how far the category can be pushed. The first is claim law: the US FDA says cosmetic labeling must be truthful and not misleading, and a product claiming to affect the structure or function of skin is legally a drug [11]. The second is supplier retreat. Church & Dwight announced in May 2025 that it would shut down or sell Flawless, Spinbrush and Waterpik showerhead, which carry about USD 150 million of combined net sales [12]. In the UK, the Office for Product Safety and Standards published research in March 2025 on consumer journeys in online marketplaces [13].
FMI sizes the neighbouring categories as well. The At-Home Therapeutic Beauty Devices Market is USD 5.5 billion in 2025 [14] and the Personal Care Appliances Market is USD 25.0 billion in 2025 [15]. Closer in function, the High-Frequency Facial Wands Market is USD 323.9 million in 2026 at a 4.9% CAGR [16] and the Facial Steamer Market is USD 2.1 billion in 2026 at a 5.5% CAGR [17]. At USD 385.8 million, facial ice rollers are about 1.2 times the wands market.
Table 2: Supporting Industry Indicators for the Facial Ice Rollers Market (mixed units), 2024 to 2026, mixed years
| Indicator | Metric | Why it matters | Source |
|---|---|---|---|
| US e-commerce share | 17.1% of retail sales in Q2 2026. | Compact, light tools ship well through online channels. | US Census Bureau, Quarterly Retail E-Commerce Sales, 18 August 2026 [1] |
| UK internet sales share | 27.5% of retail sales in 2025. | At this share, a roller is compared with competing listings and household substitutes in a few clicks. | UK Office for National Statistics, Internet sales ratio, 18 September 2026 [2] |
| EU online buyers | 78% of internet users aged 16 to 74 in 2025. | Sets the size of the online audience in Germany and France. | Eurostat, E-commerce statistics for individuals, accessed 9 October 2026 [5] |
| France online buyers | 63% of people aged 15 and over in 2024, up from 40% in 2013. | Direct-to-consumer brands sell into a buying habit that is no longer new. | INSEE, Achats de produits et de services en ligne, 14 October 2025 [6] |
| Japan B2C e-commerce | JPY 26.1 trillion in 2024, up 5.1%. Goods e-commerce ratio 9.8%. | A lower online ratio leaves more of the sale to stores that can demonstrate the product. | Japan METI, FY2024 E-Commerce Market Survey, 26 August 2025 [7] |
| South Korea cross-border beauty | Overseas online purchases of Korean products KRW 3.02 trillion in 2025, up 16.4%. Cosmetics up 20.4%. | Beauty products already move across borders through online channels. | Korea JoongAng Daily, Overseas online sales of Korean products, 16 February 2026 [4] |
| Saudi Arabia store evaluation | 100 e-commerce stores assessed against 10 criteria in the first phase. | Sellers are scored on returns, privacy and licence details before they scale. | Saudi Ministry of Commerce, E-Commerce Store Evaluation results, 18 August 2025 [18] |
| Manual roller price | USD 18.00 for the Skin Gym CryoRoll. | Reference price for fill-and-freeze rollers. | Ulta Beauty, Skin Gym CryoRoll Ice Roller, accessed 9 October 2026 [8] |
| Controlled-temperature device price | USD 169.99 for the TheraFace Depuffing Wand. | Reference price for controlled-temperature facial devices. | Therabody, Ulta Beauty announcement, 5 August 2025 [9] |
| Thermoelectric hot and cold range | Cold down to 4°C and heat up to 49°C, with five cooling and five heating levels. | Temperature control without ice, in a portable device. | Hyperice, X 2 Knee and X 2 Shoulder launch, 19 August 2025 [10] |
Country Comparison
Online retail share separates the profiled markets more than roller growth rates do. Official series place the UK at 27.5% of retail sales in 2025 [2], the United States at 17.1% in the second quarter of 2026 [1] and Japan at 9.8% for B2C goods in 2024 [7], so the UK ratio is 2.8 times Japan’s. South Korea shows the beauty side of the channel, with overseas online purchases of Korean cosmetics up 20.4% in 2025 [4]. The ratios use different bases and years, so they indicate channel maturity and not market size.
Analyst Perspective
"A buyer can already cool the face for nothing with ice and a cloth. Revenue in this category therefore depends on what a supplier adds that a freezer cannot: a fixed temperature, a cleaner tool, a shape that stays cold longer, or evidence behind a claim. Suppliers that cannot name that difference compete with the free substitute on price."
- Rahul Pandita, Principal Consultant, Future Market Insights
How is the Facial Ice Rollers Market segmented?
The market is segmented by product type, nature, use occasion, price tier, sales channel, and region.
By product type: everyday essentials, targeted therapy formats, premium and smart formats, and gift and travel sets.
By nature: conventional, natural and organic, vegan, and clinically positioned.
By use occasion: daily routine, recovery and post-workout, sleep and wind-down, and gifting.
By price tier: mid-range, mass, and premium.
By sales channel: e-commerce and DTC, specialty wellness retail, pharmacies, supermarkets, and spas and studios.
By region: North America, Latin America, Western Europe, Eastern Europe, East Asia, South Asia and Pacific, and Middle East and Africa.
Why do Everyday Essentials lead the Product Type category?
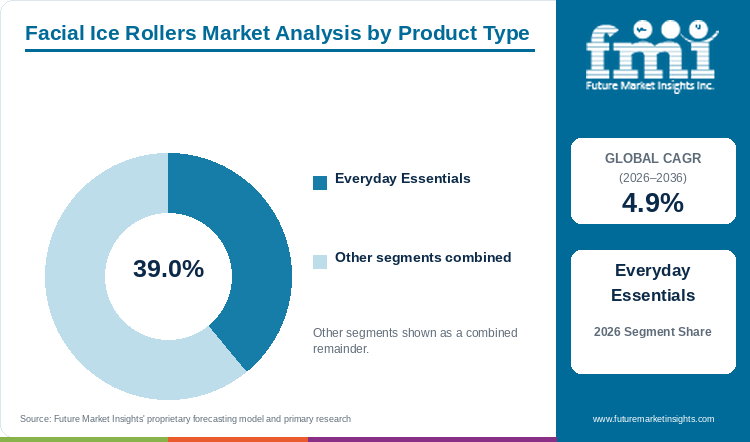
Everyday Essentials hold 39.0% of Product Type in 2026.
Everyday Essentials are expected to account for 39.0% of product type revenue in 2026. Demand is supported by the growing preference for affordable and reusable facial cooling tools that can be incorporated into regular skincare routines. These products are easy to use and do not require electronic components or additional accessories. For instance, the Skin Gym CryoRoll uses a water-filled silicone design that can be frozen before application. Its affordability makes it accessible to consumers who prefer basic skincare tools over premium electronic devices. The availability of different designs and materials will further support sales in this category.
- Skin Gym CryoRoll is available at USD 18.00 and requires only water and freezer storage before use.
- Premium alternatives such as the Therabody Depuffing Wand cost USD 169.99 and offer electronic temperature-control features.
Why does Conventional lead the Nature category?
Conventional holds 48.0% of Nature in 2026.
Conventional products are projected to hold 48.0% of revenue in the Nature category in 2026. Their leading position is supported by the availability of standard facial cooling rollers across different price ranges and retail channels. These products primarily offer a cooling function without requiring specialized formulations or additional product attributes. Manufacturers can therefore focus on improving material quality and product design while maintaining competitive prices. Natural and clinically positioned variants will continue to attract consumers with specific preferences. However, the wider availability and affordability of conventional products will support their market position during the forecast period.
- Conventional rollers are available in different materials and designs to meet consumer preferences for comfort and ease of use.
- The US FDA requires cosmetic claims to be truthful and not misleading. Claims involving changes to skin structure or function may bring products under drug regulations.
What are the drivers, restraints, and opportunities in the Facial Ice Rollers Market?
Online beauty sales will drive demand, while low-cost alternatives and cosmetic claim regulations will remain challenges. Temperature-controlled devices with expert backing will create new opportunities.
- Driver: Beauty buying has moved online in the larger markets, and a light, visual, daily-use tool ships and sells well there.
- Restraint: A free household substitute and strict claim wording limit what a buyer will pay for a manual roller.
- Opportunity: Fixed temperature, expert backing and in-store trial support a step up to powered devices.
Online Beauty Buying Supports Demand
Shoppers already buy beauty across borders online. Overseas online purchases of Korean cosmetics grew 20.4% in 2025 inside a KRW 3.02 trillion total for Korean products [4], and 63% of people in France aged 15 and over bought online in 2024 [6]. A roller is cheap to ship, simple to film and used daily, so it fits that behaviour. The market needs that reach to climb from USD 385.8 million in 2026 to USD 622.5 million by 2036.
A Free Substitute and Claim Rules Cap Price
A frozen CryoRoll costs USD 18.00 [8], while an ice cube or a chilled spoon costs nothing. A claim that justifies more meets the US FDA rule that a product claiming to affect the structure or function of skin is legally a drug [11]. On marketplaces, safety information is part of what shoppers weigh, as the UK Office for Product Safety and Standards found in its March 2025 research [13]. The price ceiling for a manual roller is therefore set by what a buyer can do for free and by what a label may say.
Controlled Temperature and Expert Backing Open a Premium Tier
Hyperice built its X 2 devices on a thermoelectric system with cold down to 4°C and heat up to 49°C and no ice or liquid [10]. Therabody put money into expertise and stores: it appointed a Chief Dermatologist in April 2026 [20] and widened its Ulta Beauty distribution in March 2026 [3]. A manual roller maker can borrow both moves, by publishing use guidance and by getting the product handled in stores.
Which country CAGRs are profiled in the Facial Ice Rollers Market?
Table 4: Country CAGRs for the Facial Ice Rollers Market (%), 2026 to 2036
| Country | CAGR |
|---|---|
| Saudi Arabia | 6.2% |
| UAE | 5.9% |
| South Korea | 5.6% |
| USA | 5.2% |
| Germany | 4.9% |
| UK | 4.6% |
| France | 4.3% |
| Japan | 3.9% |
Country-wise Analysis
Saudi Arabia: On 18 August 2025, the Ministry of Commerce published an evaluation of 100 prominent e-commerce stores against ten criteria, including exchange, return and refund policies, privacy policies, and visible licence and tax details [18]. The facial ice rollers market in Saudi Arabia is projected to grow at a 6.2% CAGR through 2036, the fastest of the eight profiled countries. A seller of small beauty tools online is scored against the same checklist as larger stores, so return terms and licence details become part of the product page.
UAE: Selling online in the UAE starts with a licence. Under Federal Decree by Law No. 14 of 2023 on Modern Technology-Based Trade, mainland sellers need a commercial licence with e-commerce activity from the emirate economic department plus approval from the Telecommunications and Digital Government Regulatory Authority, while free zone licences allow online sales within the free zone and internationally [21]. The market is forecast to grow at a 5.9% CAGR through 2036. With a formal entry step, delivery reliability and storefront quality are likely to separate brands.
South Korea: Overseas online purchases of Korean products reached KRW 3.02 trillion in 2025, up 16.4%, and cosmetics grew 20.4% [4]. The figure counts foreign buyers of Korean goods and not Korean buyers of rollers, so it signals how far beauty has moved online and not demand for the tool. The South Korean market is expected to grow at a 5.6% CAGR through 2036. Rollers sit next to other beauty tools in the same online results, so design is where a supplier can stand apart.
USA: Two retail signals sit side by side. E-commerce reached 17.1% of US retail sales in the second quarter of 2026 [1], and Therabody expanded to more than 1,000 Ulta Beauty doors in March 2026 [3]. The second is a controlled-temperature device and not a manual roller, but it shows specialty beauty stores selling facial cooling. The US market is expected to register a 5.2% CAGR through 2036. Manual roller brands compete on price and clear use instructions.
Germany: Germany is forecast to expand at a 4.9% CAGR through 2036, on an EU base where 78% of internet users aged 16 to 74 bought online in 2025 [5]. Regulation (EU) 2023/988 on General Product Safety covers online marketplaces, distance sales and responsible economic operators [22]. A roller sold through a marketplace therefore needs traceable operator details and use instructions.
UK: The UK market is projected to grow at a 4.6% CAGR through 2036. Internet sales were 27.5% of retail sales in 2025 [2], so a listing is compared with competing rollers on price within a few clicks. The Office for Product Safety and Standards published research in March 2025 on consumer journeys in online marketplaces [13]. Cleaning guidance and a named material are low-cost ways for a brand to look different from a bare listing.
France: In 2024, 63% of people in France aged 15 and over had bought online within three months, against 40% in 2013 [6]. Online access has stopped being the constraint, and the French market is expected to grow at a 4.3% CAGR through 2036. What remains is the reason to pay more than a free substitute costs: material feel, how long the tool stays cold, and packaging.
Japan: Japan has the lowest CAGR of the eight profiled countries, 3.9% through 2036, and that rate says nothing about market size. B2C e-commerce reached JPY 26.1 trillion in 2024, up 5.1%, and the goods e-commerce ratio was 9.8%, up 0.4 percentage points [7]. With most goods still bought in stores, specialty retail and in-store education carry more weight, and repeat use matters more than novelty.
Who are the notable companies in the Facial Ice Rollers Market?
Hyperice, Lush, Renpho, The Body Shop, Plunge, Therabody, Church & Dwight and HigherDOSE are the notable companies profiled in this market.
Therabody lists the TheraFace Depuffing Wand [9]. Hyperice sells thermoelectric hot and cold devices for the knee and shoulder [10]. Church & Dwight announced the shutdown or sale of Flawless [12].
- Therabody: TheraFace Depuffing Wand, sold on Ulta.com and in more than 1,000 Ulta Beauty doors [3].
- Church & Dwight: Flawless, Spinbrush and Waterpik showerhead businesses, with a shutdown or sale announced in May 2025 [12].
Competitive Benchmarking: Facial Ice Rollers Market
Table 5: Competitive Benchmarking for the Facial Ice Rollers Market (product and channel listings), 2025 to 2026
| Company | Product or business | Format | Channel or capability | Source |
|---|---|---|---|---|
| Therabody | TheraFace Depuffing Wand, listed at USD 169.99 | Battery-powered device with cold and heat modes | Ulta.com and more than 1,000 Ulta Beauty doors | Therabody, Ulta Beauty announcements, 5 August 2025 [9] and 31 March 2026 [3] |
| Hyperice | X 2 Knee and X 2 Shoulder, US price USD 449 | Thermoelectric hot and cold with compression | Cold to 4°C, heat to 49°C. Hyperice.com, Best Buy, Dick’s Sporting Goods, REI | Hyperice, X 2 launch, 19 August 2025 [10] |
| Church & Dwight | Flawless, Spinbrush and Waterpik showerhead businesses | Shut down or sale announced | About USD 150 million combined net sales across three businesses | Church & Dwight, Q1 2025 results, 1 May 2025 [12] |
Key Developments in the Facial Ice Rollers Market
- In May 2025, Church & Dwight announced it would shut down or sell its Flawless, Spinbrush and Waterpik showerhead businesses, which carry about USD 150 million of combined net sales [12].
- In August 2025, Therabody launched on Ulta.com with the TheraFace Depuffing Wand and more than 300 Ulta Beauty stores planned [9].
- In August 2025, Hyperice launched the X 2 Knee and X 2 Shoulder with five cooling and five heating levels, cold to 4°C, heat to 49°C and a US price of USD 449 [10].
- In March 2026, Therabody added more than 650 Ulta Beauty stores, taking distribution to more than 1,000 doors with the TheraFace Depuffing Wand in the assortment [3].
- In April 2026, Therabody appointed Dr. Dhaval Bhanusali as its first Chief Dermatologist to advise on product development, education and marketing [20].
Key Players in the Facial Ice Rollers Market
- Controlled-Temperature Facial Devices
- Therabody
- Thermal Recovery Platforms
- Hyperice
- Facial Tool Portfolios Under Review
- Church & Dwight (Flawless)
- Other Profiled Companies
- Lush
- The Body Shop
- Renpho
- Plunge
- HigherDOSE
Facial Ice Rollers Market - Report Scope
Table 6: Report Scope for the Facial Ice Rollers Market (descriptive), 2025 to 2036
| Coverage field | Report scope |
|---|---|
| Market breakdown | Product type, nature, use occasion, price tier, sales channel, and region |
| Quantitative units | USD million |
| Market definition | Includes revenue from stand-alone reusable facial ice rollers and packaged gift or travel sets where the facial ice roller is the named product. Excludes skincare formulations, gua sha-only tools, non-cooling facial massagers, full-body cold-plunge systems, supplements and spa-service revenue. Bundled or adjacent revenue is included only when directly attributable to the named facial ice roller. |
| Regions covered | North America, Latin America, Western Europe, Eastern Europe, East Asia, South Asia and Pacific, Middle East and Africa |
| Countries covered | Saudi Arabia, UAE, South Korea, USA, Germany, UK, France, Japan |
| Key companies profiled | Hyperice, Lush,Renpho, The Body Shop, Therabody, Church & Dwight, HigherDOSE |
| Forecast period | 2026 to 2036 |
| Approach | Secondary research with market modelling |
Facial Ice Rollers Market - Research Methodology
Table 7: Research Methodology for the Facial Ice Rollers Market (descriptive), 2025 to 2036
| Method | Approach |
|---|---|
| Desk Research | Desk research includes government and statistical agency releases, regulatory publications, company announcements, product pages and retail listings. |
| Market Sizing and Forecasting | Market values and segment shares are FMI estimates. The 2026 estimate of USD 385.8 million is rolled forward at a 4.9% CAGR over the 2026 to 2036 period. Country growth rates are FMI estimates. |
| Competitive Assessment | Companies are included where public documents describe a facial cooling product or an adjacent thermal device. |
| Data Validation | Retail, population, price and company figures are cross-checked against the published source documents. |
Facial Ice Rollers Market by Segments
Facial Ice Rollers Market segmented by Product Type:
- Everyday Essentials
- Targeted Therapy Formats
- Premium & Smart Formats
- Gift & Travel Sets
Facial Ice Rollers Market segmented by Nature:
- Conventional
- Natural & Organic
- Vegan
- Clinically Positioned
Facial Ice Rollers Market segmented by Use Occasion:
- Daily Routine
- Recovery & Post-Workout
- Sleep & Wind-Down
- Gifting
Facial Ice Rollers Market segmented by Price Tier:
- Mid-range
- Mass
- Premium
Facial Ice Rollers Market segmented by Sales Channel:
- E-commerce & DTC
- Specialty Wellness Retail
- Pharmacies
- Supermarkets
- Spas & Studios
Facial Ice Rollers Market by Region
- North America
- United States
- Canada
- Latin America
- Brazil
- Mexico
- Argentina
- Chile
- Western Europe
- Germany
- France
- United Kingdom
- Italy
- Spain
- Benelux
- Nordics
- Eastern Europe
- Poland
- Czech Republic
- Romania
- Hungary
- East Asia
- China
- Japan
- South Korea
- South Asia and Pacific
- India
- ASEAN
- Australia and New Zealand
- Middle East and Africa
- GCC Countries
- South Africa
- Türkiye
- Israel
Research Sources and Bibliography
- [1] US Census Bureau: Quarterly Retail E-Commerce Sales, 2nd Quarter 2026. Web page, released 18 August 2026. https://www.census.gov/retail/ecommerce.html
- [2] UK Office for National Statistics: Internet sales as a percentage of total retail sales (ratio). Time series, released 18 September 2026. https://www.ons.gov.uk/businessindustryandtrade/retailindustry/timeseries/j4mc/drsi
- [3] Therabody: Therabody Scales Ulta Beauty Partnership to 1,000+ Doors Nationwide. Press release, 31 March 2026. https://www.therabody.com/blogs/news/therabody-scales-ulta-beauty-partnership-to-1-000-doors-nationwide
- [4] Korea JoongAng Daily: Overseas online sales of Korean products reach record high in 2025. News article, 16 February 2026.
- [5] Eurostat: E-commerce statistics for individuals. Statistics Explained article, accessed 9 October 2026.
- [6] INSEE: Achats de produits et de services en ligne. Statistical release, 14 October 2025.
- [7] Japan Ministry of Economy, Trade and Industry: Results of FY2024 E-Commerce Market Survey Compiled. Press release, 26 August 2025.
- [8] Ulta Beauty: Skin Gym CryoRoll Ice Roller. Product page, accessed 9 October 2026.
- [9] Therabody: Therabody Brings Science-Backed Wellness to Ulta Beauty, The Nation’s Largest Beauty Retailer. Press release, 5 August 2025.
- [10] Hyperice: Hyperice Unveils Next Generation of Contrast Therapy Innovation, Hyperice X 2 Knee and Hyperice X 2 Shoulder. Press release, 19 August 2025.
- [11] US Food and Drug Administration: Cosmetics Labeling Claims. Web page, accessed 9 October 2026. https://www.fda.gov/cosmetics/cosmetics-labeling/cosmetics-labeling-claims
- [12] Church & Dwight: Church & Dwight Reports First Quarter 2025 Results. Press release, 1 May 2025.
- [13] UK Office for Product Safety and Standards: Online marketplaces consumer journeys. Research report, 24 March 2025.
- [14] Future Market Insights: At-Home Therapeutic Beauty Devices Market. Report page, accessed 9 October 2026.
- [15] Future Market Insights: Personal Care Appliances Market. Report page, accessed 9 October 2026.
- [16] Future Market Insights: High-Frequency Facial Wands Market. Report page, accessed 9 October 2026.
- [17] Future Market Insights: Facial Steamer Market. Report page, accessed 9 October 2026.
- [18] Saudi Arabia Ministry of Commerce: Ministry of Commerce Announces the Results of E-Commerce Store Evaluation. Press release, 18 August 2025.
- [19] United Nations, Department of Economic and Social Affairs: World Population Prospects 2024, medium variant. Population database, 2026 and 2036 totals, accessed 9 October 2026.
- [20] Therabody: Therabody Appoints Dr. Dhaval Bhanusali as Chief Dermatologist, Deepening Commitment to Science-Backed Innovation. Press release, 29 April 2026.
- [21] UAE Government: eCommerce. Web page, accessed 9 October 2026.
- [22] European Parliament and Council of the European Union: Regulation (EU) 2023/988 on General Product Safety. Regulation, accessed 9 October 2026.
This Report Answers
- How large is the Facial Ice Rollers Market in 2026 and what value is forecast for 2036?
- Why do everyday essentials hold the leading product type position?
- Why does conventional lead within nature?
- How do growth rates differ across Saudi Arabia, UAE, South Korea, USA, Germany, UK, France and Japan?
- Which profiled companies supply facial cooling products or adjacent thermal and beauty devices?
- What limits adoption, trade-up or supplier switching in a category with low-cost substitutes?
Table of Content
- Key Takeaways
- Market Size and CAGR
- Top Growth Driver
- Fastest Growing Segment
- Leading Region
- Key Companies
- Emerging Opportunities
- Executive Summary
- Global Market Outlook
- Demand-side Trends
- Supply-side Trends
- Technology Roadmap Analysis
- Analysis and Recommendations
- Analyst Perspective (What is happening? Why now? What should investors know?)
- Key Questions Answered
- How large is the market?
- What is the CAGR?
- What are key trends?
- Which region dominates?
- Who are the leaders?
Read More...
- Market Overview
- Market Coverage / Taxonomy
- Market Definition / Scope / Limitations
- Research Methodology
- Chapter Orientation
- Analytical Lens and Working Hypotheses
- Market Structure, Signals, and Trend Drivers
- Benchmarking and Cross-market Comparability
- Market Sizing, Forecasting, and Opportunity Mapping
- Research Design and Evidence Framework
- Desk Research Programme (Secondary Evidence)
- Expert Input and Fieldwork (Primary Evidence)
- Tooling, Models, and Reference Databases
- Data Engineering and Model Build
- Quality Assurance and Audit Trail
- Market Background
- Market Dynamics (Drivers, Restraints, Opportunity, Trends)
- Scenario Forecast (Optimistic, Likely, Conservative)
- Impact Analysis
- AI Impact
- Sustainability Impact
- Regulatory Impact
- Technology Impact
- Consumer / Buyer Analysis
- Purchase Drivers
- Adoption Barriers
- Buyer Journey
- Opportunity Map Analysis
- Product Life Cycle Analysis
- Supply Chain Analysis
- Investment Feasibility Matrix
- Value Chain Analysis
- PESTLE and Porter's Analysis
- Regulatory Landscape
- Regional Parent Market Outlook
- Production and Consumption Statistics
- Import and Export Statistics
- Global Market Analysis and Forecast, 2021 to 2036
- Historical Market Size Value (USD Million) Analysis, 2021 to 2025
- Current and Future Market Size Value (USD Million) Projections, 2026 to 2036
- Y-o-Y Growth Trend Analysis
- Absolute $ Opportunity Analysis
- Global Market Pricing Analysis, 2021 to 2036
- Global Market Analysis and Forecast, By Product Type, 2021 to 2036
- Introduction / Key Findings
- Historical Market Size Value (USD Million) Analysis By Product Type, 2021 to 2025
- Current and Future Market Size Value (USD Million) Analysis and Forecast By Product Type, 2026 to 2036
- Everyday Essentials
- Targeted Therapy Formats
- Premium & Smart Formats
- Gift & Travel Sets
- Y-o-Y Growth Trend Analysis By Product Type, 2021 to 2025
- Absolute $ Opportunity Analysis By Product Type, 2026 to 2036
- Global Market Analysis and Forecast, By Nature, 2021 to 2036
- Introduction / Key Findings
- Historical Market Size Value (USD Million) Analysis By Nature, 2021 to 2025
- Current and Future Market Size Value (USD Million) Analysis and Forecast By Nature, 2026 to 2036
- Conventional
- Natural & Organic
- Vegan
- Clinically Positioned
- Y-o-Y Growth Trend Analysis By Nature, 2021 to 2025
- Absolute $ Opportunity Analysis By Nature, 2026 to 2036
- Global Market Analysis and Forecast, By Use Occasion, 2021 to 2036
- Introduction / Key Findings
- Historical Market Size Value (USD Million) Analysis By Use Occasion, 2021 to 2025
- Current and Future Market Size Value (USD Million) Analysis and Forecast By Use Occasion, 2026 to 2036
- Daily Routine
- Recovery & Post-Workout
- Sleep & Wind-Down
- Gifting
- Y-o-Y Growth Trend Analysis By Use Occasion, 2021 to 2025
- Absolute $ Opportunity Analysis By Use Occasion, 2026 to 2036
- Global Market Analysis and Forecast, By Price Tier, 2021 to 2036
- Introduction / Key Findings
- Historical Market Size Value (USD Million) Analysis By Price Tier, 2021 to 2025
- Current and Future Market Size Value (USD Million) Analysis and Forecast By Price Tier, 2026 to 2036
- Mid-range
- Mass
- Premium
- Y-o-Y Growth Trend Analysis By Price Tier, 2021 to 2025
- Absolute $ Opportunity Analysis By Price Tier, 2026 to 2036
- Global Market Analysis and Forecast, By Sales Channel, 2021 to 2036
- Introduction / Key Findings
- Historical Market Size Value (USD Million) Analysis By Sales Channel, 2021 to 2025
- Current and Future Market Size Value (USD Million) Analysis and Forecast By Sales Channel, 2026 to 2036
- E-commerce & DTC
- Specialty Wellness Retail
- Pharmacies
- Supermarkets
- Spas & Studios
- Y-o-Y Growth Trend Analysis By Sales Channel, 2021 to 2025
- Absolute $ Opportunity Analysis By Sales Channel, 2026 to 2036
- Global Market Analysis and Forecast, By Region, 2021 to 2036
- Introduction
- Historical Market Size Value (USD Million) Analysis By Region, 2021 to 2025
- Current Market Size Value (USD Million) Analysis and Forecast By Region, 2026 to 2036
- North America
- Latin America
- Western Europe
- Eastern Europe
- East Asia
- South Asia and Pacific
- Middle East and Africa
- Market Attractiveness Analysis By Region
- North America Market Analysis and Forecast, By Country, 2021 to 2036
- Historical Market Size Value (USD Million) Trend Analysis By Market Taxonomy, 2021 to 2025
- Market Size Value (USD Million) Forecast By Market Taxonomy, 2026 to 2036
- By Country
- United States
- Canada
- By Product Type
- By Nature
- By Use Occasion
- By Price Tier
- By Sales Channel
- By Country
- Market Attractiveness Analysis
- By Country
- By Product Type
- By Nature
- By Use Occasion
- By Price Tier
- By Sales Channel
- Key Takeaways
- Latin America Market Analysis and Forecast, By Country
- Historical Market Size Value (USD Million) Trend Analysis By Market Taxonomy, 2021 to 2025
- Market Size Value (USD Million) Forecast By Market Taxonomy, 2026 to 2036
- By Country
- Brazil
- Mexico
- Argentina
- Chile
- By Product Type
- By Nature
- By Use Occasion
- By Price Tier
- By Sales Channel
- By Country
- Market Attractiveness Analysis
- By Country
- By Product Type
- By Nature
- By Use Occasion
- By Price Tier
- By Sales Channel
- Key Takeaways
- Western Europe Market Analysis and Forecast, By Country
- Historical Market Size Value (USD Million) Trend Analysis By Market Taxonomy, 2021 to 2025
- Market Size Value (USD Million) Forecast By Market Taxonomy, 2026 to 2036
- By Country
- Germany
- France
- United Kingdom
- Italy
- Spain
- Benelux
- Nordics
- By Product Type
- By Nature
- By Use Occasion
- By Price Tier
- By Sales Channel
- By Country
- Market Attractiveness Analysis
- By Country
- By Product Type
- By Nature
- By Use Occasion
- By Price Tier
- By Sales Channel
- Key Takeaways
- Eastern Europe Market Analysis and Forecast, By Country
- Historical Market Size Value (USD Million) Trend Analysis By Market Taxonomy, 2021 to 2025
- Market Size Value (USD Million) Forecast By Market Taxonomy, 2026 to 2036
- By Country
- Poland
- Czech Republic
- Romania
- Hungary
- By Product Type
- By Nature
- By Use Occasion
- By Price Tier
- By Sales Channel
- By Country
- Market Attractiveness Analysis
- By Country
- By Product Type
- By Nature
- By Use Occasion
- By Price Tier
- By Sales Channel
- Key Takeaways
- East Asia Market Analysis and Forecast, By Country
- Historical Market Size Value (USD Million) Trend Analysis By Market Taxonomy, 2021 to 2025
- Market Size Value (USD Million) Forecast By Market Taxonomy, 2026 to 2036
- By Country
- China
- Japan
- South Korea
- By Product Type
- By Nature
- By Use Occasion
- By Price Tier
- By Sales Channel
- By Country
- Market Attractiveness Analysis
- By Country
- By Product Type
- By Nature
- By Use Occasion
- By Price Tier
- By Sales Channel
- Key Takeaways
- South Asia and Pacific Market Analysis and Forecast, By Country
- Historical Market Size Value (USD Million) Trend Analysis By Market Taxonomy, 2021 to 2025
- Market Size Value (USD Million) Forecast By Market Taxonomy, 2026 to 2036
- By Country
- India
- ASEAN
- Australia and New Zealand
- By Product Type
- By Nature
- By Use Occasion
- By Price Tier
- By Sales Channel
- By Country
- Market Attractiveness Analysis
- By Country
- By Product Type
- By Nature
- By Use Occasion
- By Price Tier
- By Sales Channel
- Key Takeaways
- Middle East and Africa Market Analysis and Forecast, By Country
- Historical Market Size Value (USD Million) Trend Analysis By Market Taxonomy, 2021 to 2025
- Market Size Value (USD Million) Forecast By Market Taxonomy, 2026 to 2036
- By Country
- GCC Countries
- South Africa
- Türkiye
- Israel
- By Product Type
- By Nature
- By Use Occasion
- By Price Tier
- By Sales Channel
- By Country
- Market Attractiveness Analysis
- By Country
- By Product Type
- By Nature
- By Use Occasion
- By Price Tier
- By Sales Channel
- Key Takeaways
- Key Countries Market Analysis
- United States
- Pricing Analysis
- Market Share Analysis, 2025
- By Product Type
- By Nature
- By Use Occasion
- By Price Tier
- By Sales Channel
- Canada
- Pricing Analysis
- Market Share Analysis, 2025
- By Product Type
- By Nature
- By Use Occasion
- By Price Tier
- By Sales Channel
- Mexico
- Pricing Analysis
- Market Share Analysis, 2025
- By Product Type
- By Nature
- By Use Occasion
- By Price Tier
- By Sales Channel
- Brazil
- Pricing Analysis
- Market Share Analysis, 2025
- By Product Type
- By Nature
- By Use Occasion
- By Price Tier
- By Sales Channel
- Chile
- Pricing Analysis
- Market Share Analysis, 2025
- By Product Type
- By Nature
- By Use Occasion
- By Price Tier
- By Sales Channel
- Germany
- Pricing Analysis
- Market Share Analysis, 2025
- By Product Type
- By Nature
- By Use Occasion
- By Price Tier
- By Sales Channel
- United Kingdom
- Pricing Analysis
- Market Share Analysis, 2025
- By Product Type
- By Nature
- By Use Occasion
- By Price Tier
- By Sales Channel
- Italy
- Pricing Analysis
- Market Share Analysis, 2025
- By Product Type
- By Nature
- By Use Occasion
- By Price Tier
- By Sales Channel
- Spain
- Pricing Analysis
- Market Share Analysis, 2025
- By Product Type
- By Nature
- By Use Occasion
- By Price Tier
- By Sales Channel
- France
- Pricing Analysis
- Market Share Analysis, 2025
- By Product Type
- By Nature
- By Use Occasion
- By Price Tier
- By Sales Channel
- India
- Pricing Analysis
- Market Share Analysis, 2025
- By Product Type
- By Nature
- By Use Occasion
- By Price Tier
- By Sales Channel
- ASEAN
- Pricing Analysis
- Market Share Analysis, 2025
- By Product Type
- By Nature
- By Use Occasion
- By Price Tier
- By Sales Channel
- Australia and New Zealand
- Pricing Analysis
- Market Share Analysis, 2025
- By Product Type
- By Nature
- By Use Occasion
- By Price Tier
- By Sales Channel
- China
- Pricing Analysis
- Market Share Analysis, 2025
- By Product Type
- By Nature
- By Use Occasion
- By Price Tier
- By Sales Channel
- Japan
- Pricing Analysis
- Market Share Analysis, 2025
- By Product Type
- By Nature
- By Use Occasion
- By Price Tier
- By Sales Channel
- South Korea
- Pricing Analysis
- Market Share Analysis, 2025
- By Product Type
- By Nature
- By Use Occasion
- By Price Tier
- By Sales Channel
- Poland
- Pricing Analysis
- Market Share Analysis, 2025
- By Product Type
- By Nature
- By Use Occasion
- By Price Tier
- By Sales Channel
- Hungary
- Pricing Analysis
- Market Share Analysis, 2025
- By Product Type
- By Nature
- By Use Occasion
- By Price Tier
- By Sales Channel
- Türkiye
- Pricing Analysis
- Market Share Analysis, 2025
- By Product Type
- By Nature
- By Use Occasion
- By Price Tier
- By Sales Channel
- South Africa
- Pricing Analysis
- Market Share Analysis, 2025
- By Product Type
- By Nature
- By Use Occasion
- By Price Tier
- By Sales Channel
- Saudi Arabia
- Pricing Analysis
- Market Share Analysis, 2025
- By Product Type
- By Nature
- By Use Occasion
- By Price Tier
- By Sales Channel
- UAE
- Pricing Analysis
- Market Share Analysis, 2025
- By Product Type
- By Nature
- By Use Occasion
- By Price Tier
- By Sales Channel
- United States
- Market Structure Analysis
- Competition Dashboard
- Competition Benchmarking
- Market Share Analysis of Top Players
- By Regional
- By Product Type
- By Nature
- By Use Occasion
- By Price Tier
- By Sales Channel
- Emerging Startups
- Innovation Benchmarking
- Competition Analysis
- Competition Deep Dive
- Therabody
- Overview
- Product Portfolio
- Profitability by Market Segments
- Sales Footprint
- Strategy Overview
- Marketing Strategy
- Product Strategy
- Channel Strategy
- Hyperice
- Church & Dwight
- Controlled-Temperature Facial Devices
- Thermal Recovery Platforms
- Facial Tool Portfolios Under Review
- Church & Dwight (Flawless)
- Other Profiled Companies
- Lush
- The Body Shop
- Renpho
- HigherDOSE
- Therabody
- Case Studies
- Success Stories
- Recent Developments
- Competition Deep Dive
- Assumptions & Acronyms Used
List of Tables
- Table 1: Global Market Value (USD Million) Forecast by Region, 2021 to 2036
- Table 2: Global Market Value (USD Million) Forecast by Product Type, 2021 to 2036
- Table 3: Global Market Value (USD Million) Forecast by Nature, 2021 to 2036
- Table 4: Global Market Value (USD Million) Forecast by Use Occasion, 2021 to 2036
- Table 5: Global Market Value (USD Million) Forecast by Price Tier, 2021 to 2036
- Table 6: Global Market Value (USD Million) Forecast by Sales Channel, 2021 to 2036
- Table 7: North America Market Value (USD Million) Forecast by Country, 2021 to 2036
- Table 8: North America Market Value (USD Million) Forecast by Product Type, 2021 to 2036
- Table 9: North America Market Value (USD Million) Forecast by Nature, 2021 to 2036
- Table 10: North America Market Value (USD Million) Forecast by Use Occasion, 2021 to 2036
- Table 11: North America Market Value (USD Million) Forecast by Price Tier, 2021 to 2036
- Table 12: North America Market Value (USD Million) Forecast by Sales Channel, 2021 to 2036
- Table 13: Latin America Market Value (USD Million) Forecast by Country, 2021 to 2036
- Table 14: Latin America Market Value (USD Million) Forecast by Product Type, 2021 to 2036
- Table 15: Latin America Market Value (USD Million) Forecast by Nature, 2021 to 2036
- Table 16: Latin America Market Value (USD Million) Forecast by Use Occasion, 2021 to 2036
- Table 17: Latin America Market Value (USD Million) Forecast by Price Tier, 2021 to 2036
- Table 18: Latin America Market Value (USD Million) Forecast by Sales Channel, 2021 to 2036
- Table 19: Western Europe Market Value (USD Million) Forecast by Country, 2021 to 2036
- Table 20: Western Europe Market Value (USD Million) Forecast by Product Type, 2021 to 2036
- Table 21: Western Europe Market Value (USD Million) Forecast by Nature, 2021 to 2036
- Table 22: Western Europe Market Value (USD Million) Forecast by Use Occasion, 2021 to 2036
- Table 23: Western Europe Market Value (USD Million) Forecast by Price Tier, 2021 to 2036
- Table 24: Western Europe Market Value (USD Million) Forecast by Sales Channel, 2021 to 2036
- Table 25: Eastern Europe Market Value (USD Million) Forecast by Country, 2021 to 2036
- Table 26: Eastern Europe Market Value (USD Million) Forecast by Product Type, 2021 to 2036
- Table 27: Eastern Europe Market Value (USD Million) Forecast by Nature, 2021 to 2036
- Table 28: Eastern Europe Market Value (USD Million) Forecast by Use Occasion, 2021 to 2036
- Table 29: Eastern Europe Market Value (USD Million) Forecast by Price Tier, 2021 to 2036
- Table 30: Eastern Europe Market Value (USD Million) Forecast by Sales Channel, 2021 to 2036
- Table 31: East Asia Market Value (USD Million) Forecast by Country, 2021 to 2036
- Table 32: East Asia Market Value (USD Million) Forecast by Product Type, 2021 to 2036
- Table 33: East Asia Market Value (USD Million) Forecast by Nature, 2021 to 2036
- Table 34: East Asia Market Value (USD Million) Forecast by Use Occasion, 2021 to 2036
- Table 35: East Asia Market Value (USD Million) Forecast by Price Tier, 2021 to 2036
- Table 36: East Asia Market Value (USD Million) Forecast by Sales Channel, 2021 to 2036
- Table 37: South Asia and Pacific Market Value (USD Million) Forecast by Country, 2021 to 2036
- Table 38: South Asia and Pacific Market Value (USD Million) Forecast by Product Type, 2021 to 2036
- Table 39: South Asia and Pacific Market Value (USD Million) Forecast by Nature, 2021 to 2036
- Table 40: South Asia and Pacific Market Value (USD Million) Forecast by Use Occasion, 2021 to 2036
- Table 41: South Asia and Pacific Market Value (USD Million) Forecast by Price Tier, 2021 to 2036
- Table 42: South Asia and Pacific Market Value (USD Million) Forecast by Sales Channel, 2021 to 2036
- Table 43: Middle East and Africa Market Value (USD Million) Forecast by Country, 2021 to 2036
- Table 44: Middle East and Africa Market Value (USD Million) Forecast by Product Type, 2021 to 2036
- Table 45: Middle East and Africa Market Value (USD Million) Forecast by Nature, 2021 to 2036
- Table 46: Middle East and Africa Market Value (USD Million) Forecast by Use Occasion, 2021 to 2036
- Table 47: Middle East and Africa Market Value (USD Million) Forecast by Price Tier, 2021 to 2036
- Table 48: Middle East and Africa Market Value (USD Million) Forecast by Sales Channel, 2021 to 2036
List of Figures
- Figure 1: Global Market Pricing Analysis
- Figure 2: Global Market Value (USD Million) Forecast 2021-2036
- Figure 3: Global Market Value Share and BPS Analysis by Product Type, 2026 and 2036
- Figure 4: Global Market Y-o-Y Growth Comparison by Product Type, 2026-2036
- Figure 5: Global Market Attractiveness Analysis by Product Type
- Figure 6: Global Market Value Share and BPS Analysis by Nature, 2026 and 2036
- Figure 7: Global Market Y-o-Y Growth Comparison by Nature, 2026-2036
- Figure 8: Global Market Attractiveness Analysis by Nature
- Figure 9: Global Market Value Share and BPS Analysis by Use Occasion, 2026 and 2036
- Figure 10: Global Market Y-o-Y Growth Comparison by Use Occasion, 2026-2036
- Figure 11: Global Market Attractiveness Analysis by Use Occasion
- Figure 12: Global Market Value Share and BPS Analysis by Price Tier, 2026 and 2036
- Figure 13: Global Market Y-o-Y Growth Comparison by Price Tier, 2026-2036
- Figure 14: Global Market Attractiveness Analysis by Price Tier
- Figure 15: Global Market Value Share and BPS Analysis by Sales Channel, 2026 and 2036
- Figure 16: Global Market Y-o-Y Growth Comparison by Sales Channel, 2026-2036
- Figure 17: Global Market Attractiveness Analysis by Sales Channel
- Figure 18: Global Market Value (USD Million) Share and BPS Analysis by Region, 2026 and 2036
- Figure 19: Global Market Y-o-Y Growth Comparison by Region, 2026-2036
- Figure 20: Global Market Attractiveness Analysis by Region
- Figure 21: North America Market Incremental Dollar Opportunity, 2026-2036
- Figure 22: Latin America Market Incremental Dollar Opportunity, 2026-2036
- Figure 23: Western Europe Market Incremental Dollar Opportunity, 2026-2036
- Figure 24: Eastern Europe Market Incremental Dollar Opportunity, 2026-2036
- Figure 25: East Asia Market Incremental Dollar Opportunity, 2026-2036
- Figure 26: South Asia and Pacific Market Incremental Dollar Opportunity, 2026-2036
- Figure 27: Middle East and Africa Market Incremental Dollar Opportunity, 2026-2036
- Figure 28: North America Market Value Share and BPS Analysis by Country, 2026 and 2036
- Figure 29: North America Market Value Share and BPS Analysis by Product Type, 2026 and 2036
- Figure 30: North America Market Y-o-Y Growth Comparison by Product Type, 2026-2036
- Figure 31: North America Market Attractiveness Analysis by Product Type
- Figure 32: North America Market Value Share and BPS Analysis by Nature, 2026 and 2036
- Figure 33: North America Market Y-o-Y Growth Comparison by Nature, 2026-2036
- Figure 34: North America Market Attractiveness Analysis by Nature
- Figure 35: North America Market Value Share and BPS Analysis by Use Occasion, 2026 and 2036
- Figure 36: North America Market Y-o-Y Growth Comparison by Use Occasion, 2026-2036
- Figure 37: North America Market Attractiveness Analysis by Use Occasion
- Figure 38: North America Market Value Share and BPS Analysis by Price Tier, 2026 and 2036
- Figure 39: North America Market Y-o-Y Growth Comparison by Price Tier, 2026-2036
- Figure 40: North America Market Attractiveness Analysis by Price Tier
- Figure 41: North America Market Value Share and BPS Analysis by Sales Channel, 2026 and 2036
- Figure 42: North America Market Y-o-Y Growth Comparison by Sales Channel, 2026-2036
- Figure 43: North America Market Attractiveness Analysis by Sales Channel
- Figure 44: Latin America Market Value Share and BPS Analysis by Country, 2026 and 2036
- Figure 45: Latin America Market Value Share and BPS Analysis by Product Type, 2026 and 2036
- Figure 46: Latin America Market Y-o-Y Growth Comparison by Product Type, 2026-2036
- Figure 47: Latin America Market Attractiveness Analysis by Product Type
- Figure 48: Latin America Market Value Share and BPS Analysis by Nature, 2026 and 2036
- Figure 49: Latin America Market Y-o-Y Growth Comparison by Nature, 2026-2036
- Figure 50: Latin America Market Attractiveness Analysis by Nature
- Figure 51: Latin America Market Value Share and BPS Analysis by Use Occasion, 2026 and 2036
- Figure 52: Latin America Market Y-o-Y Growth Comparison by Use Occasion, 2026-2036
- Figure 53: Latin America Market Attractiveness Analysis by Use Occasion
- Figure 54: Latin America Market Value Share and BPS Analysis by Price Tier, 2026 and 2036
- Figure 55: Latin America Market Y-o-Y Growth Comparison by Price Tier, 2026-2036
- Figure 56: Latin America Market Attractiveness Analysis by Price Tier
- Figure 57: Latin America Market Value Share and BPS Analysis by Sales Channel, 2026 and 2036
- Figure 58: Latin America Market Y-o-Y Growth Comparison by Sales Channel, 2026-2036
- Figure 59: Latin America Market Attractiveness Analysis by Sales Channel
- Figure 60: Western Europe Market Value Share and BPS Analysis by Country, 2026 and 2036
- Figure 61: Western Europe Market Value Share and BPS Analysis by Product Type, 2026 and 2036
- Figure 62: Western Europe Market Y-o-Y Growth Comparison by Product Type, 2026-2036
- Figure 63: Western Europe Market Attractiveness Analysis by Product Type
- Figure 64: Western Europe Market Value Share and BPS Analysis by Nature, 2026 and 2036
- Figure 65: Western Europe Market Y-o-Y Growth Comparison by Nature, 2026-2036
- Figure 66: Western Europe Market Attractiveness Analysis by Nature
- Figure 67: Western Europe Market Value Share and BPS Analysis by Use Occasion, 2026 and 2036
- Figure 68: Western Europe Market Y-o-Y Growth Comparison by Use Occasion, 2026-2036
- Figure 69: Western Europe Market Attractiveness Analysis by Use Occasion
- Figure 70: Western Europe Market Value Share and BPS Analysis by Price Tier, 2026 and 2036
- Figure 71: Western Europe Market Y-o-Y Growth Comparison by Price Tier, 2026-2036
- Figure 72: Western Europe Market Attractiveness Analysis by Price Tier
- Figure 73: Western Europe Market Value Share and BPS Analysis by Sales Channel, 2026 and 2036
- Figure 74: Western Europe Market Y-o-Y Growth Comparison by Sales Channel, 2026-2036
- Figure 75: Western Europe Market Attractiveness Analysis by Sales Channel
- Figure 76: Eastern Europe Market Value Share and BPS Analysis by Country, 2026 and 2036
- Figure 77: Eastern Europe Market Value Share and BPS Analysis by Product Type, 2026 and 2036
- Figure 78: Eastern Europe Market Y-o-Y Growth Comparison by Product Type, 2026-2036
- Figure 79: Eastern Europe Market Attractiveness Analysis by Product Type
- Figure 80: Eastern Europe Market Value Share and BPS Analysis by Nature, 2026 and 2036
- Figure 81: Eastern Europe Market Y-o-Y Growth Comparison by Nature, 2026-2036
- Figure 82: Eastern Europe Market Attractiveness Analysis by Nature
- Figure 83: Eastern Europe Market Value Share and BPS Analysis by Use Occasion, 2026 and 2036
- Figure 84: Eastern Europe Market Y-o-Y Growth Comparison by Use Occasion, 2026-2036
- Figure 85: Eastern Europe Market Attractiveness Analysis by Use Occasion
- Figure 86: Eastern Europe Market Value Share and BPS Analysis by Price Tier, 2026 and 2036
- Figure 87: Eastern Europe Market Y-o-Y Growth Comparison by Price Tier, 2026-2036
- Figure 88: Eastern Europe Market Attractiveness Analysis by Price Tier
- Figure 89: Eastern Europe Market Value Share and BPS Analysis by Sales Channel, 2026 and 2036
- Figure 90: Eastern Europe Market Y-o-Y Growth Comparison by Sales Channel, 2026-2036
- Figure 91: Eastern Europe Market Attractiveness Analysis by Sales Channel
- Figure 92: East Asia Market Value Share and BPS Analysis by Country, 2026 and 2036
- Figure 93: East Asia Market Value Share and BPS Analysis by Product Type, 2026 and 2036
- Figure 94: East Asia Market Y-o-Y Growth Comparison by Product Type, 2026-2036
- Figure 95: East Asia Market Attractiveness Analysis by Product Type
- Figure 96: East Asia Market Value Share and BPS Analysis by Nature, 2026 and 2036
- Figure 97: East Asia Market Y-o-Y Growth Comparison by Nature, 2026-2036
- Figure 98: East Asia Market Attractiveness Analysis by Nature
- Figure 99: East Asia Market Value Share and BPS Analysis by Use Occasion, 2026 and 2036
- Figure 100: East Asia Market Y-o-Y Growth Comparison by Use Occasion, 2026-2036
- Figure 101: East Asia Market Attractiveness Analysis by Use Occasion
- Figure 102: East Asia Market Value Share and BPS Analysis by Price Tier, 2026 and 2036
- Figure 103: East Asia Market Y-o-Y Growth Comparison by Price Tier, 2026-2036
- Figure 104: East Asia Market Attractiveness Analysis by Price Tier
- Figure 105: East Asia Market Value Share and BPS Analysis by Sales Channel, 2026 and 2036
- Figure 106: East Asia Market Y-o-Y Growth Comparison by Sales Channel, 2026-2036
- Figure 107: East Asia Market Attractiveness Analysis by Sales Channel
- Figure 108: South Asia and Pacific Market Value Share and BPS Analysis by Country, 2026 and 2036
- Figure 109: South Asia and Pacific Market Value Share and BPS Analysis by Product Type, 2026 and 2036
- Figure 110: South Asia and Pacific Market Y-o-Y Growth Comparison by Product Type, 2026-2036
- Figure 111: South Asia and Pacific Market Attractiveness Analysis by Product Type
- Figure 112: South Asia and Pacific Market Value Share and BPS Analysis by Nature, 2026 and 2036
- Figure 113: South Asia and Pacific Market Y-o-Y Growth Comparison by Nature, 2026-2036
- Figure 114: South Asia and Pacific Market Attractiveness Analysis by Nature
- Figure 115: South Asia and Pacific Market Value Share and BPS Analysis by Use Occasion, 2026 and 2036
- Figure 116: South Asia and Pacific Market Y-o-Y Growth Comparison by Use Occasion, 2026-2036
- Figure 117: South Asia and Pacific Market Attractiveness Analysis by Use Occasion
- Figure 118: South Asia and Pacific Market Value Share and BPS Analysis by Price Tier, 2026 and 2036
- Figure 119: South Asia and Pacific Market Y-o-Y Growth Comparison by Price Tier, 2026-2036
- Figure 120: South Asia and Pacific Market Attractiveness Analysis by Price Tier
- Figure 121: South Asia and Pacific Market Value Share and BPS Analysis by Sales Channel, 2026 and 2036
- Figure 122: South Asia and Pacific Market Y-o-Y Growth Comparison by Sales Channel, 2026-2036
- Figure 123: South Asia and Pacific Market Attractiveness Analysis by Sales Channel
- Figure 124: Middle East and Africa Market Value Share and BPS Analysis by Country, 2026 and 2036
- Figure 125: Middle East and Africa Market Value Share and BPS Analysis by Product Type, 2026 and 2036
- Figure 126: Middle East and Africa Market Y-o-Y Growth Comparison by Product Type, 2026-2036
- Figure 127: Middle East and Africa Market Attractiveness Analysis by Product Type
- Figure 128: Middle East and Africa Market Value Share and BPS Analysis by Nature, 2026 and 2036
- Figure 129: Middle East and Africa Market Y-o-Y Growth Comparison by Nature, 2026-2036
- Figure 130: Middle East and Africa Market Attractiveness Analysis by Nature
- Figure 131: Middle East and Africa Market Value Share and BPS Analysis by Use Occasion, 2026 and 2036
- Figure 132: Middle East and Africa Market Y-o-Y Growth Comparison by Use Occasion, 2026-2036
- Figure 133: Middle East and Africa Market Attractiveness Analysis by Use Occasion
- Figure 134: Middle East and Africa Market Value Share and BPS Analysis by Price Tier, 2026 and 2036
- Figure 135: Middle East and Africa Market Y-o-Y Growth Comparison by Price Tier, 2026-2036
- Figure 136: Middle East and Africa Market Attractiveness Analysis by Price Tier
- Figure 137: Middle East and Africa Market Value Share and BPS Analysis by Sales Channel, 2026 and 2036
- Figure 138: Middle East and Africa Market Y-o-Y Growth Comparison by Sales Channel, 2026-2036
- Figure 139: Middle East and Africa Market Attractiveness Analysis by Sales Channel
- Figure 140: Global Market - Tier Structure Analysis
- Figure 141: Global Market - Company Share Analysis
Frequently Asked Questions
How large is the Facial Ice Rollers Market expected to be in 2026?
Future Market Insights estimates that the facial ice rollers market will reach USD 385.8 million in 2026. The market is projected to expand further and reach USD 622.5 million by 2036.
What CAGR is forecast for the Facial Ice Rollers Market through 2036?
As per FMI, the facial ice rollers market is projected to grow at a 4.9% CAGR from 2026 to 2036. Growth is supported by online retail reach and specialty beauty distribution.
Which product type holds a notable share of the facial ice rollers market in 2026?
Future Market Insights projects everyday essentials to hold 39.0% of product type revenue in 2026. The segment benefits from low setup effort and reuse without power.
Which nature segment holds a notable share in 2026?
FMI finds that conventional products will hold 48.0% of nature revenue in 2026. The value comes from physical cooling and not from an ingredient or clinical claim.
Which country has a notable expansion outlook?
Future Market Insights predicts Saudi Arabia to expand at a 6.2% CAGR during the 2026 to 2036 assessment period, followed by the UAE at 5.9% and South Korea at 5.6%.
Which companies are active in the Facial Ice Rollers Market during 2026?
As per FMI analysis, companies active around the facial ice rollers market include Hyperice, Lush, Vital Proteins, Vitruvi, Renpho, The Body Shop, Plunge, Therabody, Church & Dwight and HigherDOSE.
Preview the report firsthand - request a free sample
Get SampleGet the brochure for pricing and purchase details.
Get PDF
