Feather Meal Market Size and Share Forecast Outlook 2025 to 2035   

The global feather meal market is valued at USD 619.1 million in 2025 and is slated to reach USD 1,396.7 million by 2035, reflecting a CAGR of 8.6%.
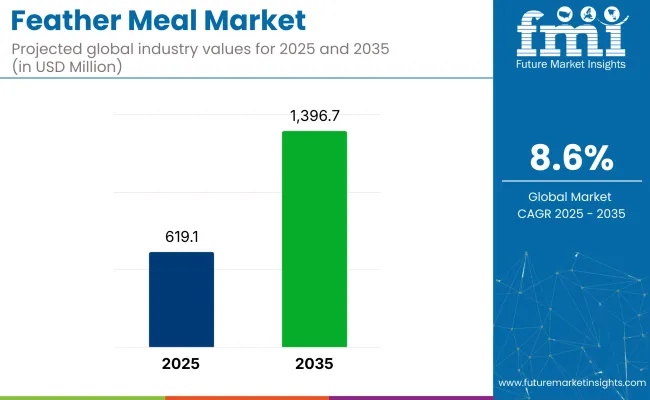
Quick Stats - Feather Meal Market

  • Market Value (2025): USD 619.1 million
  • Forecast Value (2035): USD 1,396.7 million
  • Forecast CAGR: 8.6%
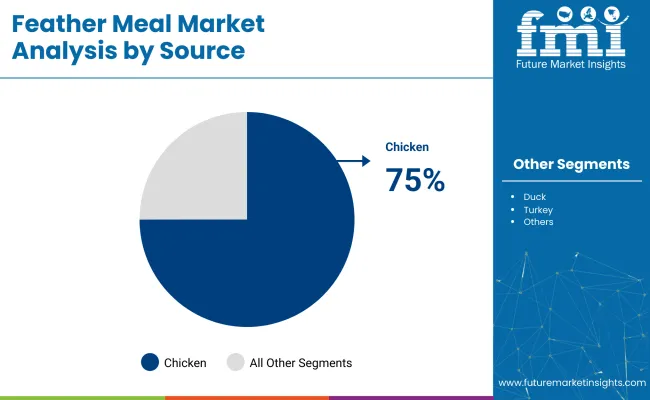
  • Source Leader in 2025: Chicken (75% Market Share)
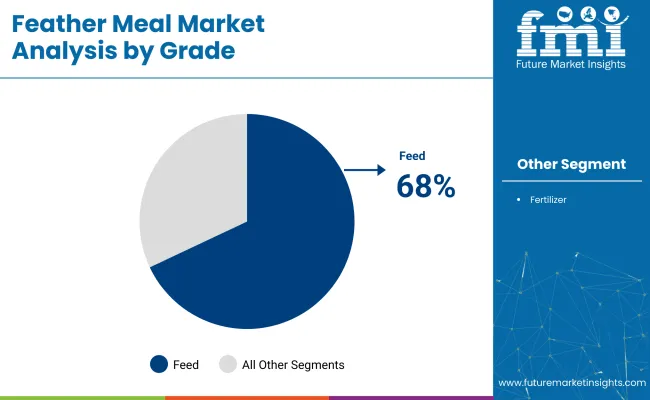
  • Top Grade Segment: Feed Grade (68% Market Share in 2025)
  • Key Growth Region:  Western Europe (Germany is the fastest growing market with 7.8% CAGR)
Metric Value
2025 Market Value USD 619.1 million
2035 Market Value USD 1,396.7 million
CAGR (2025 to 2035) 8.6%

Growth is driven by increasing demand for sustainable high-protein animal feed ingredients, expanded applications in organic fertilizers, and potential in bioplastic production. Additionally, significant investments are being made in hydrolysis technology to enhance digestibility, particularly in aquaculture feed formulations across key regions.

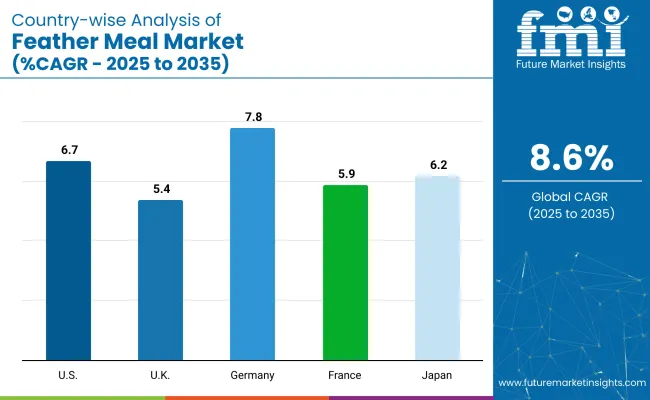
Germany is expected to record a CAGR of 7.8%, driven by strong adoption of organic fertilizers and circular economy initiatives in animal nutrition. The USA is forecasted to grow at a CAGR of 6.7% due to its technological advancements in hydrolysis rendering processes and robust domestic consumption in livestock and aquaculture feed markets.

Japan is projected to grow at a 6.2% CAGR, supported by strong demand from the aquaculture feed sector and increasing dependence on imported feather meal products. Chicken feathers are expected to lead the source segment with a 75% market share, while feed grade will lead the product grade segment with a 68% market share in 2025.

Government regulations mandating sustainable waste management and restricting landfill disposal of poultry by-products have been driving feather meal production globally. For instance, the European Union enforces strict animal by-product processing standards under Regulation (EC) No 1069/2009 to ensure safety in feed applications.

Recent innovations include advancements in hydrolysis technology to improve keratin digestibility, enabling feather meal to replace expensive fishmeal in aquaculture feeds effectively. Companies are investing in novel rendering processes that reduce environmental impacts while enhancing amino acid availability. Additionally, research into keratin-based bioplastics from feather meal is gaining traction, reflecting regulatory emphasis on sustainable material development.

The market holds a relatively small but significant share within its parent markets. It accounts for approximately 3% of the global animal feed market, driven by its use as an alternative high-protein ingredient. Within the animal nutrition market, it represents around 2% due to its niche application compared to soybean and fish meals. In the rendered products market, feather meal holds a larger share of approximately 12%, as it is a key output from poultry rendering processes. Its share in the organic fertilizer market remains under 1%, while in protein feed ingredients, it contributes close to 4% globally.

Analyzing Feather Meals Market by Top Investment Segments

The feather meal market is segmented by source, product type, grade, end use industry, distribution channel, and region. By source, the market is categorized into chicken, duck, turkey, and others such as goose and quail feathers. By product type, it is segmented into hydrolyzed feather meal, unprocessed feather meal, and processed feather meal.

By grade, it is classified into feed grade and fertilizer grade. Based on end use industry, the market is segmented into agriculture (commercial farming, organic farming), animal feed, aquaculture, and horticulture. By distribution channel, it is divided into direct sales and indirect sales (specialty stores, online stores, distributors/wholesalers). Regionally, the market is segmented into North America, Latin America, Western Europe, Eastern Europe, Balkans & Baltic, Russia & Belarus, Central Asia, East Asia, South Asia & Pacific, and Middle East & Africa.

Chicken to Lead the Source Segment with 75% Market Share in 2025

Chicken hold the most lucrative share in the market, accounting for approximately 75% of the market in 2025.
  • Duck feathers contribute a smaller share, mainly driven by their niche demand in East Asian markets where duck processing is common but still limited compared to chicken.
  • Turkey feathers hold an even smaller share globally, with production concentrated in North America and Europe where turkey processing facilities supply localized feather meal needs.

Hydrolyzed Feather Meal to Lead the Product Type Segment with 62% Market Share in 2025

Hydrolyzed feather meal dominates the product type segment, holding approximately 62% market share in 2025.

  • Unprocessed feather meal holds a smaller share due to its limited digestibility and lower nutritional value, leading to restricted use mainly in fertilizer applications rather than in feed.
  • Processed feather meal accounts for the remaining share as it undergoes basic rendering without hydrolysis, making it suitable for certain fertilizer and low-grade feed uses where cost considerations outweigh digestibility benefits.

Feed Grade to Lead the Grade Segment with 68% Market Share in 2025

Feed grade feather meal leads the grade segment, holding approximately 68% market share in 2025. Its dominance comes from the rising demand for high-protein and cost-effective feed ingredients in livestock, poultry, and aquaculture sectors globally.
  • Feed grade feather meal offers excellent amino acid availability and digestibility, making it a valuable substitute for traditional protein sources like fish meal and soybean meal.
  • Fertilizer grade feather meal holds the remaining share, driven by its use as an organic nitrogen-rich fertilizer in horticulture, commercial farming, and organic farming.

Animal Feed to Lead the End Use Industry Segment with 44.1% Market Share in 2025

Animal feed holds the largest share in the end use industry segment, accounting for approximately 44.1% market share in 2025.

  • Agriculture follows, with both commercial farming and organic farming utilizing feather meal as a nitrogen-rich fertilizer to improve soil fertility and crop yields.
  • Aquaculture also holds a significant share due to feather meal’s enhanced digestibility and amino acid profile, supporting fish and shrimp growth.

Direct Sales to Lead the Distribution Channel Segment with 54% Market Share in 2025

Direct sales lead the distribution channel segment, holding 54% market share in 2025.

  • Indirect sales hold the remaining share, driven by specialty stores catering to regional farming and gardening needs.
  • Among indirect sales, distributors and wholesalers contribute the largest portion, supported by their established networks in local agricultural and animal nutrition markets.

Top Feather Meals Market Dynamics

The global feather meal market is experiencing steady growth, driven by rising demand for sustainable high-protein animal feed ingredients, increasing adoption of hydrolyzed feather meal in aquaculture and livestock feed formulations, and rapid integration of advanced rendering technologies for enhanced digestibility and environmental sustainability.

Recent Trends in the Feather Meals Market

  • Manufacturers are investing in hydrolysis technology to improve feather meal digestibility for animal feed.
  • Adoption of feather meal in pet food formulations is increasing due to its high protein content.
  • Research on keratin-based bioplastics from feather meal is gaining traction for sustainable packaging solutions.
  • The market is witnessing greater promotion of feather meal as an organic fertilizer in horticulture and organic farming.

Challenges in the Feather Meals Market
  • Limited consumer awareness about feather meal applications in developing markets.
  • Strict regulatory standards for animal by-product processing and feed safety compliance.
  • High energy consumption and operational costs associated with hydrolysis rendering technology.
  • Fluctuating poultry processing output affecting feather availability and price stability.

Analyzing Top Countries Exporting and Supplying Feather Meals

Among the top five countries, Germany is projected to register the highest CAGR at 7.8%, driven by robust poultry processing and strong organic farming practices. The USA follows with a 6.7% CAGR, supported by advanced hydrolysis technology and strong feed demand. Japan’s market is expected to grow at 6.2% CAGR, driven by aquaculture feed demand and import reliance. France is projected to grow at 5.9% CAGR, supported by its poultry industry and organic fertilizer use. The UK shows the slowest growth among these, with a 5.4% CAGR, driven mainly by organic fertilizer demand and circular economy initiatives.

The report covers in-depth analysis of 40+ countries; five top-performing OECD countries are highlighted below.

USA Feather Meals Market Analysis

The feather meal demand in the USA is projected to grow at a CAGR of 6.7% from 2025 to 2035.

  • Growing adoption of hydrolyzed feather meal in livestock and aquaculture feeds.
  • Strong focus on sustainable poultry by-product utilization.
  • Rising pet food industry demand for cost-effective protein sources.
  • Major players like Darling Ingredients and Tyson Foods driving market leadership.

Feather Meals Demand Analysis in the UK

Sales of feather meals in the UK are projected to grow steadily at a CAGR of 5.4% from 2025 to 2035.

  • Growing demand for organic feather meal-based fertilizers.
  • Strict EU and UK standards driving safe animal by-product processing.
  • Expanding applications in horticulture and landscaping sectors.
  • Companies investing in regional processing and specialized feed formulations.

Germany Feather Meals Market Analysis

The Germany feather meal revenue is projected to grow at a CAGR of 7.8% from 2025 to 2035.

  • Strong demand for nitrogen-rich organic fertilizers in agriculture.
  • Expansion of hydrolyzed feather meal applications in animal feed.
  • High regulatory standards ensuring quality and safety compliance.
  • Leading distributors partnering with regional feed manufacturers.

France Feather Meals Market Analysis

Sales of feather meal in France are projected to grow at a CAGR of 5.9% from 2025 to 2035.

  • Rising use of feather meal as an organic soil amendment.
  • Expansion of aquaculture sector boosting feed demand.
  • Growing preference for hydrolyzed feather meal in pet foods.
  • Regional companies investing in advanced rendering technologies.

Feather Meals Demand Analysis in Japan

The feather meal revenue in Japan is projected to grow at a CAGR of 6.2% from 2025 to 2035.

  • High demand for hydrolyzed feather meal in aquaculture feed formulations.
  • Rising import of processed feather meal to meet domestic needs.
  • Strict quality and safety regulations shaping market standards.
  • Companies exploring bioplastic applications of keratin from feather meal.

Leading Feather Meal Suppliers and Manufacturers

The market is relatively consolidated, with a few tier-one companies holding major market shares due to their large-scale rendering operations and global feed distribution networks. Leading players such as Darling Ingredients, Tyson Foods, and JBS USA Holdings dominate through vertical integration and extensive rendering capacities.

Top companies primarily compete on pricing, technological innovation, and feed formulation partnerships. Darling Ingredients focuses on enhancing hydrolysis rendering processes to improve product digestibility and environmental sustainability. Tyson Foods invests in expanding its feather meal processing capacity to cater to the growing demand in livestock and aquaculture feed.

Recent Feather Meals Industry News

January 2024: Darling Ingredients acquired the Polish rendering company Miropasz Group. This acquisition added three poultry rendering plants in southeastern Poland that produce 250,000 metric tons of poultry byproducts annually.

Feather Meals Market Report Scope

Report Attributes Details
Current Total Market Size (2025) USD 619.1 million
Projected Market Size (2035) USD 1,396.7 million
CAGR (2025 to 2035) 8.6%
Base Year for Estimation 2024
Historical Period 2020 to 2024
Projections Period 2025 to 2035
Market Analysis Parameters Revenue in USD million/Volume in Metric Tons
By Source Chicken, Duck, Turkey, Others ( Goose Feathers, Quail Feathers, Guinea Fowl Feathers , Pheasant Feathers )
By Product Type Hydrolyzed Feather Meal, Unprocessed Feather Meal, Processed
By Grade Feed Grade, Fertilizer Grade
By End Use Industry Agriculture (Commercial Farming, Organic Farming), Animal Feed, Aquaculture, Horticulture
By Distribution Channel Direct Sales, Indirect Sales (Specialty Stores, Online Stores, Distributors/Wholesalers)
Regions Covered North America, Latin America, Western Europe, Eastern Europe, East Asia, South Asia & Pacific, Middle East & Africa
Countries Covered United States, Canada, United Kingdom, Germany, France, China, Japan, South Korea, Brazil, Australia
Key Players Valley Proteins, Inc., Darling Ingredients Inc., Tyson Foods, Inc., JBS USA Holdings, Inc., Pilgrim’s Pride Corporation, Sanimax , West Coast Reduction Ltd., Baker Commodities Inc., FASA Group, Nature's Intent, Farbest Foods, Inc., Ridley Corporation Limited, APC Inc. (Ag Processing Inc.), Perdue Farms Inc., Susheela Group, K-Pro USA, JG Pears, Kleingarn Agrarprodukte , Dave Mallin Products Ltd, LaBudde Group, Inc.
Additional Attributes Dollar sales by value, market share analysis by region, and country-wise analysis .

Segmentation

By Source:

Chicken, Duck, Turkey, Others (Goose Feathers, Quail Feathers, Guinea Fowl Feathers , Pheasant Feathers).

By Product Type:

Hydrolyzed Feather Meal, Unprocessed Feather Meal, Processed.

By Grade:

Feed Grade, Fertilizer Grade.

By End Use:

Industry Agriculture (Commercial Farming, Organic Farming), Animal Feed, Aquaculture, Horticulture.

By Distribution Channel:

Direct Sales, Indirect Sales (Specialty Stores, Online Stores, Distributors/Wholesalers).

By Regions:

Regions Covered North America, Latin America, Western Europe, Eastern Europe, East Asia, South Asia & Pacific, Middle East & Africa.

Table of Content

  1. Executive Summary
    • Global Market Outlook
    • Demand-side Trends
    • Supply-side Trends
    • Technology Roadmap Analysis
    • Analysis and Recommendations
  2. Market Overview
    • Market Coverage / Taxonomy
    • Market Definition / Scope / Limitations
  3. Market Background
    • Market Dynamics
      • Drivers
      • Restraints
      • Opportunity
      • Trends
    • Scenario Forecast
      • Demand in Optimistic Scenario
      • Demand in Likely Scenario
      • Demand in Conservative Scenario
    • Opportunity Map Analysis
    • Product Life Cycle Analysis
    • Supply Chain Analysis
      • Supply Side Participants and their Roles
        • Producers
        • Mid-Level Participants (Traders/ Agents/ Brokers)
        • Wholesalers and Distributors
      • Value Added and Value Created at Node in the Supply Chain
      • List of Raw Material Suppliers
      • List of Existing and Potential Buyer’s
    • Investment Feasibility Matrix
    • Value Chain Analysis
      • Profit Margin Analysis
      • Wholesalers and Distributors
      • Retailers
    • PESTLE and Porter’s Analysis
    • Regulatory Landscape
      • By Key Regions
      • By Key Countries
    • Regional Parent Market Outlook
    • Production and Consumption Statistics
    • Import and Export Statistics
  4. Global Market Analysis 2020 to 2024 and Forecast, 2025 to 2035
    • Historical Market Size Value (USD Million) & Volume (Metric Tons) Analysis, 2020 to 2024
    • Current and Future Market Size Value (USD Million) & Volume (Metric Tons) Projections, 2025 to 2035
      • Y-o-Y Growth Trend Analysis
      • Absolute $ Opportunity Analysis
  5. Global Market Pricing Analysis 2020 to 2024 and Forecast 2025 to 2035
  6. Global Market Analysis 2020 to 2024 and Forecast 2025 to 2035, By Source
    • Introduction / Key Findings
    • Historical Market Size Value (USD Million) & Volume (Metric Tons) Analysis By Source, 2020 to 2024
    • Current and Future Market Size Value (USD Million) & Volume (Metric Tons) Analysis and Forecast By Source, 2025 to 2035
      • Chicken
      • Duck
      • Turkey
      • Others
        • Goose Feathers
        • Quail Feathers
        • Guinea Fowl Feathers
        • Pheasant Feathers
    • Y-o-Y Growth Trend Analysis By Source, 2020 to 2024
    • Absolute $ Opportunity Analysis By Source, 2025 to 2035
  7. Global Market Analysis 2020 to 2024 and Forecast 2025 to 2035, By Product Type
    • Introduction / Key Findings
    • Historical Market Size Value (USD Million) & Volume (Metric Tons) Analysis By Product Type, 2020 to 2024
    • Current and Future Market Size Value (USD Million) & Volume (Metric Tons) Analysis and Forecast By Product Type, 2025 to 2035
      • Hydrolyzed Feather Meal
      • Unprocessed Feather Meal
      • Processed
    • Y-o-Y Growth Trend Analysis By Product Type, 2020 to 2024
    • Absolute $ Opportunity Analysis By Product Type, 2025 to 2035
  8. Global Market Analysis 2020 to 2024 and Forecast 2025 to 2035, By Grade
    • Introduction / Key Findings
    • Historical Market Size Value (USD Million) & Volume (Metric Tons) Analysis By Grade, 2020 to 2024
    • Current and Future Market Size Value (USD Million) & Volume (Metric Tons) Analysis and Forecast By Grade, 2025 to 2035
      • Feed Grade
      • Fertilizer Grade
    • Y-o-Y Growth Trend Analysis By Grade, 2020 to 2024
    • Absolute $ Opportunity Analysis By Grade, 2025 to 2035
  9. Global Market Analysis 2020 to 2024 and Forecast 2025 to 2035, By End Use Industry
    • Introduction / Key Findings
    • Historical Market Size Value (USD Million) & Volume (Metric Tons) Analysis By End Use Industry, 2020 to 2024
    • Current and Future Market Size Value (USD Million) & Volume (Metric Tons) Analysis and Forecast By End Use Industry, 2025 to 2035
      • Agriculture
        • Commercial Farming
        • Organic Farming
      • Animal Feed
      • Aquaculture
      • Horticulture
    • Y-o-Y Growth Trend Analysis By End Use Industry, 2020 to 2024
    • Absolute $ Opportunity Analysis By End Use Industry, 2025 to 2035
  10. Global Market Analysis 2020 to 2024 and Forecast 2025 to 2035, By Distribution Channel
    • Introduction / Key Findings
    • Historical Market Size Value (USD Million) & Volume (Metric Tons) Analysis By Distribution Channel, 2020 to 2024
    • Current and Future Market Size Value (USD Million) & Volume (Metric Tons) Analysis and Forecast By Distribution Channel, 2025 to 2035
      • Direct Sales
      • Indirect Sales
        • Specialty Stores
        • Online Stores
        • Distributors/Wholesalers
    • Y-o-Y Growth Trend Analysis By Distribution Channel, 2020 to 2024
    • Absolute $ Opportunity Analysis By Distribution Channel, 2025 to 2035
  11. Global Market Analysis 2020 to 2024 and Forecast 2025 to 2035, By Region
    • Introduction
    • Historical Market Size Value (USD Million) & Volume (Metric Tons) Analysis By Region, 2020 to 2024
    • Current Market Size Value (USD Million) & Volume (Metric Tons) Analysis and Forecast By Region, 2025 to 2035
      • USA
      • Latin America
      • Western Europe
      • Eastern Europe
      • East Asia
      • South Asia & Pacific
      • Middle East and Africa
    • Market Attractiveness Analysis By Region
  12. USA Market Analysis 2020 to 2024 and Forecast 2025 to 2035, By Country
    • Historical Market Size Value (USD Million) & Volume (Metric Tons) Trend Analysis By Market Taxonomy, 2020 to 2024
    • Market Size Value (USD Million) & Volume (Metric Tons) Forecast By Market Taxonomy, 2025 to 2035
      • By Country
        • Canada
        • Brazil
        • Mexico
        • Argentina
      • By Source
      • By Product Type
      • By Grade
      • By End Use Industry
      • By Distribution Channel
    • Market Attractiveness Analysis
      • By Country
      • By Source
      • By Product Type
      • By Grade
      • By End Use Industry
      • By Distribution Channel
    • Key Takeaways
  13. Latin America Market Analysis 2020 to 2024 and Forecast 2025 to 2035, By Country
    • Historical Market Size Value (USD Million) & Volume (Metric Tons) Trend Analysis By Market Taxonomy, 2020 to 2024
    • Market Size Value (USD Million) & Volume (Metric Tons) Forecast By Market Taxonomy, 2025 to 2035
      • By Country
        • Brazil
        • Argentina
        • Rest of LATAM
      • By Source
      • By Product Type
      • By Grade
      • By End Use Industry
      • By Distribution Channel
    • Market Attractiveness Analysis
      • By Country
      • By Source
      • By Product Type
      • By Grade
      • By End Use Industry
      • By Distribution Channel
    • Key Takeaways
  14. Western Europe Market Analysis 2020 to 2024 and Forecast 2025 to 2035, By Country
    • Historical Market Size Value (USD Million) & Volume (Metric Tons) Trend Analysis By Market Taxonomy, 2020 to 2024
    • Market Size Value (USD Million) & Volume (Metric Tons) Forecast By Market Taxonomy, 2025 to 2035
      • By Country
        • Germany
        • Italy
        • France
        • UK
        • Spain
        • BENELUX
        • Nordic
        • Rest of W.Europe
      • By Source
      • By Product Type
      • By Grade
      • By End Use Industry
      • By Distribution Channel
    • Market Attractiveness Analysis
      • By Country
      • By Source
      • By Product Type
      • By Grade
      • By End Use Industry
      • By Distribution Channel
    • Key Takeaways
  15. Eastern Europe Market Analysis 2020 to 2024 and Forecast 2025 to 2035, By Country
    • Historical Market Size Value (USD Million) & Volume (Metric Tons) Trend Analysis By Market Taxonomy, 2020 to 2024
    • Market Size Value (USD Million) & Volume (Metric Tons) Forecast By Market Taxonomy, 2025 to 2035
      • By Country
        • Russia
        • Hungary
        • Poland
        • Balkan & Baltics
        • Rest of E. Europe
      • By Source
      • By Product Type
      • By Grade
      • By End Use Industry
      • By Distribution Channel
    • Market Attractiveness Analysis
      • By Country
      • By Source
      • By Product Type
      • By Grade
      • By End Use Industry
      • By Distribution Channel
    • Key Takeaways
  16. East Asia Market Analysis 2020 to 2024 and Forecast 2025 to 2035, By Country
    • Historical Market Size Value (USD Million) & Volume (Metric Tons) Trend Analysis By Market Taxonomy, 2020 to 2024
    • Market Size Value (USD Million) & Volume (Metric Tons) Forecast By Market Taxonomy, 2025 to 2035
      • By Country
        • China
        • Japan
        • South Korea
      • By Source
      • By Product Type
      • By Grade
      • By End Use Industry
      • By Distribution Channel
    • Market Attractiveness Analysis
      • By Country
      • By Source
      • By Product Type
      • By Grade
      • By End Use Industry
      • By Distribution Channel
    • Key Takeaways
  17. South Asia & Pacific Market Analysis 2020 to 2024 and Forecast 2025 to 2035, By Country
    • Historical Market Size Value (USD Million) & Volume (Metric Tons) Trend Analysis By Market Taxonomy, 2020 to 2024
    • Market Size Value (USD Million) & Volume (Metric Tons) Forecast By Market Taxonomy, 2025 to 2035
      • By Country
        • India
        • Australia & New Zealand
        • ASEAN
        • Rest of SAP
      • By Source
      • By Product Type
      • By Grade
      • By End Use Industry
      • By Distribution Channel
    • Market Attractiveness Analysis
      • By Country
      • By Source
      • By Product Type
      • By Grade
      • By End Use Industry
      • By Distribution Channel
    • Key Takeaways
  18. Middle East and Africa Market Analysis 2020 to 2024 and Forecast 2025 to 2035, By Country
    • Historical Market Size Value (USD Million) & Volume (Metric Tons) Trend Analysis By Market Taxonomy, 2020 to 2024
    • Market Size Value (USD Million) & Volume (Metric Tons) Forecast By Market Taxonomy, 2025 to 2035
      • By Country
        • GCC Countries
        • Northern Africa
        • South Africa
        • Turkiye
        • Rest of MEA
      • By Source
      • By Product Type
      • By Grade
      • By End Use Industry
      • By Distribution Channel
    • Market Attractiveness Analysis
      • By Country
      • By Source
      • By Product Type
      • By Grade
      • By End Use Industry
      • By Distribution Channel
    • Key Takeaways
  19. Key Countries Market Analysis
    • USA
      • Pricing Analysis
      • Market Share Analysis, 2024
        • By Source
        • By Product Type
        • By Grade
        • By End Use Industry
        • By Distribution Channel
    • Canada
      • Pricing Analysis
      • Market Share Analysis, 2024
        • By Source
        • By Product Type
        • By Grade
        • By End Use Industry
        • By Distribution Channel
    • Brazil
      • Pricing Analysis
      • Market Share Analysis, 2024
        • By Source
        • By Product Type
        • By Grade
        • By End Use Industry
        • By Distribution Channel
    • Mexico
      • Pricing Analysis
      • Market Share Analysis, 2024
        • By Source
        • By Product Type
        • By Grade
        • By End Use Industry
        • By Distribution Channel
    • Argentina
      • Pricing Analysis
      • Market Share Analysis, 2024
        • By Source
        • By Product Type
        • By Grade
        • By End Use Industry
        • By Distribution Channel
  20. Market Structure Analysis
    • Competition Dashboard
    • Competition Benchmarking
    • Market Share Analysis of Top Players
      • By Regional
      • By Source
      • By Product Type
      • By Grade
      • By End Use Industry
      • By Distribution Channel
  21. Competition Analysis
    • Competition Deep Dive
      • Valley Proteins, Inc.
        • Overview
        • Product Portfolio
        • Profitability by Market Segments (Product/Age /Sales Channel/Region)
        • Sales Footprint
        • Strategy Overview
          • Marketing Strategy
          • Product Strategy
          • Channel Strategy
      • Darling Ingredients Inc.
        • Overview
        • Product Portfolio
        • Profitability by Market Segments (Product/Age /Sales Channel/Region)
        • Sales Footprint
        • Strategy Overview
          • Marketing Strategy
          • Product Strategy
          • Channel Strategy
      • Tyson Foods, Inc.
        • Overview
        • Product Portfolio
        • Profitability by Market Segments (Product/Age /Sales Channel/Region)
        • Sales Footprint
        • Strategy Overview
          • Marketing Strategy
          • Product Strategy
          • Channel Strategy
      • JBS USA Holdings, Inc.
        • Overview
        • Product Portfolio
        • Profitability by Market Segments (Product/Age /Sales Channel/Region)
        • Sales Footprint
        • Strategy Overview
          • Marketing Strategy
          • Product Strategy
          • Channel Strategy
      • Pilgrim’s Pride Corporation
        • Overview
        • Product Portfolio
        • Profitability by Market Segments (Product/Age /Sales Channel/Region)
        • Sales Footprint
        • Strategy Overview
          • Marketing Strategy
          • Product Strategy
          • Channel Strategy
      • Sanimax
        • Overview
        • Product Portfolio
        • Profitability by Market Segments (Product/Age /Sales Channel/Region)
        • Sales Footprint
        • Strategy Overview
          • Marketing Strategy
          • Product Strategy
          • Channel Strategy
      • West Coast Reduction Ltd.
        • Overview
        • Product Portfolio
        • Profitability by Market Segments (Product/Age /Sales Channel/Region)
        • Sales Footprint
        • Strategy Overview
          • Marketing Strategy
          • Product Strategy
          • Channel Strategy
      • Baker Commodities Inc.
        • Overview
        • Product Portfolio
        • Profitability by Market Segments (Product/Age /Sales Channel/Region)
        • Sales Footprint
        • Strategy Overview
          • Marketing Strategy
          • Product Strategy
          • Channel Strategy
      • 25.9. FASA Group
        • Overview
        • Product Portfolio
        • Profitability by Market Segments (Product/Age /Sales Channel/Region)
        • Sales Footprint
        • Strategy Overview
          • Marketing Strategy
          • Product Strategy
          • Channel Strategy
      • Nature's Intent
        • Overview
        • Product Portfolio
        • Profitability by Market Segments (Product/Age /Sales Channel/Region)
        • Sales Footprint
        • Strategy Overview
          • Marketing Strategy
          • Product Strategy
          • Channel Strategy
      • Farbest Foods, Inc.
        • Overview
        • Product Portfolio
        • Profitability by Market Segments (Product/Age /Sales Channel/Region)
        • Sales Footprint
        • Strategy Overview
          • Marketing Strategy
          • Product Strategy
          • Channel Strategy
      • Ridley Corporation Limited
        • Overview
        • Product Portfolio
        • Profitability by Market Segments (Product/Age /Sales Channel/Region)
        • Sales Footprint
        • Strategy Overview
          • Marketing Strategy
          • Product Strategy
          • Channel Strategy
      • APC Inc. (Ag Processing Inc.)
        • Overview
        • Product Portfolio
        • Profitability by Market Segments (Product/Age /Sales Channel/Region)
        • Sales Footprint
        • Strategy Overview
          • Marketing Strategy
          • Product Strategy
          • Channel Strategy
      • Perdue Farms Inc.
        • Overview
        • Product Portfolio
        • Profitability by Market Segments (Product/Age /Sales Channel/Region)
        • Sales Footprint
        • Strategy Overview
          • Marketing Strategy
          • Product Strategy
          • Channel Strategy
      • Susheela Group
        • Overview
        • Product Portfolio
        • Profitability by Market Segments (Product/Age /Sales Channel/Region)
        • Sales Footprint
        • Strategy Overview
          • Marketing Strategy
          • Product Strategy
          • Channel Strategy
      • K-Pro USA
        • Overview
        • Product Portfolio
        • Profitability by Market Segments (Product/Age /Sales Channel/Region)
        • Sales Footprint
        • Strategy Overview
          • Marketing Strategy
          • Product Strategy
          • Channel Strategy
      • JG Pears
        • Overview
        • Product Portfolio
        • Profitability by Market Segments (Product/Age /Sales Channel/Region)
        • Sales Footprint
        • Strategy Overview
          • Marketing Strategy
          • Product Strategy
          • Channel Strategy
      • Kleingarn Agrarprodukte
        • Overview
        • Product Portfolio
        • Profitability by Market Segments (Product/Age /Sales Channel/Region)
        • Sales Footprint
        • Strategy Overview
          • Marketing Strategy
          • Product Strategy
          • Channel Strategy
      • Dave Mallin Products Ltd
        • Overview
        • Product Portfolio
        • Profitability by Market Segments (Product/Age /Sales Channel/Region)
        • Sales Footprint
        • Strategy Overview
          • Marketing Strategy
          • Product Strategy
          • Channel Strategy
      • LaBudde Group, Inc.
        • Overview
        • Product Portfolio
        • Profitability by Market Segments (Product/Age /Sales Channel/Region)
        • Sales Footprint
        • Strategy Overview
          • Marketing Strategy
          • Product Strategy
          • Channel Strategy
  22. Assumptions & Acronyms Used
  23. Research Methodology

List of Tables

  • Table 1: Global Market Value (USD Million) Forecast by Region, 2020 to 2035
  • Table 2: Global Market Volume (Metric Tons) Forecast by Region, 2020 to 2035
  • Table 3: Global Market Value (USD Million) Forecast by Source, 2020 to 2035
  • Table 4: Global Market Volume (Metric Tons) Forecast by Source, 2020 to 2035
  • Table 5: Global Market Value (USD Million) Forecast by Product Type, 2020 to 2035
  • Table 6: Global Market Volume (Metric Tons) Forecast by Product Type, 2020 to 2035
  • Table 7: Global Market Value (USD Million) Forecast by Grade, 2020 to 2035
  • Table 8: Global Market Volume (Metric Tons) Forecast by Grade, 2020 to 2035
  • Table 9: Global Market Value (USD Million) Forecast by End Use Industry, 2020 to 2035
  • Table 10: Global Market Volume (Metric Tons) Forecast by End Use Industry, 2020 to 2035
  • Table 11: Global Market Value (USD Million) Forecast by Distribution Channel, 2020 to 2035
  • Table 12: Global Market Volume (Metric Tons) Forecast by Distribution Channel, 2020 to 2035
  • Table 13: U.S. Market Value (USD Million) Forecast by Country, 2020 to 2035
  • Table 14: U.S. Market Volume (Metric Tons) Forecast by Country, 2020 to 2035
  • Table 15: U.S. Market Value (USD Million) Forecast by Source, 2020 to 2035
  • Table 16: U.S. Market Volume (Metric Tons) Forecast by Source, 2020 to 2035
  • Table 17: U.S. Market Value (USD Million) Forecast by Product Type, 2020 to 2035
  • Table 18: U.S. Market Volume (Metric Tons) Forecast by Product Type, 2020 to 2035
  • Table 19: U.S. Market Value (USD Million) Forecast by Grade, 2020 to 2035
  • Table 20: U.S. Market Volume (Metric Tons) Forecast by Grade, 2020 to 2035
  • Table 21: U.S. Market Value (USD Million) Forecast by End Use Industry, 2020 to 2035
  • Table 22: U.S. Market Volume (Metric Tons) Forecast by End Use Industry, 2020 to 2035
  • Table 23: U.S. Market Value (USD Million) Forecast by Distribution Channel, 2020 to 2035
  • Table 24: U.S. Market Volume (Metric Tons) Forecast by Distribution Channel, 2020 to 2035
  • Table 25: Latin America Market Value (USD Million) Forecast by Country, 2020 to 2035
  • Table 26: Latin America Market Volume (Metric Tons) Forecast by Country, 2020 to 2035
  • Table 27: Latin America Market Value (USD Million) Forecast by Source, 2020 to 2035
  • Table 28: Latin America Market Volume (Metric Tons) Forecast by Source, 2020 to 2035
  • Table 29: Latin America Market Value (USD Million) Forecast by Product Type, 2020 to 2035
  • Table 30: Latin America Market Volume (Metric Tons) Forecast by Product Type, 2020 to 2035
  • Table 31: Latin America Market Value (USD Million) Forecast by Grade, 2020 to 2035
  • Table 32: Latin America Market Volume (Metric Tons) Forecast by Grade, 2020 to 2035
  • Table 33: Latin America Market Value (USD Million) Forecast by End Use Industry, 2020 to 2035
  • Table 34: Latin America Market Volume (Metric Tons) Forecast by End Use Industry, 2020 to 2035
  • Table 35: Latin America Market Value (USD Million) Forecast by Distribution Channel, 2020 to 2035
  • Table 36: Latin America Market Volume (Metric Tons) Forecast by Distribution Channel, 2020 to 2035
  • Table 37: Western Europe Market Value (USD Million) Forecast by Country, 2020 to 2035
  • Table 38: Western Europe Market Volume (Metric Tons) Forecast by Country, 2020 to 2035
  • Table 39: Western Europe Market Value (USD Million) Forecast by Source, 2020 to 2035
  • Table 40: Western Europe Market Volume (Metric Tons) Forecast by Source, 2020 to 2035
  • Table 41: Western Europe Market Value (USD Million) Forecast by Product Type, 2020 to 2035
  • Table 42: Western Europe Market Volume (Metric Tons) Forecast by Product Type, 2020 to 2035
  • Table 43: Western Europe Market Value (USD Million) Forecast by Grade, 2020 to 2035
  • Table 44: Western Europe Market Volume (Metric Tons) Forecast by Grade, 2020 to 2035
  • Table 45: Western Europe Market Value (USD Million) Forecast by End Use Industry, 2020 to 2035
  • Table 46: Western Europe Market Volume (Metric Tons) Forecast by End Use Industry, 2020 to 2035
  • Table 47: Western Europe Market Value (USD Million) Forecast by Distribution Channel, 2020 to 2035
  • Table 48: Western Europe Market Volume (Metric Tons) Forecast by Distribution Channel, 2020 to 2035
  • Table 49: Eastern Europe Market Value (USD Million) Forecast by Country, 2020 to 2035
  • Table 50: Eastern Europe Market Volume (Metric Tons) Forecast by Country, 2020 to 2035
  • Table 51: Eastern Europe Market Value (USD Million) Forecast by Source, 2020 to 2035
  • Table 52: Eastern Europe Market Volume (Metric Tons) Forecast by Source, 2020 to 2035
  • Table 53: Eastern Europe Market Value (USD Million) Forecast by Product Type, 2020 to 2035
  • Table 54: Eastern Europe Market Volume (Metric Tons) Forecast by Product Type, 2020 to 2035
  • Table 55: Eastern Europe Market Value (USD Million) Forecast by Grade, 2020 to 2035
  • Table 56: Eastern Europe Market Volume (Metric Tons) Forecast by Grade, 2020 to 2035
  • Table 57: Eastern Europe Market Value (USD Million) Forecast by End Use Industry, 2020 to 2035
  • Table 58: Eastern Europe Market Volume (Metric Tons) Forecast by End Use Industry, 2020 to 2035
  • Table 59: Eastern Europe Market Value (USD Million) Forecast by Distribution Channel, 2020 to 2035
  • Table 60: Eastern Europe Market Volume (Metric Tons) Forecast by Distribution Channel, 2020 to 2035
  • Table 61: East Asia Market Value (USD Million) Forecast by Country, 2020 to 2035
  • Table 62: East Asia Market Volume (Metric Tons) Forecast by Country, 2020 to 2035
  • Table 63: East Asia Market Value (USD Million) Forecast by Source, 2020 to 2035
  • Table 64: East Asia Market Volume (Metric Tons) Forecast by Source, 2020 to 2035
  • Table 65: East Asia Market Value (USD Million) Forecast by Product Type, 2020 to 2035
  • Table 66: East Asia Market Volume (Metric Tons) Forecast by Product Type, 2020 to 2035
  • Table 67: East Asia Market Value (USD Million) Forecast by Grade, 2020 to 2035
  • Table 68: East Asia Market Volume (Metric Tons) Forecast by Grade, 2020 to 2035
  • Table 69: East Asia Market Value (USD Million) Forecast by End Use Industry, 2020 to 2035
  • Table 70: East Asia Market Volume (Metric Tons) Forecast by End Use Industry, 2020 to 2035
  • Table 71: East Asia Market Value (USD Million) Forecast by Distribution Channel, 2020 to 2035
  • Table 72: East Asia Market Volume (Metric Tons) Forecast by Distribution Channel, 2020 to 2035
  • Table 73: South Asia & Pacific Market Value (USD Million) Forecast by Country, 2020 to 2035
  • Table 74: South Asia & Pacific Market Volume (Metric Tons) Forecast by Country, 2020 to 2035
  • Table 75: South Asia & Pacific Market Value (USD Million) Forecast by Source, 2020 to 2035
  • Table 76: South Asia & Pacific Market Volume (Metric Tons) Forecast by Source, 2020 to 2035
  • Table 77: South Asia & Pacific Market Value (USD Million) Forecast by Product Type, 2020 to 2035
  • Table 78: South Asia & Pacific Market Volume (Metric Tons) Forecast by Product Type, 2020 to 2035
  • Table 79: South Asia & Pacific Market Value (USD Million) Forecast by Grade, 2020 to 2035
  • Table 80: South Asia & Pacific Market Volume (Metric Tons) Forecast by Grade, 2020 to 2035
  • Table 81: South Asia & Pacific Market Value (USD Million) Forecast by End Use Industry, 2020 to 2035
  • Table 82: South Asia & Pacific Market Volume (Metric Tons) Forecast by End Use Industry, 2020 to 2035
  • Table 83: South Asia & Pacific Market Value (USD Million) Forecast by Distribution Channel, 2020 to 2035
  • Table 84: South Asia & Pacific Market Volume (Metric Tons) Forecast by Distribution Channel, 2020 to 2035
  • Table 85: Middle East and Africa Market Value (USD Million) Forecast by Country, 2020 to 2035
  • Table 86: Middle East and Africa Market Volume (Metric Tons) Forecast by Country, 2020 to 2035
  • Table 87: Middle East and Africa Market Value (USD Million) Forecast by Source, 2020 to 2035
  • Table 88: Middle East and Africa Market Volume (Metric Tons) Forecast by Source, 2020 to 2035
  • Table 89: Middle East and Africa Market Value (USD Million) Forecast by Product Type, 2020 to 2035
  • Table 90: Middle East and Africa Market Volume (Metric Tons) Forecast by Product Type, 2020 to 2035
  • Table 91: Middle East and Africa Market Value (USD Million) Forecast by Grade, 2020 to 2035
  • Table 92: Middle East and Africa Market Volume (Metric Tons) Forecast by Grade, 2020 to 2035
  • Table 93: Middle East and Africa Market Value (USD Million) Forecast by End Use Industry, 2020 to 2035
  • Table 94: Middle East and Africa Market Volume (Metric Tons) Forecast by End Use Industry, 2020 to 2035
  • Table 95: Middle East and Africa Market Value (USD Million) Forecast by Distribution Channel, 2020 to 2035
  • Table 96: Middle East and Africa Market Volume (Metric Tons) Forecast by Distribution Channel, 2020 to 2035

List of Figures

  • Figure 1: Global Market Volume (Metric Tons) Forecast 2020 to 2035
  • Figure 2: Global Market Pricing Analysis
  • Figure 3: Global Market Value (USD Million) Forecast 2020 to 2035
  • Figure 4: Global Market Value Share and BPS Analysis by Source, 2025 and 2035
  • Figure 5: Global Market Y-o-Y Growth Comparison by Source, 2025 to 2035
  • Figure 6: Global Market Attractiveness Analysis by Source
  • Figure 7: Global Market Value Share and BPS Analysis by Product Type, 2025 and 2035
  • Figure 8: Global Market Y-o-Y Growth Comparison by Product Type, 2025 to 2035
  • Figure 9: Global Market Attractiveness Analysis by Product Type
  • Figure 10: Global Market Value Share and BPS Analysis by Grade, 2025 and 2035
  • Figure 11: Global Market Y-o-Y Growth Comparison by Grade, 2025 to 2035
  • Figure 12: Global Market Attractiveness Analysis by Grade
  • Figure 13: Global Market Value Share and BPS Analysis by End Use Industry, 2025 and 2035
  • Figure 14: Global Market Y-o-Y Growth Comparison by End Use Industry, 2025 to 2035
  • Figure 15: Global Market Attractiveness Analysis by End Use Industry
  • Figure 16: Global Market Value Share and BPS Analysis by Distribution Channel, 2025 and 2035
  • Figure 17: Global Market Y-o-Y Growth Comparison by Distribution Channel, 2025 to 2035
  • Figure 18: Global Market Attractiveness Analysis by Distribution Channel
  • Figure 19: Global Market Value (USD Million) Share and BPS Analysis by Region, 2025 and 2035
  • Figure 20: Global Market Y-o-Y Growth Comparison by Region, 2025 to 2035
  • Figure 21: Global Market Attractiveness Analysis by Region
  • Figure 22: USA Market Incremental $ Opportunity, 2025 to 2035
  • Figure 23: Latin America Market Incremental $ Opportunity, 2025 to 2035
  • Figure 24: Western Europe Market Incremental $ Opportunity, 2025 to 2035
  • Figure 25: Eastern Europe Market Incremental $ Opportunity, 2025 to 2035
  • Figure 26: East Asia Market Incremental $ Opportunity, 2025 to 2035
  • Figure 27: South Asia & Pacific Market Incremental $ Opportunity, 2025 to 2035
  • Figure 28: Middle East and Africa Market Incremental $ Opportunity, 2025 to 2035
  • Figure 29: USA Market Value Share and BPS Analysis by Country, 2025 and 2035
  • Figure 30: USA Market Value Share and BPS Analysis by Source, 2025 and 2035
  • Figure 31: USA Market Y-o-Y Growth Comparison by Source, 2025 to 2035
  • Figure 32: USA Market Attractiveness Analysis by Source
  • Figure 33: USA Market Value Share and BPS Analysis by Product Type, 2025 and 2035
  • Figure 34: USA Market Y-o-Y Growth Comparison by Product Type, 2025 to 2035
  • Figure 35: USA Market Attractiveness Analysis by Product Type
  • Figure 36: USA Market Value Share and BPS Analysis by Grade, 2025 and 2035
  • Figure 37: USA Market Y-o-Y Growth Comparison by Grade, 2025 to 2035
  • Figure 38: USA Market Attractiveness Analysis by Grade
  • Figure 39: USA Market Value Share and BPS Analysis by End Use Industry, 2025 and 2035
  • Figure 40: USA Market Y-o-Y Growth Comparison by End Use Industry, 2025 to 2035
  • Figure 41: USA Market Attractiveness Analysis by End Use Industry
  • Figure 42: USA Market Value Share and BPS Analysis by Distribution Channel, 2025 and 2035
  • Figure 43: USA Market Y-o-Y Growth Comparison by Distribution Channel, 2025 to 2035
  • Figure 44: USA Market Attractiveness Analysis by Distribution Channel
  • Figure 45: Latin America Market Value Share and BPS Analysis by Country, 2025 and 2035
  • Figure 46: Latin America Market Value Share and BPS Analysis by Source, 2025 and 2035
  • Figure 47: Latin America Market Y-o-Y Growth Comparison by Source, 2025 to 2035
  • Figure 48: Latin America Market Attractiveness Analysis by Source
  • Figure 49: Latin America Market Value Share and BPS Analysis by Product Type, 2025 and 2035
  • Figure 50: Latin America Market Y-o-Y Growth Comparison by Product Type, 2025 to 2035
  • Figure 51: Latin America Market Attractiveness Analysis by Product Type
  • Figure 52: Latin America Market Value Share and BPS Analysis by Grade, 2025 and 2035
  • Figure 53: Latin America Market Y-o-Y Growth Comparison by Grade, 2025 to 2035
  • Figure 54: Latin America Market Attractiveness Analysis by Grade
  • Figure 55: Latin America Market Value Share and BPS Analysis by End Use Industry, 2025 and 2035
  • Figure 56: Latin America Market Y-o-Y Growth Comparison by End Use Industry, 2025 to 2035
  • Figure 57: Latin America Market Attractiveness Analysis by End Use Industry
  • Figure 58: Latin America Market Value Share and BPS Analysis by Distribution Channel, 2025 and 2035
  • Figure 59: Latin America Market Y-o-Y Growth Comparison by Distribution Channel, 2025 to 2035
  • Figure 60: Latin America Market Attractiveness Analysis by Distribution Channel
  • Figure 61: Western Europe Market Value Share and BPS Analysis by Country, 2025 and 2035
  • Figure 62: Western Europe Market Value Share and BPS Analysis by Source, 2025 and 2035
  • Figure 63: Western Europe Market Y-o-Y Growth Comparison by Source, 2025 to 2035
  • Figure 64: Western Europe Market Attractiveness Analysis by Source
  • Figure 65: Western Europe Market Value Share and BPS Analysis by Product Type, 2025 and 2035
  • Figure 66: Western Europe Market Y-o-Y Growth Comparison by Product Type, 2025 to 2035
  • Figure 67: Western Europe Market Attractiveness Analysis by Product Type
  • Figure 68: Western Europe Market Value Share and BPS Analysis by Grade, 2025 and 2035
  • Figure 69: Western Europe Market Y-o-Y Growth Comparison by Grade, 2025 to 2035
  • Figure 70: Western Europe Market Attractiveness Analysis by Grade
  • Figure 71: Western Europe Market Value Share and BPS Analysis by End Use Industry, 2025 and 2035
  • Figure 72: Western Europe Market Y-o-Y Growth Comparison by End Use Industry, 2025 to 2035
  • Figure 73: Western Europe Market Attractiveness Analysis by End Use Industry
  • Figure 74: Western Europe Market Value Share and BPS Analysis by Distribution Channel, 2025 and 2035
  • Figure 75: Western Europe Market Y-o-Y Growth Comparison by Distribution Channel, 2025 to 2035
  • Figure 76: Western Europe Market Attractiveness Analysis by Distribution Channel
  • Figure 77: Eastern Europe Market Value Share and BPS Analysis by Country, 2025 and 2035
  • Figure 78: Eastern Europe Market Value Share and BPS Analysis by Source, 2025 and 2035
  • Figure 79: Eastern Europe Market Y-o-Y Growth Comparison by Source, 2025 to 2035
  • Figure 80: Eastern Europe Market Attractiveness Analysis by Source
  • Figure 81: Eastern Europe Market Value Share and BPS Analysis by Product Type, 2025 and 2035
  • Figure 82: Eastern Europe Market Y-o-Y Growth Comparison by Product Type, 2025 to 2035
  • Figure 83: Eastern Europe Market Attractiveness Analysis by Product Type
  • Figure 84: Eastern Europe Market Value Share and BPS Analysis by Grade, 2025 and 2035
  • Figure 85: Eastern Europe Market Y-o-Y Growth Comparison by Grade, 2025 to 2035
  • Figure 86: Eastern Europe Market Attractiveness Analysis by Grade
  • Figure 87: Eastern Europe Market Value Share and BPS Analysis by End Use Industry, 2025 and 2035
  • Figure 88: Eastern Europe Market Y-o-Y Growth Comparison by End Use Industry, 2025 to 2035
  • Figure 89: Eastern Europe Market Attractiveness Analysis by End Use Industry
  • Figure 90: Eastern Europe Market Value Share and BPS Analysis by Distribution Channel, 2025 and 2035
  • Figure 91: Eastern Europe Market Y-o-Y Growth Comparison by Distribution Channel, 2025 to 2035
  • Figure 92: Eastern Europe Market Attractiveness Analysis by Distribution Channel
  • Figure 93: East Asia Market Value Share and BPS Analysis by Country, 2025 and 2035
  • Figure 94: East Asia Market Value Share and BPS Analysis by Source, 2025 and 2035
  • Figure 95: East Asia Market Y-o-Y Growth Comparison by Source, 2025 to 2035
  • Figure 96: East Asia Market Attractiveness Analysis by Source
  • Figure 97: East Asia Market Value Share and BPS Analysis by Product Type, 2025 and 2035
  • Figure 98: East Asia Market Y-o-Y Growth Comparison by Product Type, 2025 to 2035
  • Figure 99: East Asia Market Attractiveness Analysis by Product Type
  • Figure 100: East Asia Market Value Share and BPS Analysis by Grade, 2025 and 2035
  • Figure 101: East Asia Market Y-o-Y Growth Comparison by Grade, 2025 to 2035
  • Figure 102: East Asia Market Attractiveness Analysis by Grade
  • Figure 103: East Asia Market Value Share and BPS Analysis by End Use Industry, 2025 and 2035
  • Figure 104: East Asia Market Y-o-Y Growth Comparison by End Use Industry, 2025 to 2035
  • Figure 105: East Asia Market Attractiveness Analysis by End Use Industry
  • Figure 106: East Asia Market Value Share and BPS Analysis by Distribution Channel, 2025 and 2035
  • Figure 107: East Asia Market Y-o-Y Growth Comparison by Distribution Channel, 2025 to 2035
  • Figure 108: East Asia Market Attractiveness Analysis by Distribution Channel
  • Figure 109: South Asia & Pacific Market Value Share and BPS Analysis by Country, 2025 and 2035
  • Figure 110: South Asia & Pacific Market Value Share and BPS Analysis by Source, 2025 and 2035
  • Figure 111: South Asia & Pacific Market Y-o-Y Growth Comparison by Source, 2025 to 2035
  • Figure 112: South Asia & Pacific Market Attractiveness Analysis by Source
  • Figure 113: South Asia & Pacific Market Value Share and BPS Analysis by Product Type, 2025 and 2035
  • Figure 114: South Asia & Pacific Market Y-o-Y Growth Comparison by Product Type, 2025 to 2035
  • Figure 115: South Asia & Pacific Market Attractiveness Analysis by Product Type
  • Figure 116: South Asia & Pacific Market Value Share and BPS Analysis by Grade, 2025 and 2035
  • Figure 117: South Asia & Pacific Market Y-o-Y Growth Comparison by Grade, 2025 to 2035
  • Figure 118: South Asia & Pacific Market Attractiveness Analysis by Grade
  • Figure 119: South Asia & Pacific Market Value Share and BPS Analysis by End Use Industry, 2025 and 2035
  • Figure 120: South Asia & Pacific Market Y-o-Y Growth Comparison by End Use Industry, 2025 to 2035
  • Figure 121: South Asia & Pacific Market Attractiveness Analysis by End Use Industry
  • Figure 122: South Asia & Pacific Market Value Share and BPS Analysis by Distribution Channel, 2025 and 2035
  • Figure 123: South Asia & Pacific Market Y-o-Y Growth Comparison by Distribution Channel, 2025 to 2035
  • Figure 124: South Asia & Pacific Market Attractiveness Analysis by Distribution Channel
  • Figure 125: Middle East and Africa Market Value Share and BPS Analysis by Country, 2025 and 2035
  • Figure 126: Middle East and Africa Market Value Share and BPS Analysis by Source, 2025 and 2035
  • Figure 127: Middle East and Africa Market Y-o-Y Growth Comparison by Source, 2025 to 2035
  • Figure 128: Middle East and Africa Market Attractiveness Analysis by Source
  • Figure 129: Middle East and Africa Market Value Share and BPS Analysis by Product Type, 2025 and 2035
  • Figure 130: Middle East and Africa Market Y-o-Y Growth Comparison by Product Type, 2025 to 2035
  • Figure 131: Middle East and Africa Market Attractiveness Analysis by Product Type
  • Figure 132: Middle East and Africa Market Value Share and BPS Analysis by Grade, 2025 and 2035
  • Figure 133: Middle East and Africa Market Y-o-Y Growth Comparison by Grade, 2025 to 2035
  • Figure 134: Middle East and Africa Market Attractiveness Analysis by Grade
  • Figure 135: Middle East and Africa Market Value Share and BPS Analysis by End Use Industry, 2025 and 2035
  • Figure 136: Middle East and Africa Market Y-o-Y Growth Comparison by End Use Industry, 2025 to 2035
  • Figure 137: Middle East and Africa Market Attractiveness Analysis by End Use Industry
  • Figure 138: Middle East and Africa Market Value Share and BPS Analysis by Distribution Channel, 2025 and 2035
  • Figure 139: Middle East and Africa Market Y-o-Y Growth Comparison by Distribution Channel, 2025 to 2035
  • Figure 140: Middle East and Africa Market Attractiveness Analysis by Distribution Channel
  • Figure 141: Global Market - Tier Structure Analysis
  • Figure 142: Global Market - Company Share Analysis

Frequently Asked Questions

What is the projected size of feather meal market in 2025?

The market is valued at USD 619.1 million in 2025.

What is the CAGR of the feather meal market from 2025 to 2035?

The market is expected to grow at a CAGR of 8.6% during 2025 to 2035.

What is the projected value of feather meal market by 2035?

The market is projected to reach a value of USD 1,396.7 million by 2035.

Which source segment holds the largest share in feather meal market?

Chicken feathers hold the largest market share among sources in 2025, accounting for approximately 75% of the market.

Which product type leads the feather meal market?

Hydrolyzed feather meal is the leading product type in 2025, holding 62% market share due to its high digestibility.

Explore Similar Insights

Future Market Insights

Feather Meal Market