Fertilizer Bags Market Size, Share & Forecast 2025 to 2035

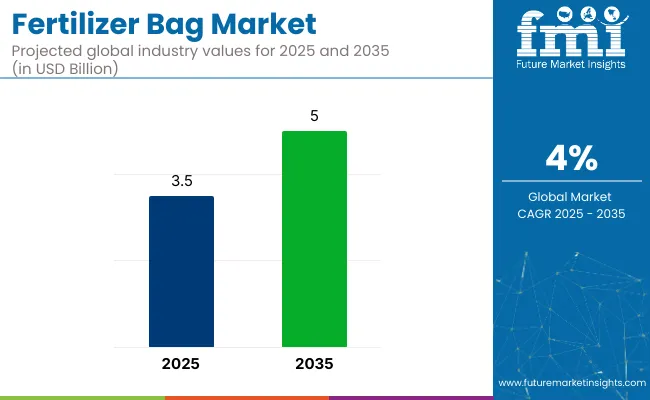
The global fertilizer bags market is projected to grow from USD 3.5 billion in 2025 to USD 5.0 billion by 2035, registering a CAGR of 4% during the forecast period. This growth is primarily attributed to the increasing demand for fertilizers to boost agricultural productivity worldwide.
Quick Stats of Fertilizer Bag Market

  • Market Value (2025): USD 3.5 billion
  • Forecast Value (2035): USD 5.0 billion
  • Forecast CAGR: 4%
  • Material Type Leader in 2025: Polypropylene (PP) (52.6% market share)
  • Top Application: Chemical fertilizers (58.3% share)
  • Key Growth Country: Asia Pacific (India to record CAGR of 5.9%)

Fertilizer Bags Market

Metric Value
Estimated Size (2025E) USD 3.5 billion
Projected Value (2035F) USD 5.0 billion
CAGR (2025 to 2035) 4%

Fertilizer bags play a crucial role in ensuring safe storage, transportation, and handling of fertilizers while maintaining product quality and minimizing waste. The market's expansion is further driven by the growing emphasis on sustainable and recyclable materials, as well as advancements in packaging technologies that improve strength and protection.

In 2022, Mondi Group, a global leader in packaging and paper, announced an investment of nearly €65 million to expand its Consumer Flexibles packaging plants in Europe. This investment aims to meet the growing demand for sustainable pet food packaging solutions, including the production of pre-made retort stand-up pouches. The expansion includes upgrades to facilities in Austria and Germany, enhancing production capacity and supporting customers’ goals.

Recent innovations in the fertilizer bag market have centered around enhancing sustainability, functionality, and adaptability to diverse applications. Manufacturers are increasingly adopting biodegradable and recyclable materials, such as bio-based polymers, to produce eco-friendly fertilizer bags that align with stringent environmental regulations and cater to the growing consumer demand for sustainable packaging solutions.

Advancements in coating technologies have led to the development of bags with improved moisture resistance, UV protection, and anti-slip properties, ensuring better performance in various environmental conditions. Additionally, the integration of smart technologies, including RFID tags and sensor-embedded bags, is enabling better inventory management, product tracking, and real-time monitoring of environmental conditions, aligning with the growing trend of smart packaging and logistics.

The fertilizer bag market is expected to witness significant growth in emerging economies, particularly in the Asia-Pacific region, driven by rapid industrialization, urbanization, and infrastructural development. Countries like China, India, and Indonesia are experiencing a surge in demand for durable and sustainable materials in construction, agriculture, and packaging sectors.

The expansion of the e-commerce industry and the increasing need for efficient logistics and protective packaging solutions further propel the market's growth in these regions. Manufacturers are anticipated to focus on developing cost-effective, sustainable, and customizable fertilizer bag solutions to cater to diverse industry needs and comply with evolving regulatory standards. Strategic collaborations, technological advancements, and investments in local production facilities are likely to play a crucial role in capturing market share and driving growth in these regions.

Analyzing Fertilizer Bag Market by Top Investment Segment

The market has been segmented based on material, size, closure type, application, and region. By material, polyethylene (PE), polypropylene (PP), jute, paper, and non-woven fabric are utilized to balance cost-efficiency, moisture protection, breathability, and environmental sustainability in agricultural packaging.

Size segmentation includes less than 10 kg, 10-25 kg, 25-50 kg, 50-100 kg, and more than 100 kg, addressing packaging needs across small-scale farming, retail fertilizer distribution, and bulk industrial supply. Closure types include drawstring, plastic tie, wire tie, sewn closure, and glued closure-each supporting secure sealing, reusability, or tamper resistance.

Application areas include chemical fertilizers, organic fertilizers, seed treatment, and agrochemicals, reflecting the sector’s need for both barrier functionality and compatibility with varied material formulations. Regional segmentation spans North America, Europe, Latin America, Asia Pacific, and the Middle East and Africa, capturing shifts in agricultural intensity, packaging regulation, and fertilizer consumption patterns.
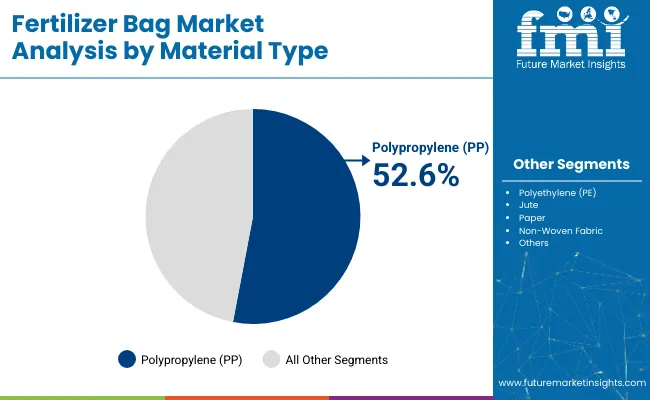
Polypropylene (PP) Segment Gains Traction Due to High Strength, Moisture Resistance, and Cost-Efficiency

Fertilizer Bags Market Analysis By Material Type

The polypropylene (PP) segment is expected to dominate the material category with a 52.6% share in the fertilizer bag market by 2025, driven by its exceptional mechanical strength, chemical resistance, and adaptability to heavy-duty agricultural use. PP bags-especially woven and laminated variants-are widely used for packaging fertilizers due to their ability to endure rough handling, prolonged storage, and varied climatic conditions.

Woven PP bags offer excellent tensile strength, lightweight properties, and breathability, while laminated PP bags provide enhanced moisture and UV protection-essential for maintaining fertilizer integrity during transit and warehouse storage. Moreover, PP bags are easily printable, allowing manufacturers to brand packaging while complying with regulatory labeling norms regarding nutrient content and safety handling instructions.

The cost-efficiency and recyclability of polypropylene also contribute to its dominance. Many producers are now investing in circular packaging models, introducing PP bags made from post-industrial and post-consumer recycled content to meet sustainability goals. As agricultural output expands across emerging economies and global fertilizer demand rises, PP bags are expected to remain the material of choice, particularly in bulk and export applications.
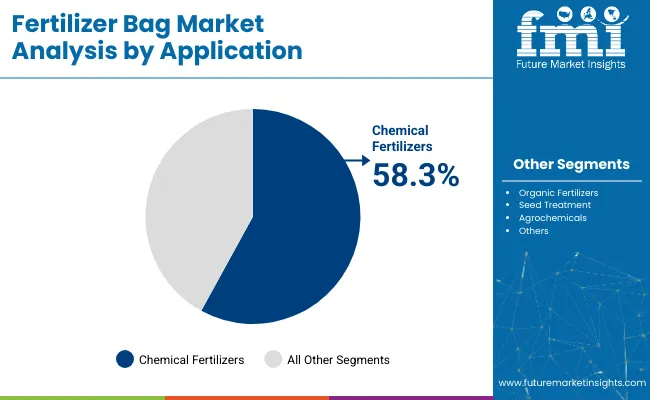
Chemical Fertilizers Segment to Lead Application Category with Amid Large-Scale Crop Production Demand

Fertilizer Bags Market Analysis By Application

The chemical fertilizers segment is projected to account for the largest share of 58.3% in the fertilizer bag market by 2025, primarily driven by global demand for nitrogenous, phosphatic, and potassic fertilizers in high-yield crop production. These fertilizers are typically packed in 10-50 kg PP or laminated kraft bags to ensure durability, safe handling, and product stability throughout distribution.

The dominance of this segment is underpinned by the intensification of agriculture to feed growing populations, especially in Asia-Pacific, Latin America, and Sub-Saharan Africa. Fertilizer manufacturers and distributors require packaging that prevents caking, resists puncture, and allows stackability features that scrim-reinforced or laminated chemical fertilizer bags offer effectively.

Moreover, strict labeling and safety regulations concerning chemical fertilizer handling have increased the adoption of multi-layer bags with anti-counterfeit features, batch traceability, and enhanced UV resistance. As climate-resilient farming practices and mechanized fertilizer distribution systems expand, packaging formats are evolving toward high-barrier, easy-to-handle bags that optimize shelf life and minimize material loss. Given the continued dominance of chemical fertilizers in global agriculture, this segment will drive volume growth and innovation in bag manufacturing, especially in high-capacity SKUs and region-specific climate-adaptive formats.

Challenges and Opportunities

Challenge

Environmental Concerns and Regulatory Compliance

Stringent regulations on single-use plastics and increasing environmental awareness regarding plastic waste threaten the growth of the fertilizer bags market. Polypropylene and polyethylene are the two main constituent elements of normal fertilizer bags, which are a source of non-biodegradable waste and the cause of pollution, resulting in further scrutiny from local government authorities.

Governments around the world implement stringent packaging waste management legislation that mandates manufacturers to transition to recyclable, biodegradable, or reusable materials. But designing economically viable, environmentally friendly replacements that do not sacrifice longevity and anti-dampness is still a huge challenge for the sector.

Opportunity

Demand for Sustainable and High-Performance Packaging Solutions

Growing focus on sustainable agriculture and environmentally-friendly packaging represents a major growth opportunity of the fertilizer bags market. However, companies are developing biodegradable, compostable, and recyclable packaging solutions to meet regulatory standards and consumer demand.

Aesthetic enhancement comes with economic sustainability, multi-layer barrier film, water-resistant coating, and UV-stabilized bags all contribute to making bags economically viable but they also have to keep environmental sustainability in mind during development. Virtual incorporation and QR codes and smart packaging and use of 3D printing are intended to improve product observability and branding, driving improvements in the agro-industry.
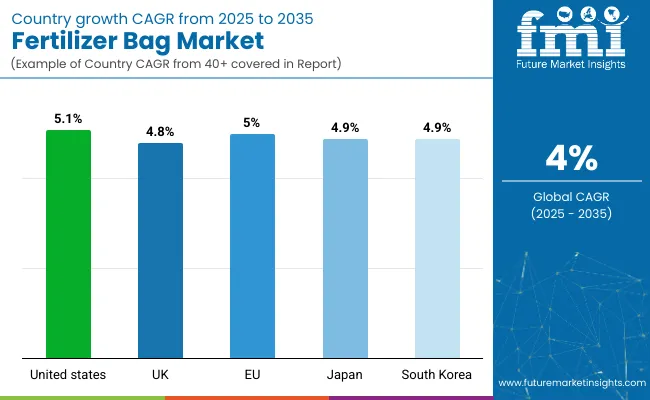
Country-Wise Outlook

Fertilizer Bags Market Country Wise Analysis

United States

The USA fertilizer bags market is anticipated to grow at a significant rate during the forecast period due to the growth of the agriculture sector, rising demand for fertilizers, and innovations in eco-friendly packaging technology. So, requirements for durable, moisture resistant and eco-friendly fertilizer bags are increasing with the rise in precision farming and large-scale agricultural production.

Government initiatives aimed at sustainable packaging solutions have prompted manufacturers to produce biodegradable and recyclable fertilizer bags. Furthermore, the increasing utilization of bulk and flexible intermediate bulk containers (FIBCs) for large-scale fertilizer transport is also strongly propelling market growth. The long-term market growth is being ensured by the presence of some of the leading agrochemical companies as well as growing investments in advanced polymer based packaging.

Country CAGR (2025 to 2035)
USA 5.1%

United Kingdom

This expansion is being driven by agricultural modernization, sustainability regulation, as well as a growing demand for high-strength packaging solutions. Fertilizer packaging made of biodegradable and recyclable materials is being promoted by the UK government to cut plastic waste.

The increasing trend towards organic farming and precision agriculture has led to usage of customized, multi-layered and UV-resistant fertilizer bags that extend the shelf-life of the product, which is further bolstering the demand for fertilizer bags. Further, rising agrochemical distribution channels and increasing online agricultural supply chains also create potential demand avenue for lightweight yet durable fertilizer packaging solutions.

Country CAGR (2025 to 2035)
UK 4.8%

European Union

The European Union fertilizers bags market is growing steadily, owing to sustainability-cantered agricultural policies, growing consumption of fertilizers, and innovations in packaging materials. The European sustainable and recyclable fertilizer packaging market is currently being led by countries, including Germany, France and the Netherlands, offering new investments in sustainable and recyclable solutions.

European Union (EU) regulations to reduce plastic packaging waste are forcing manufacturers to use bio-based and compostable packaging alternatives. The increasing demand for bulk packaging solutions in commercial agriculture is also one of the factors fuelling the adoption of woven polypropylene (PP) bags and the FIBCs.

The same factor has increased demand for moisture-resistant and anti-leak fertilizer bags, as precision farming techniques proliferate and controlled-release fertilizers (CRFs) have become increasingly widespread.

Region CAGR (2025 to 2035)
European Union 5.0%

Japan

The companies in Japan are steadily adopting the use of fertilizer bags owing to the advancements in agricultural packaging technology, increasing demand for specialty fertilizers as well as rigorous sustainability initiatives. The country has very little arable land and the plants grown using controlled-environment farming methods, and therefore, there is a growing need for high-barrier, long-lasting fertilizer packaging solutions.

All of this translates to enhanced supply chain efficiency for fertilizers, aided by smart packaging solutions like QR-coded and RFID-enabled bags for traceability. In fact, Japan’s push to reduce plastic waste is aiding the development of biodegradable and reusable fertilizer packaging materials. Moreover, the need for lightweight, durable bags for liquid and granular fertilizers is further stimulating the growth of the market.

Country CAGR (2025 to 2035)
Japan 4.9%

South Korea

The South Korea fertilizer bags market is driven by growing agricultural mechanization, the increasing need for high strength packaging products, and the trend towards eco-friendly fertilisers. Commercialization of low-waste and recyclable fertilizer packaging solutions has been envisaged with a view to achieving sustainable development goals set by the government.

Blue and Green in top-down view cropped image with close-up some Japanese horticulture business tried to use smart and tamper-proof packaging to store and transport the fertilizer. Furthermore, the expansion of urban and vertical farming is contributing to the demand for small and medium-sized fertilizer bags providing high moisture resistance. The increase in agricultural product exports is also driving up the demand for bulk and high-durability fertilizer packaging solutions, further fuelling market growth.

Country CAGR (2025 to 2035)
South Korea 4.9%

Competitive Outlook

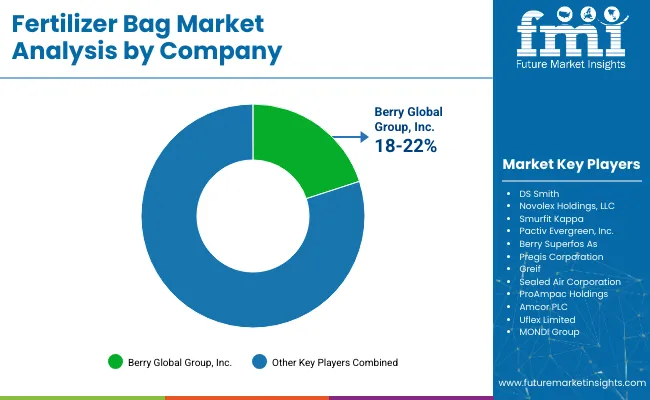
Fertilizer Bags Market Analysis By Comapnay

The fertilizer bags market is a competitive market which is also functionality driven due to the rising demand for strong, cost-efficient and eco-friendly packaging systems for fertilizers. These bags are made in such a way that they prevent moisture absorption and contamination thus ensuring safe storage, transport, and handling of fertilizers.

Prominent manufacturers concentrate on high-key barrier packing components, biodegradable substitutes, and improved durability to meet the needs of agriculture and industry. The competition within the market encompasses global packaging corporations, specialized polymer producers, as well as regional vendors providing tailor-made offerings.

Key Companies

  • DS Smith
  • Novolex Holdings, LLC
  • Smurfit Kappa
  • Berry Global Group, Inc.
  • Pactiv Evergreen, Inc.
  • Berry Superfos As
  • Pregis Corporation
  • Greif
  • Sealed Air Corporation
  • ProAmpac Holdings
  • Amcor PLC
  • Uflex Limited
  • MONDI Group

Fertilizer Bags Market Segmentation

By Material:

  • Polyethylene (PE)
  • Polypropylene (PP)
  • Jute
  • Paper
  • Non-Woven Fabric

By Size:

  • Less than 10 kg
  • 10-25 kg
  • 25-50 kg
  • 50-100 kg
  • More than 100 kg

By Closure Type:

  • Drawstring
  • Plastic Tie
  • Wire Tie
  • Sewn Closure
  • Glued Closure

By Application:

  • Chemical Fertilizers
  • Organic Fertilizers
  • Seed Treatment
  • Agrochemicals

By Regional:

  • North America
  • Europe
  • Latin America
  • Asia Pacific
  • Middle East and Africa

Table of Content

  1. Executive Summary
    • Global Market Outlook
    • Demand-side Trends
    • Supply-side Trends
    • Technology Roadmap Analysis
    • Analysis and Recommendations
  2. Market Overview
    • Market Coverage / Taxonomy
    • Market Definition / Scope / Limitations
  3. Market Background
    • Market Dynamics
      • Drivers
      • Restraints
      • Opportunity
      • Trends
    • Scenario Forecast
      • Demand in Optimistic Scenario
      • Demand in Likely Scenario
      • Demand in Conservative Scenario
    • Opportunity Map Analysis
    • Product Life Cycle Analysis
    • Supply Chain Analysis
      • Supply Side Participants and their Roles
        • Producers
        • Mid-Level Participants (Traders/ Agents/ Brokers)
        • Wholesalers and Distributors
      • Value Added and Value Created at Node in the Supply Chain
      • List of Raw Material Suppliers
      • List of Existing and Potential Buyer’s
    • Investment Feasibility Matrix
    • Value Chain Analysis
      • Profit Margin Analysis
      • Wholesalers and Distributors
      • Retailers
    • PESTLE and Porter’s Analysis
    • Regulatory Landscape
      • By Key Regions
      • By Key Countries
    • Regional Parent Market Outlook
    • Production and Consumption Statistics
    • Import and Export Statistics
  4. Global Market Analysis 2020 to 2024 and Forecast, 2025 to 2035
    • Historical Market Size Value (USD Million) & Volume (Units) Analysis, 2020 to 2024
    • Current and Future Market Size Value (USD Million) & Volume (Units) Projections, 2025 to 2035
      • Y-o-Y Growth Trend Analysis
      • Absolute $ Opportunity Analysis
  5. Global Market Pricing Analysis 2020 to 2024 and Forecast 2025 to 2035
  6. Global Market Analysis 2020 to 2024 and Forecast 2025 to 2035, By Material
    • Introduction / Key Findings
    • Historical Market Size Value (USD Million) & Volume (Units) Analysis By Material, 2020 to 2024
    • Current and Future Market Size Value (USD Million) & Volume (Units) Analysis and Forecast By Material, 2025 to 2035
      • Polyethylene (PE)
      • Polypropylene (PP)
      • Jute
      • Paper
      • Non-Woven Fabric
    • Y-o-Y Growth Trend Analysis By Material, 2020 to 2024
    • Absolute $ Opportunity Analysis By Material, 2025 to 2035
  7. Global Market Analysis 2020 to 2024 and Forecast 2025 to 2035, By Size
    • Introduction / Key Findings
    • Historical Market Size Value (USD Million) & Volume (Units) Analysis By Size , 2020 to 2024
    • Current and Future Market Size Value (USD Million) & Volume (Units) Analysis and Forecast By Size , 2025 to 2035
      • Less than 10 kg
      • 10-25 kg
      • 25-50 kg
      • 50-100 kg
      • More than 100 kg
    • Y-o-Y Growth Trend Analysis By Size , 2020 to 2024
    • Absolute $ Opportunity Analysis By Size , 2025 to 2035
  8. Global Market Analysis 2020 to 2024 and Forecast 2025 to 2035, By Closure Type
    • Introduction / Key Findings
    • Historical Market Size Value (USD Million) & Volume (Units) Analysis By Closure Type , 2020 to 2024
    • Current and Future Market Size Value (USD Million) & Volume (Units) Analysis and Forecast By Closure Type , 2025 to 2035
      • Drawstring
      • Plastic Tie
      • Wire Tie
      • Sewn Closure
      • Glued Closure
    • Y-o-Y Growth Trend Analysis By Closure Type , 2020 to 2024
    • Absolute $ Opportunity Analysis By Closure Type , 2025 to 2035
  9. Global Market Analysis 2020 to 2024 and Forecast 2025 to 2035, By Application
    • Introduction / Key Findings
    • Historical Market Size Value (USD Million) & Volume (Units) Analysis By Application , 2020 to 2024
    • Current and Future Market Size Value (USD Million) & Volume (Units) Analysis and Forecast By Application , 2025 to 2035
      • Chemical Fertilizers
      • Organic Fertilizers
      • Seed Treatment
      • Agrochemicals
    • Y-o-Y Growth Trend Analysis By Application , 2020 to 2024
    • Absolute $ Opportunity Analysis By Application , 2025 to 2035
  10. Global Market Analysis 2020 to 2024 and Forecast 2025 to 2035, By Region
    • Introduction
    • Historical Market Size Value (USD Million) & Volume (Units) Analysis By Region, 2020 to 2024
    • Current Market Size Value (USD Million) & Volume (Units) Analysis and Forecast By Region, 2025 to 2035
      • North America
      • Latin America
      • Europe
      • East Asia
      • South Asia
      • Oceania
      • MEA
    • Market Attractiveness Analysis By Region
  11. North America Market Analysis 2020 to 2024 and Forecast 2025 to 2035, By Country
    • Historical Market Size Value (USD Million) & Volume (Units) Trend Analysis By Market Taxonomy, 2020 to 2024
    • Market Size Value (USD Million) & Volume (Units) Forecast By Market Taxonomy, 2025 to 2035
      • By Country
        • USA
        • Canada
      • By Material
      • By Size
      • By Closure Type
      • By Application
    • Market Attractiveness Analysis
      • By Country
      • By Material
      • By Size
      • By Closure Type
      • By Application
    • Key Takeaways
  12. Latin America Market Analysis 2020 to 2024 and Forecast 2025 to 2035, By Country
    • Historical Market Size Value (USD Million) & Volume (Units) Trend Analysis By Market Taxonomy, 2020 to 2024
    • Market Size Value (USD Million) & Volume (Units) Forecast By Market Taxonomy, 2025 to 2035
      • By Country
        • Brazil
        • Mexico
        • Argentina
        • Chile
        • Peru
        • Rest of Latin America
      • By Material
      • By Size
      • By Closure Type
      • By Application
    • Market Attractiveness Analysis
      • By Country
      • By Material
      • By Size
      • By Closure Type
      • By Application
    • Key Takeaways
  13. Europe Market Analysis 2020 to 2024 and Forecast 2025 to 2035, By Country
    • Historical Market Size Value (USD Million) & Volume (Units) Trend Analysis By Market Taxonomy, 2020 to 2024
    • Market Size Value (USD Million) & Volume (Units) Forecast By Market Taxonomy, 2025 to 2035
      • By Country
        • Germany
        • Italy
        • France
        • UK
        • Spain
        • Russia
        • BENELUX
        • Rest of Europe
      • By Material
      • By Size
      • By Closure Type
      • By Application
    • Market Attractiveness Analysis
      • By Country
      • By Material
      • By Size
      • By Closure Type
      • By Application
    • Key Takeaways
  14. East Asia Market Analysis 2020 to 2024 and Forecast 2025 to 2035, By Country
    • Historical Market Size Value (USD Million) & Volume (Units) Trend Analysis By Market Taxonomy, 2020 to 2024
    • Market Size Value (USD Million) & Volume (Units) Forecast By Market Taxonomy, 2025 to 2035
      • By Country
        • China
        • Japan
        • South Korea
      • By Material
      • By Size
      • By Closure Type
      • By Application
    • Market Attractiveness Analysis
      • By Country
      • By Material
      • By Size
      • By Closure Type
      • By Application
    • Key Takeaways
  15. South Asia Market Analysis 2020 to 2024 and Forecast 2025 to 2035, By Country
    • Historical Market Size Value (USD Million) & Volume (Units) Trend Analysis By Market Taxonomy, 2020 to 2024
    • Market Size Value (USD Million) & Volume (Units) Forecast By Market Taxonomy, 2025 to 2035
      • By Country
        • India
        • Thailand
        • Malaysia
        • Indonesia
        • Rest of South Asia
      • By Material
      • By Size
      • By Closure Type
      • By Application
    • Market Attractiveness Analysis
      • By Country
      • By Material
      • By Size
      • By Closure Type
      • By Application
    • Key Takeaways
  16. Oceania Market Analysis 2020 to 2024 and Forecast 2025 to 2035, By Country
    • Historical Market Size Value (USD Million) & Volume (Units) Trend Analysis By Market Taxonomy, 2020 to 2024
    • Market Size Value (USD Million) & Volume (Units) Forecast By Market Taxonomy, 2025 to 2035
      • By Country
        • Australia
        • New Zealand
      • By Material
      • By Size
      • By Closure Type
      • By Application
    • Market Attractiveness Analysis
      • By Country
      • By Material
      • By Size
      • By Closure Type
      • By Application
    • Key Takeaways
  17. MEA Market Analysis 2020 to 2024 and Forecast 2025 to 2035, By Country
    • Historical Market Size Value (USD Million) & Volume (Units) Trend Analysis By Market Taxonomy, 2020 to 2024
    • Market Size Value (USD Million) & Volume (Units) Forecast By Market Taxonomy, 2025 to 2035
      • By Country
        • GCC
        • Rest of MEA
      • By Material
      • By Size
      • By Closure Type
      • By Application
    • Market Attractiveness Analysis
      • By Country
      • By Material
      • By Size
      • By Closure Type
      • By Application
    • Key Takeaways
  18. Key Countries Market Analysis
    • USA
      • Pricing Analysis
      • Market Share Analysis, 2024
        • By Material
        • By Size
        • By Closure Type
        • By Application
    • Canada
      • Pricing Analysis
      • Market Share Analysis, 2024
        • By Material
        • By Size
        • By Closure Type
        • By Application
    • Brazil
      • Pricing Analysis
      • Market Share Analysis, 2024
        • By Material
        • By Size
        • By Closure Type
        • By Application
    • Mexico
      • Pricing Analysis
      • Market Share Analysis, 2024
        • By Material
        • By Size
        • By Closure Type
        • By Application
    • Argentina
      • Pricing Analysis
      • Market Share Analysis, 2024
        • By Material
        • By Size
        • By Closure Type
        • By Application
  19. Market Structure Analysis
    • Competition Dashboard
    • Competition Benchmarking
    • Market Share Analysis of Top Players
      • By Regional
      • By Material
      • By Size
      • By Closure Type
      • By Application
  20. Competition Analysis
    • Competition Deep Dive
      • DS Smith
        • Overview
        • Product Portfolio
        • Profitability by Market Segments (Product/Age /Sales Channel/Region)
        • Sales Footprint
        • Strategy Overview
          • Marketing Strategy
          • Product Strategy
          • Channel Strategy
      • Novolex Holdings, LLC
        • Overview
        • Product Portfolio
        • Profitability by Market Segments (Product/Age /Sales Channel/Region)
        • Sales Footprint
        • Strategy Overview
          • Marketing Strategy
          • Product Strategy
          • Channel Strategy
      • Smurfit Kappa
        • Overview
        • Product Portfolio
        • Profitability by Market Segments (Product/Age /Sales Channel/Region)
        • Sales Footprint
        • Strategy Overview
          • Marketing Strategy
          • Product Strategy
          • Channel Strategy
      • Berry Global Group, Inc.
        • Overview
        • Product Portfolio
        • Profitability by Market Segments (Product/Age /Sales Channel/Region)
        • Sales Footprint
        • Strategy Overview
          • Marketing Strategy
          • Product Strategy
          • Channel Strategy
      • Pactiv Evergreen, Inc.
        • Overview
        • Product Portfolio
        • Profitability by Market Segments (Product/Age /Sales Channel/Region)
        • Sales Footprint
        • Strategy Overview
          • Marketing Strategy
          • Product Strategy
          • Channel Strategy
      • Berry Superfos As
        • Overview
        • Product Portfolio
        • Profitability by Market Segments (Product/Age /Sales Channel/Region)
        • Sales Footprint
        • Strategy Overview
          • Marketing Strategy
          • Product Strategy
          • Channel Strategy
      • Pregis Corporation
        • Overview
        • Product Portfolio
        • Profitability by Market Segments (Product/Age /Sales Channel/Region)
        • Sales Footprint
        • Strategy Overview
          • Marketing Strategy
          • Product Strategy
          • Channel Strategy
      • Greif
        • Overview
        • Product Portfolio
        • Profitability by Market Segments (Product/Age /Sales Channel/Region)
        • Sales Footprint
        • Strategy Overview
          • Marketing Strategy
          • Product Strategy
          • Channel Strategy
      • Sealed Air Corporation
        • Overview
        • Product Portfolio
        • Profitability by Market Segments (Product/Age /Sales Channel/Region)
        • Sales Footprint
        • Strategy Overview
          • Marketing Strategy
          • Product Strategy
          • Channel Strategy
      • ProAmpac Holdings
        • Overview
        • Product Portfolio
        • Profitability by Market Segments (Product/Age /Sales Channel/Region)
        • Sales Footprint
        • Strategy Overview
          • Marketing Strategy
          • Product Strategy
          • Channel Strategy
  21. Assumptions & Acronyms Used
  22. Research Methodology

List of Tables

  • Table 1: Global Market Value (USD Million) Forecast by Region, 2020-2035
  • Table 2: Global Market Volume (Units) Forecast by Region, 2020-2035
  • Table 3: Global Market Value (USD Million) Forecast by Material, 2020-2035
  • Table 4: Global Market Volume (Units) Forecast by Material, 2020-2035
  • Table 5: Global Market Value (USD Million) Forecast by Size, 2020-2035
  • Table 6: Global Market Volume (Units) Forecast by Size, 2020-2035
  • Table 7: Global Market Value (USD Million) Forecast by Closure Type, 2020-2035
  • Table 8: Global Market Volume (Units) Forecast by Closure Type, 2020-2035
  • Table 9: Global Market Value (USD Million) Forecast by Application, 2020-2035
  • Table 10: Global Market Volume (Units) Forecast by Application, 2020-2035
  • Table 11: North America Market Value (USD Million) Forecast by Country, 2020-2035
  • Table 12: North America Market Volume (Units) Forecast by Country, 2020-2035
  • Table 13: North America Market Value (USD Million) Forecast by Material, 2020-2035
  • Table 14: North America Market Volume (Units) Forecast by Material, 2020-2035
  • Table 15: North America Market Value (USD Million) Forecast by Size, 2020-2035
  • Table 16: North America Market Volume (Units) Forecast by Size, 2020-2035
  • Table 17: North America Market Value (USD Million) Forecast by Closure Type, 2020-2035
  • Table 18: North America Market Volume (Units) Forecast by Closure Type, 2020-2035
  • Table 19: North America Market Value (USD Million) Forecast by Application, 2020-2035
  • Table 20: North America Market Volume (Units) Forecast by Application, 2020-2035
  • Table 21: Latin America Market Value (USD Million) Forecast by Country, 2020-2035
  • Table 22: Latin America Market Volume (Units) Forecast by Country, 2020-2035
  • Table 23: Latin America Market Value (USD Million) Forecast by Material, 2020-2035
  • Table 24: Latin America Market Volume (Units) Forecast by Material, 2020-2035
  • Table 25: Latin America Market Value (USD Million) Forecast by Size, 2020-2035
  • Table 26: Latin America Market Volume (Units) Forecast by Size, 2020-2035
  • Table 27: Latin America Market Value (USD Million) Forecast by Closure Type, 2020-2035
  • Table 28: Latin America Market Volume (Units) Forecast by Closure Type, 2020-2035
  • Table 29: Latin America Market Value (USD Million) Forecast by Application, 2020-2035
  • Table 30: Latin America Market Volume (Units) Forecast by Application, 2020-2035
  • Table 31: Europe Market Value (USD Million) Forecast by Country, 2020-2035
  • Table 32: Europe Market Volume (Units) Forecast by Country, 2020-2035
  • Table 33: Europe Market Value (USD Million) Forecast by Material, 2020-2035
  • Table 34: Europe Market Volume (Units) Forecast by Material, 2020-2035
  • Table 35: Europe Market Value (USD Million) Forecast by Size, 2020-2035
  • Table 36: Europe Market Volume (Units) Forecast by Size, 2020-2035
  • Table 37: Europe Market Value (USD Million) Forecast by Closure Type, 2020-2035
  • Table 38: Europe Market Volume (Units) Forecast by Closure Type, 2020-2035
  • Table 39: Europe Market Value (USD Million) Forecast by Application, 2020-2035
  • Table 40: Europe Market Volume (Units) Forecast by Application, 2020-2035
  • Table 41: East Asia Market Value (USD Million) Forecast by Country, 2020-2035
  • Table 42: East Asia Market Volume (Units) Forecast by Country, 2020-2035
  • Table 43: East Asia Market Value (USD Million) Forecast by Material, 2020-2035
  • Table 44: East Asia Market Volume (Units) Forecast by Material, 2020-2035
  • Table 45: East Asia Market Value (USD Million) Forecast by Size, 2020-2035
  • Table 46: East Asia Market Volume (Units) Forecast by Size, 2020-2035
  • Table 47: East Asia Market Value (USD Million) Forecast by Closure Type, 2020-2035
  • Table 48: East Asia Market Volume (Units) Forecast by Closure Type, 2020-2035
  • Table 49: East Asia Market Value (USD Million) Forecast by Application, 2020-2035
  • Table 50: East Asia Market Volume (Units) Forecast by Application, 2020-2035
  • Table 51: South Asia Market Value (USD Million) Forecast by Country, 2020-2035
  • Table 52: South Asia Market Volume (Units) Forecast by Country, 2020-2035
  • Table 53: South Asia Market Value (USD Million) Forecast by Material, 2020-2035
  • Table 54: South Asia Market Volume (Units) Forecast by Material, 2020-2035
  • Table 55: South Asia Market Value (USD Million) Forecast by Size, 2020-2035
  • Table 56: South Asia Market Volume (Units) Forecast by Size, 2020-2035
  • Table 57: South Asia Market Value (USD Million) Forecast by Closure Type, 2020-2035
  • Table 58: South Asia Market Volume (Units) Forecast by Closure Type, 2020-2035
  • Table 59: South Asia Market Value (USD Million) Forecast by Application, 2020-2035
  • Table 60: South Asia Market Volume (Units) Forecast by Application, 2020-2035
  • Table 61: Oceania Market Value (USD Million) Forecast by Country, 2020-2035
  • Table 62: Oceania Market Volume (Units) Forecast by Country, 2020-2035
  • Table 63: Oceania Market Value (USD Million) Forecast by Material, 2020-2035
  • Table 64: Oceania Market Volume (Units) Forecast by Material, 2020-2035
  • Table 65: Oceania Market Value (USD Million) Forecast by Size, 2020-2035
  • Table 66: Oceania Market Volume (Units) Forecast by Size, 2020-2035
  • Table 67: Oceania Market Value (USD Million) Forecast by Closure Type, 2020-2035
  • Table 68: Oceania Market Volume (Units) Forecast by Closure Type, 2020-2035
  • Table 69: Oceania Market Value (USD Million) Forecast by Application, 2020-2035
  • Table 70: Oceania Market Volume (Units) Forecast by Application, 2020-2035
  • Table 71: MEA Market Value (USD Million) Forecast by Country, 2020-2035
  • Table 72: MEA Market Volume (Units) Forecast by Country, 2020-2035
  • Table 73: MEA Market Value (USD Million) Forecast by Material, 2020-2035
  • Table 74: MEA Market Volume (Units) Forecast by Material, 2020-2035
  • Table 75: MEA Market Value (USD Million) Forecast by Size, 2020-2035
  • Table 76: MEA Market Volume (Units) Forecast by Size, 2020-2035
  • Table 77: MEA Market Value (USD Million) Forecast by Closure Type, 2020-2035
  • Table 78: MEA Market Volume (Units) Forecast by Closure Type, 2020-2035
  • Table 79: MEA Market Value (USD Million) Forecast by Application, 2020-2035
  • Table 80: MEA Market Volume (Units) Forecast by Application, 2020-2035

List of Figures

  • Figure 1: Global Market Volume (Units) Forecast 2020-2035
  • Figure 2: Global Market Pricing Analysis
  • Figure 3: Global Market Value (USD Million) Forecast 2020-2035
  • Figure 4: Global Market Value Share and BPS Analysis by Material, 2025 and 2035
  • Figure 5: Global Market Y-o-Y Growth Comparison by Material, 2025-2035
  • Figure 6: Global Market Attractiveness Analysis by Material
  • Figure 7: Global Market Value Share and BPS Analysis by Size , 2025 and 2035
  • Figure 8: Global Market Y-o-Y Growth Comparison by Size , 2025-2035
  • Figure 9: Global Market Attractiveness Analysis by Size
  • Figure 10: Global Market Value Share and BPS Analysis by Closure Type , 2025 and 2035
  • Figure 11: Global Market Y-o-Y Growth Comparison by Closure Type , 2025-2035
  • Figure 12: Global Market Attractiveness Analysis by Closure Type
  • Figure 13: Global Market Value Share and BPS Analysis by Application , 2025 and 2035
  • Figure 14: Global Market Y-o-Y Growth Comparison by Application , 2025-2035
  • Figure 15: Global Market Attractiveness Analysis by Application
  • Figure 16: Global Market Value (USD Million) Share and BPS Analysis by Region, 2025 and 2035
  • Figure 17: Global Market Y-o-Y Growth Comparison by Region, 2025-2035
  • Figure 18: Global Market Attractiveness Analysis by Region
  • Figure 19: North America Market Incremental $ Opportunity, 2025-2035
  • Figure 20: Latin America Market Incremental $ Opportunity, 2025-2035
  • Figure 21: Europe Market Incremental $ Opportunity, 2025-2035
  • Figure 22: East Asia Market Incremental $ Opportunity, 2025-2035
  • Figure 23: South Asia Market Incremental $ Opportunity, 2025-2035
  • Figure 24: Oceania Market Incremental $ Opportunity, 2025-2035
  • Figure 25: MEA Market Incremental $ Opportunity, 2025-2035
  • Figure 26: North America Market Value Share and BPS Analysis by Country, 2025 and 2035
  • Figure 27: North America Market Value Share and BPS Analysis by Material, 2025 and 2035
  • Figure 28: North America Market Y-o-Y Growth Comparison by Material, 2025-2035
  • Figure 29: North America Market Attractiveness Analysis by Material
  • Figure 30: North America Market Value Share and BPS Analysis by Size , 2025 and 2035
  • Figure 31: North America Market Y-o-Y Growth Comparison by Size , 2025-2035
  • Figure 32: North America Market Attractiveness Analysis by Size
  • Figure 33: North America Market Value Share and BPS Analysis by Closure Type , 2025 and 2035
  • Figure 34: North America Market Y-o-Y Growth Comparison by Closure Type , 2025-2035
  • Figure 35: North America Market Attractiveness Analysis by Closure Type
  • Figure 36: North America Market Value Share and BPS Analysis by Application , 2025 and 2035
  • Figure 37: North America Market Y-o-Y Growth Comparison by Application , 2025-2035
  • Figure 38: North America Market Attractiveness Analysis by Application
  • Figure 39: Latin America Market Value Share and BPS Analysis by Country, 2025 and 2035
  • Figure 40: Latin America Market Value Share and BPS Analysis by Material, 2025 and 2035
  • Figure 41: Latin America Market Y-o-Y Growth Comparison by Material, 2025-2035
  • Figure 42: Latin America Market Attractiveness Analysis by Material
  • Figure 43: Latin America Market Value Share and BPS Analysis by Size , 2025 and 2035
  • Figure 44: Latin America Market Y-o-Y Growth Comparison by Size , 2025-2035
  • Figure 45: Latin America Market Attractiveness Analysis by Size
  • Figure 46: Latin America Market Value Share and BPS Analysis by Closure Type , 2025 and 2035
  • Figure 47: Latin America Market Y-o-Y Growth Comparison by Closure Type , 2025-2035
  • Figure 48: Latin America Market Attractiveness Analysis by Closure Type
  • Figure 49: Latin America Market Value Share and BPS Analysis by Application , 2025 and 2035
  • Figure 50: Latin America Market Y-o-Y Growth Comparison by Application , 2025-2035
  • Figure 51: Latin America Market Attractiveness Analysis by Application
  • Figure 52: Europe Market Value Share and BPS Analysis by Country, 2025 and 2035
  • Figure 53: Europe Market Value Share and BPS Analysis by Material, 2025 and 2035
  • Figure 54: Europe Market Y-o-Y Growth Comparison by Material, 2025-2035
  • Figure 55: Europe Market Attractiveness Analysis by Material
  • Figure 56: Europe Market Value Share and BPS Analysis by Size , 2025 and 2035
  • Figure 57: Europe Market Y-o-Y Growth Comparison by Size , 2025-2035
  • Figure 58: Europe Market Attractiveness Analysis by Size
  • Figure 59: Europe Market Value Share and BPS Analysis by Closure Type , 2025 and 2035
  • Figure 60: Europe Market Y-o-Y Growth Comparison by Closure Type , 2025-2035
  • Figure 61: Europe Market Attractiveness Analysis by Closure Type
  • Figure 62: Europe Market Value Share and BPS Analysis by Application , 2025 and 2035
  • Figure 63: Europe Market Y-o-Y Growth Comparison by Application , 2025-2035
  • Figure 64: Europe Market Attractiveness Analysis by Application
  • Figure 65: East Asia Market Value Share and BPS Analysis by Country, 2025 and 2035
  • Figure 66: East Asia Market Value Share and BPS Analysis by Material, 2025 and 2035
  • Figure 67: East Asia Market Y-o-Y Growth Comparison by Material, 2025-2035
  • Figure 68: East Asia Market Attractiveness Analysis by Material
  • Figure 69: East Asia Market Value Share and BPS Analysis by Size , 2025 and 2035
  • Figure 70: East Asia Market Y-o-Y Growth Comparison by Size , 2025-2035
  • Figure 71: East Asia Market Attractiveness Analysis by Size
  • Figure 72: East Asia Market Value Share and BPS Analysis by Closure Type , 2025 and 2035
  • Figure 73: East Asia Market Y-o-Y Growth Comparison by Closure Type , 2025-2035
  • Figure 74: East Asia Market Attractiveness Analysis by Closure Type
  • Figure 75: East Asia Market Value Share and BPS Analysis by Application , 2025 and 2035
  • Figure 76: East Asia Market Y-o-Y Growth Comparison by Application , 2025-2035
  • Figure 77: East Asia Market Attractiveness Analysis by Application
  • Figure 78: South Asia Market Value Share and BPS Analysis by Country, 2025 and 2035
  • Figure 79: South Asia Market Value Share and BPS Analysis by Material, 2025 and 2035
  • Figure 80: South Asia Market Y-o-Y Growth Comparison by Material, 2025-2035
  • Figure 81: South Asia Market Attractiveness Analysis by Material
  • Figure 82: South Asia Market Value Share and BPS Analysis by Size , 2025 and 2035
  • Figure 83: South Asia Market Y-o-Y Growth Comparison by Size , 2025-2035
  • Figure 84: South Asia Market Attractiveness Analysis by Size
  • Figure 85: South Asia Market Value Share and BPS Analysis by Closure Type , 2025 and 2035
  • Figure 86: South Asia Market Y-o-Y Growth Comparison by Closure Type , 2025-2035
  • Figure 87: South Asia Market Attractiveness Analysis by Closure Type
  • Figure 88: South Asia Market Value Share and BPS Analysis by Application , 2025 and 2035
  • Figure 89: South Asia Market Y-o-Y Growth Comparison by Application , 2025-2035
  • Figure 90: South Asia Market Attractiveness Analysis by Application
  • Figure 91: Oceania Market Value Share and BPS Analysis by Country, 2025 and 2035
  • Figure 92: Oceania Market Value Share and BPS Analysis by Material, 2025 and 2035
  • Figure 93: Oceania Market Y-o-Y Growth Comparison by Material, 2025-2035
  • Figure 94: Oceania Market Attractiveness Analysis by Material
  • Figure 95: Oceania Market Value Share and BPS Analysis by Size , 2025 and 2035
  • Figure 96: Oceania Market Y-o-Y Growth Comparison by Size , 2025-2035
  • Figure 97: Oceania Market Attractiveness Analysis by Size
  • Figure 98: Oceania Market Value Share and BPS Analysis by Closure Type , 2025 and 2035
  • Figure 99: Oceania Market Y-o-Y Growth Comparison by Closure Type , 2025-2035
  • Figure 100: Oceania Market Attractiveness Analysis by Closure Type
  • Figure 101: Oceania Market Value Share and BPS Analysis by Application , 2025 and 2035
  • Figure 102: Oceania Market Y-o-Y Growth Comparison by Application , 2025-2035
  • Figure 103: Oceania Market Attractiveness Analysis by Application
  • Figure 104: MEA Market Value Share and BPS Analysis by Country, 2025 and 2035
  • Figure 105: MEA Market Value Share and BPS Analysis by Material, 2025 and 2035
  • Figure 106: MEA Market Y-o-Y Growth Comparison by Material, 2025-2035
  • Figure 107: MEA Market Attractiveness Analysis by Material
  • Figure 108: MEA Market Value Share and BPS Analysis by Size , 2025 and 2035
  • Figure 109: MEA Market Y-o-Y Growth Comparison by Size , 2025-2035
  • Figure 110: MEA Market Attractiveness Analysis by Size
  • Figure 111: MEA Market Value Share and BPS Analysis by Closure Type , 2025 and 2035
  • Figure 112: MEA Market Y-o-Y Growth Comparison by Closure Type , 2025-2035
  • Figure 113: MEA Market Attractiveness Analysis by Closure Type
  • Figure 114: MEA Market Value Share and BPS Analysis by Application , 2025 and 2035
  • Figure 115: MEA Market Y-o-Y Growth Comparison by Application , 2025-2035
  • Figure 116: MEA Market Attractiveness Analysis by Application
  • Figure 117: Global Market - Tier Structure Analysis
  • Figure 118: Global Market - Company Share Analysis

Frequently Asked Questions

What was the overall size of the fertilizer bags market in 2025?

The overall market size for the fertilizer bags market was USD 3.5 billion in 2025.

How big is the fertilizer bags market expected to be in 2035?

The fertilizer bags market is expected to reach USD 5.0 billion in 2035.

What will drive the demand for the fertilizer bags market during the forecast period?

The increasing demand for efficient and durable packaging solutions, rising agricultural activities, and growing focus on sustainable and recyclable materials fuel the fertilizer bags market during the forecast period.

List the top 5 countries contributing to the fertilizer bags market.

The top 5 countries driving the development of the fertilizer bags market are the USA, UK, European Union, Japan, and South Korea.

Which segment in type is expected to lead in the fertilizer bags market?

Agriculture leads market growth to command a significant share over the assessment period.

Explore Similar Insights

Future Market Insights

Fertilizer Bags Market