
- Market Size (2026)
- USD 3.8 Bn
- Forecast (2036)
- USD 11.8 Bn
- CAGR (2026 to 2036)
- 12.0%
How big is Nano Fertilizers Market in 2026?
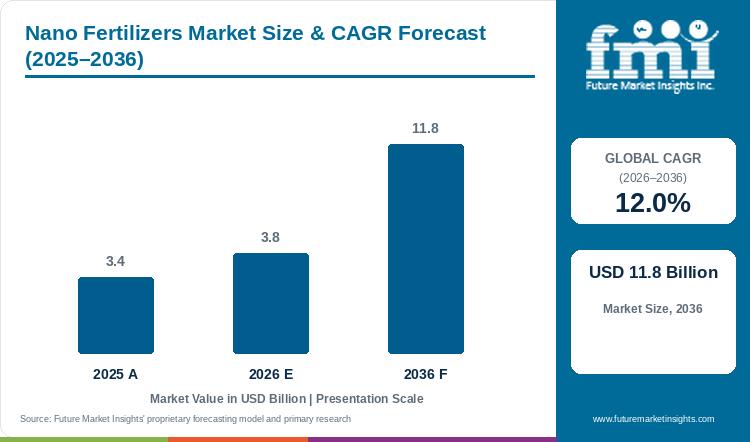
The nano fertilizers market demonstrated steady progress from USD 3.4 billion in 2025 to USD 3.8 billion in 2026, building toward a targeted valuation of USD 11.8 billion by 2036 at a CAGR of 12.0%.
The global nano fertilizers market was valued at USD 3.4 billion in 2025 and is estimated to reach USD 3.8 billion in 2026. The market is projected to reach USD 11.8 billion by 2036, expanding at a compound annual growth rate (CAGR) of 12.0% between 2026 and 2036. Formulation trend analysis by FMI indicates that nano nitrogen liquid urea nanoparticles are projected to capture 54.0% of 2026 demand, since sub-100-nanometer nitrogen particles achieve over 80% foliar assimilation efficiency compared with 30% to 40% uptake for soil-broadcast urea granules. The demand for nano fertilizers is supported by national subsidy-reduction programs and cooperative field trials, with the Government of India Press Information Bureau reporting in March 2026 that cumulative production and dispatch progress reached 1,219.27 lakh bottles of Nano Urea and 374.10 lakh bottles of Nano DAP [1]. That rapid foliar substitution separates the category from controlled release fertilizers at a 6.4% CAGR, given that polymer-coated granules still move in bulk 50-kilogram sacks while single 500-milliliter nano bottles treat an entire acre via drone or boom sprayer. Manufacturers are also investing in multi-zone agronomic validation to drive repeat grower orders, as IFFCO completed 2,938 Nano DAP and 484 Nano Urea farmer field trials across 15 agro-climatic zones by March 2026 under Indian Council of Agricultural Research supervision [2]. Cereal and horticultural growers renew nano-nutrient purchases when foliar sprays cut bulk nitrogen and phosphate input costs without grain yield loss, and suppliers pairing verified stomata-penetration stability with cooperative drone-spraying networks retain those accounts through 2036.
Key Market Trends & Insights
- By nutrient formulation: Nano Nitrogen Liquid Urea Nanoparticles hold an estimated 54.0% share in 2026 given that 20 to 50 nanometer surface-functionalized urea clusters replace top-dressing granular urea bags.
- By application method: Foliar Spray Precision Droplet Spraying represents a projected 58.0% in 2026 as electrostatic boom nozzles and agricultural spray drones deposit nano-droplets directly onto crop canopies.
- By crop type: Cereal Grains Rice and Wheat plus Corn account for an anticipated 46.0% in 2026 since irrigated grain acreage requires split nitrogen and phosphorus top-dressing.
- By physical form: Liquid Colloidal Suspension secures a forecast 64.0% in 2026 owing to biopolymer stabilization that prevents nanoparticle agglomeration inside farm spray tanks.
- By distribution channel: Agricultural Cooperatives and Dealer Networks command an estimated 52.0% in 2026 through village-level retail stocking and bundled drone-spraying service contracts.
Regional Highlights
- Top national expansion: India leads global country expansion at a 14.8% CAGR ahead of Mexico at 14.1% through 2036 under nationwide cooperative Nano Urea Plus and Nano DAP rollouts.
- Broader country progression: Brazil tracks at a 13.4% CAGR ahead of the United States at 13.0% and Australia at 12.6%, while Canada advances at 12.5% and the United Kingdom progresses at 11.6%.
Market Size & Forecast
Table 1: Market Size and Forecast for the Nano Fertilizers Market (USD billion and CAGR percentage), 2025 to 2036
| Metric | Value |
|---|---|
| 2025 Market Size | USD 3.4 billion |
| Estimated Market Size in 2026 | USD 3.8 billion |
| Projected Market Size by 2036 | USD 11.8 billion |
| CAGR, 2026 to 2036 | 12.0% |
| Added Revenue, 2026 to 2036 | USD 8.0 billion |
Commercial grain growers and horticultural estates confront severe soil acidification, nitrate groundwater leaching, and rising bulk freight expenses when applying conventional prilled urea and diammonium phosphate. When farm operators substitute 500-milliliter foliar liquid nano-nutrient bottles for half of their seasonal granular top-dressing and pair them with nitrogen stabilizer additives, canopy stomatal absorption bypasses soil fixation entirely. In March 2026, agronomy researchers publishing in Sustainability documented that novel nanotechnologies including liquid nano urea and nano diammonium phosphate substantially reduce nutrient volatilization and runoff while sustaining crop yield attributes [3]. Consequently, agricultural ministries and commercial farm cooperatives integrate liquid nano-formulations into precision nutrient management charters.
Treated Acreage and Bottle Dosing Sizing
Table 2: Treated Acreage and Bottle Dosing Sizing for the Nano Fertilizers Market (USD billion and operational ranges), 2025 to 2036
| Metric | 2025 | 2026 | 2036 |
|---|---|---|---|
| Market size (USD billion) | 3.4 | 3.8 | 11.8 |
| Global treated crop area per year (million hectares) | 142.0 to 158.0 | 160.0 to 178.0 | 485.0 to 530.0 |
| Commercial 500 ml equivalent bottle shipments (million units) | 490.0 to 535.0 | 550.0 to 605.0 | 1,680.0 to 1,840.0 |
| Average foliar treatment expenditure per hectare (USD) | 21.5 to 24.0 | 21.8 to 24.5 | 22.5 to 25.4 |
Operational note: Treated crop area ranges apply standard foliar dosing of 2 to 4 milliliters of liquid nano-fertilizer per liter of spray water (one 500 ml bottle per acre per application pass).
Uniform canopy coverage at ultra-low liquid application volumes requires controlled droplet spectrums between 100 and 250 microns so nanoparticles adhere to leaf cuticles without drift loss. As documented in a November 2026 scoping review in Agrochemicals, pairing unmanned aerial vehicle remote sensing with targeted drone spraying optimizes foliar nano-fertilizer deposition across variable-rate field zones [4]. Ag-input formulators engineer low-viscosity biopolymer dispersants that remain compatible with specialty water soluble nutrients in high-speed drone and pivot-fertigation tanks.
Farm Input Economics & Cooperative Channel Sizing
Table 3: Global Bottle Volume and Farm Adoption Indicators for the Nano Fertilizers Market (USD and units), 2025 to 2036
| Metric | 2025 | 2026 | 2036 |
|---|---|---|---|
| Foliar nitrogen & phosphorus uptake efficiency vs. soil granules (%) | 78.0% to 85.0% | 80.0% to 86.0% | 84.0% to 90.0% |
| Drone-sprayed share of total foliar nano-fertilizer passes (%) | 18.0% | 22.5% | 48.0% |
| Binary Nano DAP & multi-nutrient NPK share of total volume (%) | 26.0% | 29.5% | 44.0% |
| Average ex-retail price per 500 ml liquid nano bottle (USD) | 6.20 to 8.50 | 6.30 to 8.60 | 6.50 to 8.90 |
Table 4: Cooperative Manufacturing & Field Trial Indicators for the Nano Fertilizers Market (USD and operational counts), 2026
| Metric | Value | Institutional Reference Basis |
|---|---|---|
| Market size, 2026 | USD 3.8 billion | 2026 global commercial nano fertilizer revenue baseline |
| Cumulative Indian Nano Urea & Nano DAP dispatches (to March 2026) | 159.34 million bottles | PIB Government of India March 20, 2026 (1,219.27L Urea + 374.10L DAP) |
| ICAR-KVK supervised farmer field trials in 2025-26 | 3,422 trials | PIB March 27, 2026 (2,938 Nano DAP + 484 Nano Urea across 15 ACZs) |
| Nano Nitrogen Liquid Urea segment revenue, 2026 | USD 2.05 billion | 54.0% nutrient formulation share across cereal and cash crops |
Substitution of subsidized bulk granular bags with foliar nano-liquids requires convincing risk-averse cereal farmers that a half-liter bottle delivers equivalent tiller density and grain protein at harvest. Field trial data published in Frontiers in Sustainable Food Systems in 2025 demonstrated that combining reduced basal nitrogen with foliar IFFCO nano-urea sprays improved nitrogen agronomic efficiency and maintained wheat grain yield and biochemical quality [5]. To accelerate grower conversion across phosphate crop nutrients and nitrogen programs, cooperatives bundle custom drone-spraying services directly with bottle sales.
Analyst Perspective
"Farmers do not adopt nano fertilizers for nanoscale chemistry claims; they switch when a USD 6 to USD 10 foliar bottle replaces a 45-kilogram granular sack, eliminates manual field broadcasting labor, and preserves harvest weight. Producers that combine multi-nutrient NPK nanocrystals with turnkey cooperative drone-spraying and drip-fertigation dosing will capture the post-2026 repeat-order wave."
- Nikhil Kaitwade, Principal Consultant, Future Market Insights.
How is the nano fertilizers market segmented?
The nano fertilizers market is segmented by nutrient formulation, application method, crop type, physical form, and distribution channel. In 2026, Nano Nitrogen Liquid Urea Nanoparticles are projected at 54.0%, Foliar Spray Precision Droplet Spraying at 58.0%, Cereal Grains at 46.0%, Liquid Colloidal Suspension at 64.0%, and Agricultural Cooperatives and Dealer Networks at 52.0%.
By nutrient formulation: Nano Nitrogen Liquid Urea Nanoparticles and Nano Phosphorus and Phosphate Nanocrystals. It also covers Nano Potassium Formulations and Nano Micronutrients and Biochar Stimulants.
By application method: Foliar Spray Precision Droplet Spraying and Fertigation Drip and Micro-Irrigation Dosing. It also includes Seed Soaking and Nanoparticle Priming and Soil Hydroponic Root Zone Application.
By crop type: Cereal Grains Rice Wheat and Corn and Oilseeds and Pulses Soybeans and Canola. It also spans High-Value Horticultural Fruits and Vegetables and Plantation Cash Crops.
By physical form: Liquid Colloidal Suspension, Water-Dispersible Nano Powder, and Nano-Encapsulated Granules.
By distribution channel: Agricultural Cooperatives and Dealer Networks and Direct Institutional and Commercial Farm Supply. It also includes Agrochemical Retail Stores and Digital Ag-Input Platforms.
Why do Nano Nitrogen Liquid Urea Nanoparticles lead the nutrient formulation category?
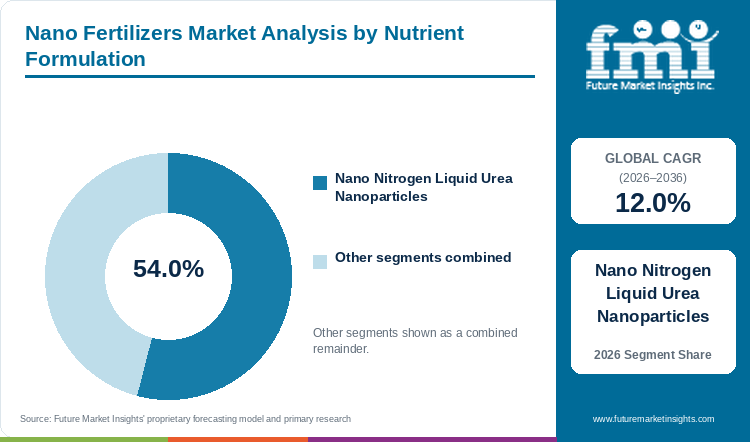
Nano Nitrogen Liquid Urea Nanoparticles hold an estimated 54.0% of nutrient formulation demand in 2026, anchored by top-dressing granular urea replacement across staple grains.
Table 5: Nutrient Formulation Share for the Nano Fertilizers Market (percentage share), 2026
| Nutrient Formulation | Share (2026) |
|---|---|
| Nano Nitrogen Liquid Urea Nanoparticles | 54.0% |
| Other Segments Combined | 46.0%* |
| Total | 100.0% |
*Note: Remaining nutrient formulation categories account for the balance of 2026 global nano fertilizers demand.
Table 6: Nutrient Formulation Leadership and Market Growth for the Nano Fertilizers Market (segment and CAGR percentage), 2026 to 2036
| Metric | Value |
|---|---|
| Global CAGR (2026 to 2036) | 12.0% |
| Leading Segment | Nano Nitrogen Liquid Urea Nanoparticles |
Nano Nitrogen Liquid Urea Nanoparticles containing 4% to 20% weight-by-volume surface-functionalized nitrogen clusters below 100 nanometers lead commercial sales because nitrogen is the highest-volume macronutrient applied at vegetative tillering and canopy closure stages. In contrast to soil-applied sulphur coated urea that depends on rainfall dissolution, foliar nano-urea enters leaf stomata and phloem transport channels within hours of spraying. Meanwhile, binary nitrogen-phosphorus nanocrystals are scaling rapidly, with agronomic trials in Frontiers in Agronomy in 2026 confirming that nano-phosphorus and liquid nano-DAP lift wheat and potato yields by 14.7% to 34.8% while curbing soil phosphorus fixation [6].
- Within the nutrient formulation segment, Nano Nitrogen Liquid Urea Nanoparticles are projected to account for a leading 54.0% share in 2026, driven by nationwide cooperative distribution and top-dressing replacement across cereal belts.
- Over the 2026 to 2036 forecast period, Nano Phosphorus and multi-nutrient nano-NPK formulations are anticipated to gain market share as growers seek single-pass foliar macronutrient delivery.
What sustains Foliar Spray Precision Droplet Spraying leadership in the application method segment?
Foliar Spray Precision Droplet Spraying represents a projected 58.0% of the application method category in 2026, supported by rapid stomatal absorption via boom and drone sprayers.
Foliar Spray Precision Droplet Spraying dominates field application because applying sub-100-nanometer nutrient colloids directly onto metabolically active leaves prevents soil clay adsorption, phosphate precipitation, and nitrate leaching. Commercial growers tank-mix liquid nano-nutrients with post-emergence crop protection sprays or deploy battery-powered agricultural spray drones and chelated micronutrient blends to treat standing crops in 10 minutes per acre. However, foliar spraying requires calm wind conditions and proper vegetative leaf area index at 25 to 50 days after sowing to avoid soil spray waste.
- In 2026, Foliar Spray Precision Droplet Spraying is anticipated to capture 58.0% of global application method demand, reflecting rapid adoption of tractor boom tank-mixing and custom agricultural drone spraying.
- In addition to foliar passes, seed nano-priming is gaining technical validation, with a 2026 study in Frontiers in Agronomy demonstrating that seed nano-priming with nano potassium silicate and zinc oxide nanoparticles significantly improves seedling vigor and drought tolerance [7].
How do Cereal Grains Rice, Wheat, and Corn lead the crop type category?
Cereal Grains Rice, Wheat, and Corn account for an anticipated 46.0% of crop type demand in 2026, driven by split-nitrogen top-dressing across irrigated grain belts.
Cereal Grains encompassing irrigated rice paddy, winter and spring wheat, and hybrid corn represent the largest crop buyer pool for nano fertilizers because staple grains occupy the vast majority of nitrogen-intensive and phosphorus-intensive cropland. Substitution of second and third split broadcasts of prilled urea in standing rice and wheat fields with foliar nano-urea and agricultural crop micronutrients cuts logistics transport weight by more than 90%. Plant science research published in Frontiers in Plant Science in October 2026 further verified that iron oxide nanoparticles dosed at 300 milligrams per kilogram with beneficial rhizobacteria increased seed germination by 45% and enhanced photosynthetic efficiency in field crops [8].
- Demand from Cereal Grains is estimated to reach 46.0% of total crop type share in 2026 as cooperative procurement programs target staple rice, wheat, and corn belts.
- High-value horticultural fruits and greenhouse vineyards are forecast to record fast value growth through 2036 via drip-fertigation dosing of nano-calcium and nano-zinc.
Why does Liquid Colloidal Suspension lead the physical form category?
Liquid Colloidal Suspension secures a forecast 64.0% of physical form volume in 2026, supported by biopolymer dispersion stability and clog-free spray nozzle performance.
Liquid Colloidal Suspension formulations packaged in high-density polyethylene 500-milliliter and 1-liter bottles command the largest physical form share because pre-dispersed aqueous sols eliminate on-farm powder dissolution delays and nozzle clogging. Manufacturers stabilize metallic and mineral nanoparticles using natural biopolymers, citrates, and microbial exudates that remain in suspension across 18 to 24 months of ambient warehouse storage while complementing potassium release biologics. Control over particle Ostwald ripening and sedimentation under extreme summer storage temperatures remains the primary quality-control gate for liquid formulators.
- Strong grower preference for ready-to-pour foliar concentrates places Liquid Colloidal Suspension on course to hold an estimated 64.0% share of the physical form category in 2026.
- Peer-reviewed research published in Plants in August 2025 confirmed that colloidal zinc oxide nanoparticles applied via foliar spray deliver superior leaf cuticle penetration and abiotic stress resilience compared with coarse bulk zinc sulfate powders [9].
What gives Agricultural Cooperatives and Dealer Networks the leading position in distribution channel?
Agricultural Cooperatives and Dealer Networks command an estimated 52.0% of distribution channel share in 2026, anchored by village-level credit and custom drone-spraying bundles.
Agricultural Cooperatives and Dealer Networks anchor global nano fertilizer distribution because smallholder and mid-sized grain farmers rely on local cooperative credit, seasonal input bundles, and trusted agronomic demonstrations when switching from bulk bags to liquid bottles. In parallel, commercial soil-amendment suppliers are expanding carbon-matrix and biochar fertilizer blends through regional dealer networks, as shown in an April 2025 Agronomy study finding that biochar-based nano-composites provide sustained phosphorus and potassium release across multiple growth stages [10]. Cooperatives that equip village dealers with calibrated battery sprayers and drone operators achieve substantially higher bottle reorder rates.
- Market share for Agricultural Cooperatives and Dealer Networks is projected to reach 52.0% of the distribution channel segment in 2026, supported by deep rural retail reach and subsidized input bundling.
- Direct institutional supply to large Latin American and North American row-crop estates and digital ag-input platforms are projected to expand steadily through 2036.
What are the drivers, restraints, and opportunities in the nano fertilizers market?
In the nano fertilizers market, government subsidy-reduction schemes and high foliar uptake efficiency are projected to drive adoption whereas basal soil-nutrition omissions restrain unguided use and multi-nutrient nano-NPK suspensions create repeat farm orders.
- Driver: Volatile global bulk fertilizer prices, government subsidy-reduction mandates, and high foliar nutrient-use efficiency are projected to drive rapid farm adoption of liquid nano fertilizers.
- Restraint: Strict heavy-metal and nanoparticle ecotoxicity registration dossiers and grower skepticism when basal soil nutrition is omitted altogether restrain unguided field use.
- Opportunity: Integrating carbon-based nano-biochar carriers, multi-nutrient NPK nano-suspensions, and automated agricultural drone-spraying services creates recurring commercial revenue streams.
Growth Analysis and Future Potential: Qualitative Demand Catalysts
Elevated conventional urea and diammonium phosphate prices paired with government campaigns to curb fiscal fertilizer subsidy outlays act as the primary drivers accelerating nano fertilizer adoption through 2036. When growers replace one or two 45-kilogram top-dressing bags per acre with foliar nano-urea and granular fertility blends, sovereign treasuries save billions in import freight and subsidy outlays while farms reduce nitrate runoff. Global commodity data in the Food and Agriculture Organization's 2025 Fertilizer Market Developments report shows that nitrogen and potassium demand rebounded while elevated natural gas feedstock costs and trade policy risks continued to shape fertilizer affordability across major importing nations [11]. This cost pressure compels agricultural ministries and farm cooperatives to expand domestic liquid nano-fertilizer manufacturing.
Risk Assessment of the Nano Fertilizers Market: Operational and Formulation Friction
Inconsistent field yield outcomes when farmers mistakenly eliminate 100% of basal soil fertilizer and evolving regulatory ecotoxicity review frameworks represent the primary hurdles restraining nano fertilizer market growth. Because a 500-milliliter bottle of 4% nano-urea contains roughly 20 grams of elemental nitrogen, it is engineered to supplement a 50% to 75% basal soil nitrogen program by boosting foliar metabolic efficiency rather than replacing bulk soil organic matter entirely. As documented in the FAO Markets and Trade Division's global agricultural inputs assessment, farm purchasing decisions remain sensitive to verified yield-to-cost ratios and transparent national agronomic registration standards [17]. Furthermore, European Union REACH and North American EPA nanoscale substance notifications require chronic soil-microbiome and aquatic toxicity dossiers before new metallic oxide nanoparticles gain unrestricted commercial registration.
Commercial Opportunity Analysis: Formulation Differentiation and Value-Add Formats
Development of multi-nutrient nano-NPK suspensions, graphene and biochar slow-release nanocomposites, and drought-mitigating biostimulant hybrids creates high-margin commercial avenues for specialty plant-nutrition manufacturers. Rather than selling single-element nano-urea alone, agrochemical innovators are chelating nano-zinc or nano-boron using seaweed extracts and humic carbon matrices that relieve heat and salinity stress in precision fertigation systems. In October 2026, the World Bank Commodity Markets Outlook projected a 14% rise in global fertilizer prices in 2026 led by urea tightness, strengthening the commercial opportunity for high-efficiency foliar nano-fertilizers [12]. Satellite crop-health prescriptions paired with multi-nutrient nano-sprays enable input suppliers to capture premium per-hectare service revenues.
Nano Fertilizers Market by Country (2026 to 2036)
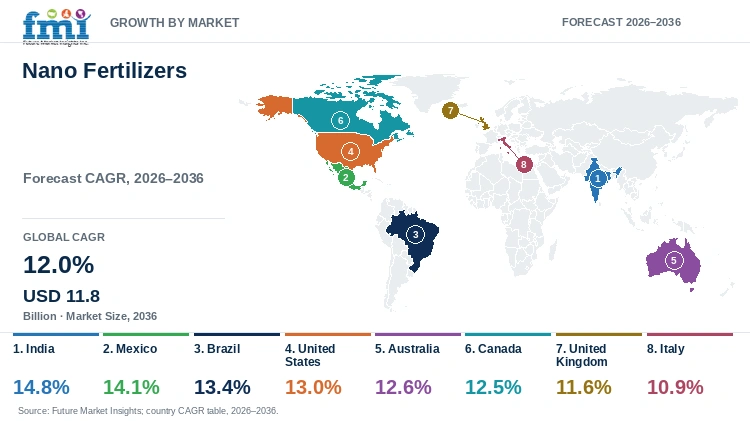
FMI country modeling indicates that India leads global nano fertilizers expansion at a 14.8% CAGR ahead of Mexico at a 14.1% CAGR and Brazil at a 13.4% CAGR through 2036, while Italy advances at a 10.9% CAGR. National growth differences across South Asian cooperative grain corridors, North American broadacre farms, and European precision horticultural zones reflect domestic fertilizer subsidy reforms and drone-spraying regulations.
Table 7: Country CAGR and Primary Growth Levers for the Nano Fertilizers Market (CAGR percentage and operational drivers), 2026 to 2036
| Country | CAGR (2026 to 2036) | Primary Growth Lever |
|---|---|---|
| India | 14.8% | FCO-notified Nano Urea Plus and Nano DAP plants, PM-PRANAM incentives, and cooperative drones |
| Mexico | 14.1% | SADER national smallholder fertilizer program and export vegetable drip-fertigation |
| Brazil | 13.4% | Cerrado soybean and safrinha corn boom spraying to bypass Oxisol phosphorus fixation |
| United States | 13.0% | Corn Belt high-speed planter starter integration and watershed runoff mandates |
| Australia | 12.6% | Broadacre wheat and barley boom-spraying across alkaline calcareous soils |
| Canada | 12.5% | Federal 30% nitrous-oxide emission reduction target and Prairie canola 4R programs |
| United Kingdom | 11.6% | Imported nitrogen cost mitigation and DEFRA Sustainable Farming Incentive payments |
| Italy | 10.9% | Vineyard, olive, and orchard micro-fertigation under EU nutrient-loss reduction rules |
Source: Future Market Insights analysis
Mexico Nano Fertilizers Market Outlook (2026 to 2036)
Demand for nano fertilizers in Mexico is projected to expand at a 14.1% CAGR between 2026 and 2036 across irrigated horticultural export corridors in Sinaloa and Michoacán as well as smallholder corn and bean programs. What distinguishes Mexico from mature Northern Hemisphere grain markets is the dual pull from export-oriented avocado, berry, and tomato drip-fertigation estates and federal smallholder fertilizer distribution initiatives. In October 2026, the USDA Economic Research Service reported that Mexico's Secretariat of Agriculture and Rural Development (SADER) allocates 25.5% of its Special Concurrent Program budget to the national Fertilizer Program supplying up to 600 kilograms of fertilizer per producer across corn and beans [15]. Export vegetable growers and cooperative distributors actively adopt liquid nano-nitrogen and nano-zinc bottles to reduce bulk transport costs across mountainous rural districts.
Key takeaway: In Mexico, export horticultural drip-fertigation and federal smallholder nutrient programs are projected to drive a 14.1% CAGR.
United States Nano Fertilizers Market Outlook (2026 to 2036)
In the United States, nano fertilizers market growth is forecast to reach a 13.0% CAGR through 2036, anchored by precision in-furrow starter programs across Corn Belt row crops and micro-irrigation dosing in California and Florida specialty orchards. Compared with subsidy-driven Asian cooperative markets, American farm adoption is led by large commercial corn and soybean operators integrating liquid nano-phosphorus and nano-zinc into high-speed planter and aerial application passes. North American grain and feed analysis from the USDA Foreign Agricultural Service in March 2026 confirms that commercial cereal and corn producers are prioritizing precision nutrient efficiency to protect farm operating margins [18]. Federal watershed regulations curbing phosphorus and nitrate runoff in the Mississippi Basin and Great Lakes further accelerate conversion toward low-dose nano-liquid formulations.
Key takeaway: In the United States, high-speed planter starter integration and watershed runoff limits are forecast to sustain a 13.0% CAGR.
Australia Nano Fertilizers Market Outlook (2026 to 2036)
Australia's nano fertilizers market is anticipated to advance at a 12.6% CAGR from 2026 to 2036, supported by broadacre wheat and canola foliar spraying across Western Australia and New South Wales. Australian farming diverges from high-rainfall European agriculture because semi-arid alkaline and calcareous soils rapidly lock up conventional granular phosphorus and trace zinc, making foliar nanoparticle absorption highly economical. In October 2026, the USDA Foreign Agricultural Service reported in its Canberra Grain and Feed Update that Australia's 2026/27 barley production is forecast to reach a record 17.7 million metric tons while wheat output reaches 32.0 million metric tons [16]. Large broadacre grain properties utilizing 36-meter self-propelled boom sprayers tank-mix liquid nano-zinc or nano-urea during post-emergent herbicide passes to eliminate separate fertilization runs.
Key takeaway: In Australia, calcareous soil phosphorus lockup and broadacre wheat and barley boom-spraying are anticipated to support a 12.6% CAGR.
Canada Nano Fertilizers Market Outlook (2026 to 2036)
Procurement of nano fertilizers in Canada is estimated to grow at a 12.5% CAGR over the 2026 to 2036 horizon across Prairie canola and spring wheat farms in Saskatchewan and Alberta. What sets Canada apart from global agricultural markets is its federal target to reduce nitrous oxide emissions from synthetic nitrogen fertilizer application by 30% below 2020 levels while expanding high-yielding canola and lentil exports. In September 2026, Statistics Canada released its 2025/2026 Fertilizer Shipments Survey documenting production and inventory trends across Western and Eastern Canadian agricultural provinces [13]. Canadian grain growers pair 4R Nutrient Stewardship practices with seed nano-priming and foliar nano-nitrogen sprays to protect yield during short northern growing seasons.
Key takeaway: In Canada, federal nitrous-oxide emission targets and Prairie canola and wheat precision farming are estimated to propel a 12.5% CAGR.
United Kingdom Nano Fertilizers Market Outlook (2026 to 2036)
United Kingdom nano fertilizers expenditure is slated to progress at an 11.6% CAGR over the 2026 to 2036 forecast period as arable winter wheat, oilseed rape, and sugar beet estates seek high-efficiency alternatives to imported bulk nitrogen. Compared with self-sufficient gas-producing nations, British agriculture relies heavily on imported ammonium nitrate and Urea Ammonium Nitrate solutions exposed to European natural gas volatility. July 2026 trade reporting by USDA Foreign Agricultural Service analysts indicates that the UK Department for Business and Trade suspended import tariffs on Urea Ammonium Nitrate and 21 agricultural products through December 2028 to relieve farm input cost pressures [14]. Furthermore, DEFRA Sustainable Farming Incentive payments reward British growers for adopting precision foliar nano-nitrogen and micronutrient sprays that minimize nitrate leaching in Nitrate Vulnerable Zones.
Key takeaway: In the United Kingdom, imported nitrogen cost exposure and DEFRA sustainable farming incentives are slated to anchor an 11.6% CAGR.
Italy Nano Fertilizers Market Outlook (2026 to 2036)
Sales of nano fertilizers in Italy are predicted to expand at a 10.9% CAGR through 2036, driven by high-value wine vineyards and greenhouse horticulture across the Po Valley and Sicily. Italy differs from broadacre North American grain markets through its high concentration of drip-irrigated specialty crops and strict European Union Farm to Fork nutrient-loss reduction targets. Technical product documentation from Coromandel International Limited in 2025 highlights how 100% water-soluble foliar and drip-fertigation micronutrient blends containing zinc, iron, and boron boost photosynthetic activity and fruit grade in horticultural crops [20]. Italian viticulturists and orchard managers integrate nano-iron, nano-calcium, and nano-potassium colloids into automated micro-fertigation lines to prevent ferric chlorosis and fruit cracking.
Key takeaway: In Italy, vineyard and orchard micro-fertigation and EU nutrient-loss rules are predicted to sustain a 10.9% CAGR.
India Nano Fertilizers Market Outlook (2026 to 2036)
India's nano fertilizers market is expected to advance at a world-leading 14.8% CAGR between 2026 and 2036, anchored by the world's largest installed liquid Nano Urea and Nano DAP manufacturing base and the federal PM-PRANAM subsidy-reduction scheme. What distinguishes India from every other national market is direct Fertilizer Control Order regulatory notification of Nano Urea Plus, Nano DAP, and trace nano-nutrients supported by cooperative distribution across more than 100,000 village societies. Corporate production records from Indian Farmers Fertiliser Cooperative Limited confirm that IFFCO's Kalol, Aonla, and Phulpur nano-biotechnology plants supply millions of 500-milliliter bottles domestically and to over 40 export markets [19]. State agricultural universities and village cooperatives also deploy custom spray drones to accelerate foliar adoption across Kharif and Rabi rice and wheat seasons.
Key takeaway: In India, sovereign Fertilizer Control Order approvals and cooperative drone spraying are expected to drive a 14.8% CAGR.
Brazil Nano Fertilizers Market Outlook (2026 to 2036)
Consumption of nano fertilizers in Brazil is projected to climb at a 13.4% CAGR from 2026 to 2036 as Mato Grosso and Paraná soybean and safrinha corn megafarms reduce their 85% reliance on imported bulk NPK granules. Compared with fragmented smallholder regions, Brazilian cerrado estates operate fleets of high-clearance self-propelled sprayers and agricultural aircraft that apply foliar nano-nitrogen and nano-molybdenum across thousands of hectares per day. Corporate sustainability disclosures in ICL Group Ltd.'s 2025-2026 report confirm that ICL has expanded its foliar and precision micronutrient formulation footprint across Brazil and global agricultural hubs to combat tropical soil phosphorus fixation [21]. Application of foliar nano-phosphorus with biological nitrogen-fixing inoculants protects soybean yields across acidic Oxisol soils.
Key takeaway: In Brazil, tropical Oxisol phosphorus fixation and megafarm aerial and boom spraying are projected to support a 13.4% CAGR.
Full report country CAGRs cover: North America; Latin America; Western Europe; Eastern Europe; East Asia; South Asia and Pacific; Middle East and Africa.
Who are the notable companies in the nano fertilizers market?
Indian Farmers Fertiliser Cooperative Limited (IFFCO), Lazur AG, Nanmax AG, Tropical Agrosystem India Pvt Ltd, JU Agri Sciences Pvt Ltd, Bio-Nano Agritech Inc., Agri-Nano Solutions International, Coromandel International Limited, ICL Group Ltd., and Yara International ASA are the notable companies in the nano fertilizers market.
Competitive positioning in the nano fertilizers industry spans large-scale cooperative and corporate nano-urea and nano-DAP manufacturers, European and international nanoscale mineral technology innovators, and global specialty plant-nutrition groups. IFFCO and Coromandel International Limited as well as Tropical Agrosystem and JU Agri Sciences manufacture commercial liquid nano-macronutrient bottles at industrial scale. Lazur AG and Nanmax AG along with Bio-Nano Agritech Inc. and Agri-Nano Solutions International engineer colloidal mineral nanocrystals. Global groups ICL Group Ltd. and Yara International supply foliar micronutrient portfolios.
- Commercial Liquid Nano-Macronutrient and Cooperative Leaders: IFFCO and Coromandel International Limited as well as Tropical Agrosystem India Pvt Ltd and JU Agri Sciences Pvt Ltd produce FCO-notified liquid Nano Urea and Nano DAP formulations.
- Nanoscale Mineral Colloid and Carbon-Carrier Innovators: Lazur AG and Nanmax AG along with Bio-Nano Agritech Inc. and Agri-Nano Solutions International develop sub-100-nanometer mineral nanocrystals and seed nano-priming colloids.
- Global Specialty Foliar and Precision Plant-Nutrition Groups: ICL Group Ltd. and Yara International ASA operate global foliar suspension and precision fertigation distribution networks across Europe, the Americas, and Asia.
Competitive Benchmarking: Nano Fertilizers Market
Table 8: Competitive Benchmarking for the Nano Fertilizers Market (qualitative capability ratings), 2026
| Company | Sub-100nm Colloidal Stability & IP | Agronomic Field Trial & Drone Support | Multi-Nutrient & Foliar Portfolio Breadth | Geographic Reach |
|---|---|---|---|---|
| IFFCO | High | High | High | Global cooperative leader; Kalol, Aonla, and Phulpur Nano Urea and Nano DAP plants |
| Lazur AG | High | Medium | Medium | European mineral nanocrystal and foliar photosynthetic enhancer formulations |
| Nanmax AG | High | Medium | Medium | European precision nanoscale crop nutrition and colloidal trace-element suspensions |
| Tropical Agrosystem India | High | High | High | Pan-Indian biological, micronutrient, and nano-enabled crop nutrition network |
| JU Agri Sciences Pvt Ltd | Medium | High | High | Indian agrochemical, biofertilizer, and foliar nano-nutrient retail distribution |
| Bio-Nano Agritech Inc. | High | Medium | Medium | North American biopolymer-encapsulated nano-nutrient and seed-priming solutions |
| Agri-Nano Solutions Int. | Medium | Medium | Medium | International foliar nano-chelated micronutrient and fertigation concentrates |
| Coromandel International | High | High | High | Indian Nano DAP, Gromor foliar micronutrients, and rural drone-spraying centers |
| ICL Group Ltd. | High | High | High | Global specialty foliar, fertigation, and controlled-release fertilizers across 30+ countries |
| Yara International ASA | High | High | High | Global YaraVita foliar suspensions, biostimulants, and digital crop nutrition tools |
Capability ratings: Sub-100nm Colloidal Stability & IP evaluates patented biopolymer surface functionalization and 24-month shelf stability without sedimentation, while Agronomic Field Trial & Drone Support rates multi-zone crop validation and spray-drone calibration networks. Multi-Nutrient & Foliar Portfolio Breadth measures commercial availability across macronutrient, trace-element, and biochar-hybrid nano-suspensions.
Key Developments in the Nano Fertilizers Market
- Nutrien Ltd. reported in August 2026 that its proprietary Loveland Products specialty crop nutrition, foliar micronutrient, and starter fertilizer lines delivered strong second-quarter 2026 adoption across North American row crops [22].
- Yara International ASA reported in April 2026 that first-quarter 2026 EBITDA rose to USD 896 million from USD 638 million a year earlier as farmers increased procurement of high-efficiency YaraVita foliar micronutrients and specialty fertilizers [23].
- The Mosaic Company's Mosaic Biosciences business launched its Neptunion stress-resistant water-soluble fertilizer and biostimulant product in May 2025 to improve crop nutrient use efficiency under drought and salinity stress [24].
Key Players in the Nano Fertilizers Market
Commercial Liquid Nano-Macronutrient and Cooperative Leaders
- Indian Farmers Fertiliser Cooperative Limited (IFFCO)
- Coromandel International Limited
- Tropical Agrosystem India Pvt Ltd
- JU Agri Sciences Pvt Ltd
Nanoscale Mineral Colloid and Carbon-Carrier Innovators
- Lazur AG
- Nanmax AG
- Bio-Nano Agritech Inc.
- Agri-Nano Solutions International
Global Specialty Foliar and Precision Plant-Nutrition Groups
- ICL Group Ltd.
- Yara International ASA
Nano Fertilizers Market - Report Scope
Table 9: Report Scope for the Nano Fertilizers Market (coverage fields and definitions), 2026 to 2036
| Coverage field | Report scope |
|---|---|
| Market breakdown | Nutrient Formulation; Application Method; Crop Type; Physical Form; Distribution Channel |
| Quantitative Units | USD Billion |
| Market Definition | Includes commercial supplier revenue from engineered sub-100-nanometer macronutrient (nitrogen, phosphorus, potassium), micronutrient (zinc, copper, iron, boron, manganese), and carbon/biochar-carrier fertilizer formulations applied via foliar spray, fertigation, seed priming, or root-zone dosing. Category Scope Note: Excludes conventional prilled/granular urea, bulk DAP/MOP, and non-nanoscale water-soluble NPK salts. |
| Regions Covered | North America; Latin America; Western Europe; Eastern Europe; East Asia; South Asia and Pacific; Middle East and Africa |
| Countries Covered | India, Mexico, Brazil, United States, Australia, Canada, United Kingdom, Italy, and additional countries in the full report |
| Key Companies Covered | Indian Farmers Fertiliser Cooperative Limited (IFFCO), Lazur AG, Nanmax AG, Tropical Agrosystem India Pvt Ltd, JU Agri Sciences Pvt Ltd, Bio-Nano Agritech Inc., Agri-Nano Solutions International, Coromandel International Limited, ICL Group Ltd., Yara International ASA |
| Forecast Period | 2026 to 2036 |
| Approach | Primary and secondary research with top-down and bottom-up bottle-and-acreage triangulation. |
Nano Fertilizers Market - Research Methodology
Table 10: Research Methodology for the Nano Fertilizers Market (research methods and approach), 2026 edition
| Method | Approach |
|---|---|
| Primary Research | Structured interviews with cooperative fertilizer formulation directors, ICAR and land-grant university agronomists, commercial drone-spraying service operators, and horticultural fertigation managers. |
| Secondary Research | Analysis of Government of India PIB Department of Fertilizers releases, FAO and World Bank fertilizer outlooks, Statistics Canada and USDA FAS/ERS reports, and peer-reviewed agronomy journals. |
| Market Sizing and Forecasting | Top-down global specialty and foliar fertilizer baselines reconciled against bottom-up 500 ml bottle production capacity, treated crop hectares (160M to 178M ha in 2026), and per-acre dosing schedules from 2026 to 2036. |
| Country Forecasting Model | Econometric national projections weight sovereign nano-fertilizer notifications, urea subsidy reforms, calcareous/Oxisol soil fixation intensity, and agricultural drone fleets across eight countries. |
| Operational Benchmark Traceability | Bottle dispatch, field trial, and treated-acreage indicators in Tables 2, 3, and 4 trace to PIB March 2026 parliamentary disclosures, ICAR-KVK trial registries, and peer-reviewed foliar efficiency assays. |
| Data Triangulation and Validation | Revenue estimates isolate sub-100nm colloidal, powder, and nano-encapsulated fertilizers while strictly excluding bulk commodity fertilizers, standard chelates, and standalone pesticides. |
Nano Fertilizers Market by Segments
Nano Fertilizers Market segmented by Nutrient Formulation:
- Nano Nitrogen Liquid Urea Nanoparticles
- Nano Phosphorus and Phosphate Nanocrystals
- Nano Potassium Formulations
- Nano Micronutrients and Carbon-Based Nano Biochar Stimulants
Nano Fertilizers Market segmented by Application Method:
- Foliar Spray Precision Droplet Spraying
- Fertigation Drip and Micro-Irrigation Dosing
- Seed Soaking and Nanoparticle Priming
- Soil Hydroponic Root Zone Application
Nano Fertilizers Market segmented by Crop Type:
- Cereal Grains Rice, Wheat, and Corn
- Oilseeds and Pulses Soybeans, Canola, and Lentils
- High-Value Horticultural Fruits, Vegetables, and Vineyards
- Plantation Cash Crops Tea, Coffee, and Sugarcane
- Turf, Ornamentals, and Controlled-Environment Forage
Nano Fertilizers Market segmented by Physical Form:
- Liquid Colloidal Suspension
- Water-Dispersible Nano Powder
- Nano-Encapsulated Granules
- Effervescent Tablet and Gel Nano Concentrates
Nano Fertilizers Market segmented by Distribution Channel:
- Agricultural Cooperatives and Dealer Networks
- Direct Institutional and Commercial Farm Supply
- Agrochemical Retail Stores
- Digital Ag-Input Platforms
Nano Fertilizers Market by Region
- North America
- United States
- Canada
- Latin America
- Brazil
- Mexico
- Argentina
- Chile
- Western Europe
- Germany
- France
- United Kingdom
- Italy
- Spain
- Benelux
- Nordics
- Eastern Europe
- Poland
- Czech Republic
- Romania
- Hungary
- East Asia
- China
- Japan
- South Korea
- South Asia and Pacific
- India
- ASEAN
- Australia and New Zealand
- Middle East and Africa
- GCC Countries
- South Africa
- Türkiye
- Israel
Research Sources and Bibliography
- [1] Press Information Bureau, Government of India. (2026, March 20). Government Highlights Significant Progress in Nano-Fertilizer Production and Adoption Across Nano Urea and Nano DAP. Ministry of Chemicals and Fertilizers, Government of India.
- [2] Press Information Bureau, Government of India. (2026, March 27). PM-PRANAM Launched to Promote Sustainable Fertilizer Use and ICAR-KVK Nano Urea and Nano DAP Farmer Field Trials. Department of Fertilizers, Ministry of Chemicals and Fertilizers.
- [3] Sharma, A., & Verma, R. (2026, March 25). Novel Developments in Nano Fertilizer for Sustainable Crop Production: Nano Urea Plus, Nano DAP, and Micronutrients. Sustainability, 18(7), 3198 (MDPI Open Access).
- [4] Chen, L., & Martinez, D. (2026, November 4). Nano-Enabled Precision Fertilization: A Critical Scoping Review of UAV Sensing and Targeted Nanoparticle Delivery. Agrochemicals, 5(4), 50 (MDPI Open Access).
- [5] Singh, P., & Kumar, V. (2025, September 14). Nano-urea driven improvements in nitrogen efficiency, biochemical properties, and wheat grain yield. Frontiers in Sustainable Food Systems, 9, 1670081.
- [6] Subramani, K., & Balakrishnan, N. (2026, June 18). Response of potato (Solanum tuberosum) and cereal crops to nano-DAP and nano-phosphorus foliar and soil application. Frontiers in Agronomy, 8, 1841220.
- [7] Hassan, M., & Al-Zahrani, S. (2026, April 22). Seed nano-priming with potassium silicate and zinc oxide nanoparticles mitigates abiotic stress and enhances crop vigor. Frontiers in Agronomy, 8, 1806269.
- [8] Zehra, A., & Meena, R. (2026, October 21). Nano biofertilizer: a sustainable blueprint for restoring soil fertility and boosting seed germination with iron oxide nanoparticles. Frontiers in Plant Science, 17, 1894680.
- [9] Gomez, E., & Silva, T. (2025, August 5). ZnO Nanoparticles: Advancing Agricultural Sustainability and Foliar Micronutrient Bioavailability Under Abiotic Stress. Plants, 14(15), 2430 (MDPI Open Access).
- [10] Wang, Y., & Liu, H. (2025, April 30). Biochar-Based Fertilizers: Advancements, Sustained Phosphorus and Potassium Release, and Future Prospects. Agronomy, 15(5), 1104 (MDPI Open Access).
- [11] Food and Agriculture Organization of the United Nations. (2025, November 12). Fertilizer Market Developments: Global Nitrogen, Phosphorus, and Potassium Production and Trade Outlook. Food and Agriculture Organization (FAO) Knowledge Repository.
- [12] World Bank. (2026, October 28). Commodity Markets Outlook October 2026: Global Agricultural Inputs and 2026 Fertilizer Price Projections. The World Bank Group Washington, D.C.
- [13] Statistics Canada. (2026, September 17). Fertilizer Shipments Survey, Third and Fourth Quarters 2025/2026: Canadian Production and Market Inventories. Government of Canada, Statistics Canada.
- [14] USDA Foreign Agricultural Service. (2026, July 20). United Kingdom Tariff Suspensions on Urea Ammonium Nitrate Fertilizer and Agricultural Inputs: July 2026 Update. U.S. Department of Agriculture GAIN Report UK2026-0020.
- [15] USDA Economic Research Service. (2026, October 8). USMCA, Canada, and Mexico Agricultural Policy: SADER National Fertilizer Program Budget Allocation. U.S. Department of Agriculture Economic Research Service.
- [16] USDA Foreign Agricultural Service. (2026, October 23). Australia Grain and Feed Update: Record Barley and Wheat Production and Crop Nutrition Outlook. U.S. Department of Agriculture GAIN Report AS2026-0023.
- [17] Food and Agriculture Organization of the United Nations. (2025, October 15). Agricultural Markets and Trade Analysis: Global Fertilizer Use and Agronomic Input Efficiency. FAO Markets and Trade Division Rome.
- [18] USDA Foreign Agricultural Service. (2026, March 18). Grain and Feed Annual: North American Cereal Production and Fertilizer Input Management. U.S. Department of Agriculture GAIN Report MX2026-0018.
- [19] Indian Farmers Fertiliser Cooperative Limited. (2026, April 10). IFFCO Statistics and Financial Reports: Nano Urea and Nano DAP Manufacturing Plants and Distribution. Indian Farmers Fertiliser Cooperative Limited (IFFCO) New Delhi.
- [20] Coromandel International Limited. (2025, April 15). Specialty Nutrients, Foliar Micronutrients, and Drip Fertigation Crop Nutrition Portfolio Update. Coromandel International Limited Technical Publications.
- [21] ICL Group Ltd. (2026, June 12). ICL 2025-2026 ESG and Specialty Agriculture Report: Foliar Fertilizers and Precision Crop Nutrition. ICL Group Ltd. Tel Aviv.
- [22] Nutrien Ltd. (2026, August 5). Nutrien Reports Second Quarter 2026 Results Highlighting Proprietary Crop Nutrients and Retail Performance. Nutrien Ltd. Investor Relations.
- [23] Yara International ASA. (2026, April 24). Yara Reports Increased Margins and Strong Specialty Fertilizer and Foliar Volumes in First Quarter 2026. Yara International ASA Corporate Releases.
- [24] The Mosaic Company. (2025, May 6). Mosaic Biosciences Launches Neptunion Abiotic-Stress Water-Soluble Fertilizer Formulation. The Mosaic Company Investor Relations.
This bibliography is provided for reader reference and is not exhaustive. The full report contains the complete reference list and detailed citations.
This Report Answers
- How large is the nano fertilizers market in 2026 and what is forecast for 2036?
- Which bulk-fertilizer subsidy reforms and drone-spraying trends support demand for nano fertilizers?
- Why do Nano Nitrogen Liquid Urea Nanoparticles lead the nutrient formulation category?
- Why does Foliar Spray Precision Droplet Spraying lead the application method category globally?
- How do national growth rates compare across India, Mexico, and the United States?
- Which leading companies supply liquid Nano Urea and Nano DAP versus colloidal mineral nanocrystals today?
- What basal soil-nutrition requirements and regulatory toxicity dossiers challenge the nano fertilizers market?
- What should farm cooperatives and growers evaluate before integrating foliar nano fertilizers into crop programs?
Table of Content
- Key Takeaways
- Market Size and CAGR
- Top Growth Driver
- Fastest Growing Segment
- Leading Region
- Key Companies
- Emerging Opportunities
- Executive Summary
- Global Market Outlook
- Demand-side Trends
- Supply-side Trends
- Technology Roadmap Analysis
- Analysis and Recommendations
- Analyst Perspective (What is happening? Why now? What should investors know?)
- Key Questions Answered
- How large is the market?
- What is the CAGR?
- What are key trends?
- Which region dominates?
- Who are the leaders?
Read More...
- Market Overview
- Market Coverage / Taxonomy
- Market Definition / Scope / Limitations
- Research Methodology
- Chapter Orientation
- Analytical Lens and Working Hypotheses
- Market Structure, Signals, and Trend Drivers
- Benchmarking and Cross-market Comparability
- Market Sizing, Forecasting, and Opportunity Mapping
- Research Design and Evidence Framework
- Desk Research Programme (Secondary Evidence)
- Expert Input and Fieldwork (Primary Evidence)
- Tooling, Models, and Reference Databases
- Data Engineering and Model Build
- Quality Assurance and Audit Trail
- Market Background
- Market Dynamics (Drivers, Restraints, Opportunity, Trends)
- Scenario Forecast (Optimistic, Likely, Conservative)
- Impact Analysis
- AI Impact
- Sustainability Impact
- Regulatory Impact
- Technology Impact
- Consumer / Buyer Analysis
- Purchase Drivers
- Adoption Barriers
- Buyer Journey
- Opportunity Map Analysis
- Product Life Cycle Analysis
- Supply Chain Analysis
- Investment Feasibility Matrix
- Value Chain Analysis
- PESTLE and Porter's Analysis
- Regulatory Landscape
- Regional Parent Market Outlook
- Production and Consumption Statistics
- Import and Export Statistics
- Global Market Analysis and Forecast, 2021 to 2036
- Historical Market Size Value (USD Billion) Analysis, 2021 to 2025
- Current and Future Market Size Value (USD Billion) Projections, 2026 to 2036
- Y-o-Y Growth Trend Analysis
- Absolute $ Opportunity Analysis
- Global Market Pricing Analysis, 2021 to 2036
- Global Market Analysis and Forecast, By Nutrient Formulation, 2021 to 2036
- Introduction / Key Findings
- Historical Market Size Value (USD Billion) Analysis By Nutrient Formulation, 2021 to 2025
- Current and Future Market Size Value (USD Billion) Analysis and Forecast By Nutrient Formulation, 2026 to 2036
- Nano Nitrogen Liquid Urea Nanoparticles
- Nano Phosphorus and Phosphate Nanocrystals
- Nano Potassium Formulations
- Nano Micronutrients and Carbon-Based Nano Biochar Stimulants
- Y-o-Y Growth Trend Analysis By Nutrient Formulation, 2021 to 2025
- Absolute $ Opportunity Analysis By Nutrient Formulation, 2026 to 2036
- Global Market Analysis and Forecast, By Application Method, 2021 to 2036
- Introduction / Key Findings
- Historical Market Size Value (USD Billion) Analysis By Application Method, 2021 to 2025
- Current and Future Market Size Value (USD Billion) Analysis and Forecast By Application Method, 2026 to 2036
- Foliar Spray Precision Droplet Spraying
- Fertigation Drip and Micro-Irrigation Dosing
- Seed Soaking and Nanoparticle Priming
- Soil Hydroponic Root Zone Application
- Y-o-Y Growth Trend Analysis By Application Method, 2021 to 2025
- Absolute $ Opportunity Analysis By Application Method, 2026 to 2036
- Global Market Analysis and Forecast, By Crop Type, 2021 to 2036
- Introduction / Key Findings
- Historical Market Size Value (USD Billion) Analysis By Crop Type, 2021 to 2025
- Current and Future Market Size Value (USD Billion) Analysis and Forecast By Crop Type, 2026 to 2036
- Cereal Grains Rice, Wheat, and Corn
- Oilseeds and Pulses Soybeans, Canola, and Lentils
- High-Value Horticultural Fruits, Vegetables, and Vineyards
- Plantation Cash Crops Tea, Coffee, and Sugarcane
- Turf, Ornamentals, and Controlled-Environment Forage
- Y-o-Y Growth Trend Analysis By Crop Type, 2021 to 2025
- Absolute $ Opportunity Analysis By Crop Type, 2026 to 2036
- Global Market Analysis and Forecast, By Physical Form, 2021 to 2036
- Introduction / Key Findings
- Historical Market Size Value (USD Billion) Analysis By Physical Form, 2021 to 2025
- Current and Future Market Size Value (USD Billion) Analysis and Forecast By Physical Form, 2026 to 2036
- Liquid Colloidal Suspension
- Water-Dispersible Nano Powder
- Nano-Encapsulated Granules
- Effervescent Tablet and Gel Nano Concentrates
- Y-o-Y Growth Trend Analysis By Physical Form, 2021 to 2025
- Absolute $ Opportunity Analysis By Physical Form, 2026 to 2036
- Global Market Analysis and Forecast, By Distribution Channel, 2021 to 2036
- Introduction / Key Findings
- Historical Market Size Value (USD Billion) Analysis By Distribution Channel, 2021 to 2025
- Current and Future Market Size Value (USD Billion) Analysis and Forecast By Distribution Channel, 2026 to 2036
- Agricultural Cooperatives and Dealer Networks
- Direct Institutional and Commercial Farm Supply
- Agrochemical Retail Stores
- Digital Ag-Input Platforms
- Y-o-Y Growth Trend Analysis By Distribution Channel, 2021 to 2025
- Absolute $ Opportunity Analysis By Distribution Channel, 2026 to 2036
- Global Market Analysis and Forecast, By Region, 2021 to 2036
- Introduction
- Historical Market Size Value (USD Billion) Analysis By Region, 2021 to 2025
- Current Market Size Value (USD Billion) Analysis and Forecast By Region, 2026 to 2036
- North America
- Latin America
- Western Europe
- Eastern Europe
- East Asia
- South Asia and Pacific
- Middle East and Africa
- Market Attractiveness Analysis By Region
- North America Market Analysis and Forecast, By Country, 2021 to 2036
- Historical Market Size Value (USD Billion) Trend Analysis By Market Taxonomy, 2021 to 2025
- Market Size Value (USD Billion) Forecast By Market Taxonomy, 2026 to 2036
- By Country
- United States
- Canada
- By Nutrient Formulation
- By Application Method
- By Crop Type
- By Physical Form
- By Distribution Channel
- By Country
- Market Attractiveness Analysis
- By Country
- By Nutrient Formulation
- By Application Method
- By Crop Type
- By Physical Form
- By Distribution Channel
- Key Takeaways
- Latin America Market Analysis and Forecast, By Country
- Historical Market Size Value (USD Billion) Trend Analysis By Market Taxonomy, 2021 to 2025
- Market Size Value (USD Billion) Forecast By Market Taxonomy, 2026 to 2036
- By Country
- Brazil
- Mexico
- Argentina
- Chile
- By Nutrient Formulation
- By Application Method
- By Crop Type
- By Physical Form
- By Distribution Channel
- By Country
- Market Attractiveness Analysis
- By Country
- By Nutrient Formulation
- By Application Method
- By Crop Type
- By Physical Form
- By Distribution Channel
- Key Takeaways
- Western Europe Market Analysis and Forecast, By Country
- Historical Market Size Value (USD Billion) Trend Analysis By Market Taxonomy, 2021 to 2025
- Market Size Value (USD Billion) Forecast By Market Taxonomy, 2026 to 2036
- By Country
- Germany
- France
- United Kingdom
- Italy
- Spain
- Benelux
- Nordics
- By Nutrient Formulation
- By Application Method
- By Crop Type
- By Physical Form
- By Distribution Channel
- By Country
- Market Attractiveness Analysis
- By Country
- By Nutrient Formulation
- By Application Method
- By Crop Type
- By Physical Form
- By Distribution Channel
- Key Takeaways
- Eastern Europe Market Analysis and Forecast, By Country
- Historical Market Size Value (USD Billion) Trend Analysis By Market Taxonomy, 2021 to 2025
- Market Size Value (USD Billion) Forecast By Market Taxonomy, 2026 to 2036
- By Country
- Poland
- Czech Republic
- Romania
- Hungary
- By Nutrient Formulation
- By Application Method
- By Crop Type
- By Physical Form
- By Distribution Channel
- By Country
- Market Attractiveness Analysis
- By Country
- By Nutrient Formulation
- By Application Method
- By Crop Type
- By Physical Form
- By Distribution Channel
- Key Takeaways
- East Asia Market Analysis and Forecast, By Country
- Historical Market Size Value (USD Billion) Trend Analysis By Market Taxonomy, 2021 to 2025
- Market Size Value (USD Billion) Forecast By Market Taxonomy, 2026 to 2036
- By Country
- China
- Japan
- South Korea
- By Nutrient Formulation
- By Application Method
- By Crop Type
- By Physical Form
- By Distribution Channel
- By Country
- Market Attractiveness Analysis
- By Country
- By Nutrient Formulation
- By Application Method
- By Crop Type
- By Physical Form
- By Distribution Channel
- Key Takeaways
- South Asia and Pacific Market Analysis and Forecast, By Country
- Historical Market Size Value (USD Billion) Trend Analysis By Market Taxonomy, 2021 to 2025
- Market Size Value (USD Billion) Forecast By Market Taxonomy, 2026 to 2036
- By Country
- India
- ASEAN
- Australia and New Zealand
- By Nutrient Formulation
- By Application Method
- By Crop Type
- By Physical Form
- By Distribution Channel
- By Country
- Market Attractiveness Analysis
- By Country
- By Nutrient Formulation
- By Application Method
- By Crop Type
- By Physical Form
- By Distribution Channel
- Key Takeaways
- Middle East and Africa Market Analysis and Forecast, By Country
- Historical Market Size Value (USD Billion) Trend Analysis By Market Taxonomy, 2021 to 2025
- Market Size Value (USD Billion) Forecast By Market Taxonomy, 2026 to 2036
- By Country
- GCC Countries
- South Africa
- Türkiye
- Israel
- By Nutrient Formulation
- By Application Method
- By Crop Type
- By Physical Form
- By Distribution Channel
- By Country
- Market Attractiveness Analysis
- By Country
- By Nutrient Formulation
- By Application Method
- By Crop Type
- By Physical Form
- By Distribution Channel
- Key Takeaways
- Key Countries Market Analysis
- United States
- Pricing Analysis
- Market Share Analysis, 2025
- By Nutrient Formulation
- By Application Method
- By Crop Type
- By Physical Form
- By Distribution Channel
- Canada
- Pricing Analysis
- Market Share Analysis, 2025
- By Nutrient Formulation
- By Application Method
- By Crop Type
- By Physical Form
- By Distribution Channel
- Mexico
- Pricing Analysis
- Market Share Analysis, 2025
- By Nutrient Formulation
- By Application Method
- By Crop Type
- By Physical Form
- By Distribution Channel
- Brazil
- Pricing Analysis
- Market Share Analysis, 2025
- By Nutrient Formulation
- By Application Method
- By Crop Type
- By Physical Form
- By Distribution Channel
- Chile
- Pricing Analysis
- Market Share Analysis, 2025
- By Nutrient Formulation
- By Application Method
- By Crop Type
- By Physical Form
- By Distribution Channel
- Germany
- Pricing Analysis
- Market Share Analysis, 2025
- By Nutrient Formulation
- By Application Method
- By Crop Type
- By Physical Form
- By Distribution Channel
- United Kingdom
- Pricing Analysis
- Market Share Analysis, 2025
- By Nutrient Formulation
- By Application Method
- By Crop Type
- By Physical Form
- By Distribution Channel
- Italy
- Pricing Analysis
- Market Share Analysis, 2025
- By Nutrient Formulation
- By Application Method
- By Crop Type
- By Physical Form
- By Distribution Channel
- Spain
- Pricing Analysis
- Market Share Analysis, 2025
- By Nutrient Formulation
- By Application Method
- By Crop Type
- By Physical Form
- By Distribution Channel
- France
- Pricing Analysis
- Market Share Analysis, 2025
- By Nutrient Formulation
- By Application Method
- By Crop Type
- By Physical Form
- By Distribution Channel
- India
- Pricing Analysis
- Market Share Analysis, 2025
- By Nutrient Formulation
- By Application Method
- By Crop Type
- By Physical Form
- By Distribution Channel
- ASEAN
- Pricing Analysis
- Market Share Analysis, 2025
- By Nutrient Formulation
- By Application Method
- By Crop Type
- By Physical Form
- By Distribution Channel
- Australia and New Zealand
- Pricing Analysis
- Market Share Analysis, 2025
- By Nutrient Formulation
- By Application Method
- By Crop Type
- By Physical Form
- By Distribution Channel
- China
- Pricing Analysis
- Market Share Analysis, 2025
- By Nutrient Formulation
- By Application Method
- By Crop Type
- By Physical Form
- By Distribution Channel
- Japan
- Pricing Analysis
- Market Share Analysis, 2025
- By Nutrient Formulation
- By Application Method
- By Crop Type
- By Physical Form
- By Distribution Channel
- South Korea
- Pricing Analysis
- Market Share Analysis, 2025
- By Nutrient Formulation
- By Application Method
- By Crop Type
- By Physical Form
- By Distribution Channel
- Poland
- Pricing Analysis
- Market Share Analysis, 2025
- By Nutrient Formulation
- By Application Method
- By Crop Type
- By Physical Form
- By Distribution Channel
- Hungary
- Pricing Analysis
- Market Share Analysis, 2025
- By Nutrient Formulation
- By Application Method
- By Crop Type
- By Physical Form
- By Distribution Channel
- Türkiye
- Pricing Analysis
- Market Share Analysis, 2025
- By Nutrient Formulation
- By Application Method
- By Crop Type
- By Physical Form
- By Distribution Channel
- South Africa
- Pricing Analysis
- Market Share Analysis, 2025
- By Nutrient Formulation
- By Application Method
- By Crop Type
- By Physical Form
- By Distribution Channel
- Australia
- Pricing Analysis
- Market Share Analysis, 2025
- By Nutrient Formulation
- By Application Method
- By Crop Type
- By Physical Form
- By Distribution Channel
- United States
- Market Structure Analysis
- Competition Dashboard
- Competition Benchmarking
- Market Share Analysis of Top Players
- By Regional
- By Nutrient Formulation
- By Application Method
- By Crop Type
- By Physical Form
- By Distribution Channel
- Emerging Startups
- Innovation Benchmarking
- Competition Analysis
- Competition Deep Dive
- IFFCO
- Overview
- Product Portfolio
- Profitability by Market Segments
- Sales Footprint
- Strategy Overview
- Marketing Strategy
- Product Strategy
- Channel Strategy
- Lazur AG
- Nanmax AG
- Tropical Agrosystem India
- JU Agri Sciences Pvt Ltd
- Bio-Nano Agritech Inc.
- Agri-Nano Solutions Int.
- Coromandel International
- ICL Group Ltd.
- Yara International ASA
- Indian Farmers Fertiliser Cooperative Limited (IFFCO)
- Coromandel International Limited
- Tropical Agrosystem India Pvt Ltd
- Agri-Nano Solutions International
- IFFCO
- Case Studies
- Success Stories
- Recent Developments
- Competition Deep Dive
- Assumptions & Acronyms Used
List of Tables
- Table 1: Global Market Value (USD Billion) Forecast by Region, 2021 to 2036
- Table 2: Global Market Value (USD Billion) Forecast by Nutrient Formulation, 2021 to 2036
- Table 3: Global Market Value (USD Billion) Forecast by Application Method, 2021 to 2036
- Table 4: Global Market Value (USD Billion) Forecast by Crop Type, 2021 to 2036
- Table 5: Global Market Value (USD Billion) Forecast by Physical Form, 2021 to 2036
- Table 6: Global Market Value (USD Billion) Forecast by Distribution Channel, 2021 to 2036
- Table 7: North America Market Value (USD Billion) Forecast by Country, 2021 to 2036
- Table 8: North America Market Value (USD Billion) Forecast by Nutrient Formulation, 2021 to 2036
- Table 9: North America Market Value (USD Billion) Forecast by Application Method, 2021 to 2036
- Table 10: North America Market Value (USD Billion) Forecast by Crop Type, 2021 to 2036
- Table 11: North America Market Value (USD Billion) Forecast by Physical Form, 2021 to 2036
- Table 12: North America Market Value (USD Billion) Forecast by Distribution Channel, 2021 to 2036
- Table 13: Latin America Market Value (USD Billion) Forecast by Country, 2021 to 2036
- Table 14: Latin America Market Value (USD Billion) Forecast by Nutrient Formulation, 2021 to 2036
- Table 15: Latin America Market Value (USD Billion) Forecast by Application Method, 2021 to 2036
- Table 16: Latin America Market Value (USD Billion) Forecast by Crop Type, 2021 to 2036
- Table 17: Latin America Market Value (USD Billion) Forecast by Physical Form, 2021 to 2036
- Table 18: Latin America Market Value (USD Billion) Forecast by Distribution Channel, 2021 to 2036
- Table 19: Western Europe Market Value (USD Billion) Forecast by Country, 2021 to 2036
- Table 20: Western Europe Market Value (USD Billion) Forecast by Nutrient Formulation, 2021 to 2036
- Table 21: Western Europe Market Value (USD Billion) Forecast by Application Method, 2021 to 2036
- Table 22: Western Europe Market Value (USD Billion) Forecast by Crop Type, 2021 to 2036
- Table 23: Western Europe Market Value (USD Billion) Forecast by Physical Form, 2021 to 2036
- Table 24: Western Europe Market Value (USD Billion) Forecast by Distribution Channel, 2021 to 2036
- Table 25: Eastern Europe Market Value (USD Billion) Forecast by Country, 2021 to 2036
- Table 26: Eastern Europe Market Value (USD Billion) Forecast by Nutrient Formulation, 2021 to 2036
- Table 27: Eastern Europe Market Value (USD Billion) Forecast by Application Method, 2021 to 2036
- Table 28: Eastern Europe Market Value (USD Billion) Forecast by Crop Type, 2021 to 2036
- Table 29: Eastern Europe Market Value (USD Billion) Forecast by Physical Form, 2021 to 2036
- Table 30: Eastern Europe Market Value (USD Billion) Forecast by Distribution Channel, 2021 to 2036
- Table 31: East Asia Market Value (USD Billion) Forecast by Country, 2021 to 2036
- Table 32: East Asia Market Value (USD Billion) Forecast by Nutrient Formulation, 2021 to 2036
- Table 33: East Asia Market Value (USD Billion) Forecast by Application Method, 2021 to 2036
- Table 34: East Asia Market Value (USD Billion) Forecast by Crop Type, 2021 to 2036
- Table 35: East Asia Market Value (USD Billion) Forecast by Physical Form, 2021 to 2036
- Table 36: East Asia Market Value (USD Billion) Forecast by Distribution Channel, 2021 to 2036
- Table 37: South Asia and Pacific Market Value (USD Billion) Forecast by Country, 2021 to 2036
- Table 38: South Asia and Pacific Market Value (USD Billion) Forecast by Nutrient Formulation, 2021 to 2036
- Table 39: South Asia and Pacific Market Value (USD Billion) Forecast by Application Method, 2021 to 2036
- Table 40: South Asia and Pacific Market Value (USD Billion) Forecast by Crop Type, 2021 to 2036
- Table 41: South Asia and Pacific Market Value (USD Billion) Forecast by Physical Form, 2021 to 2036
- Table 42: South Asia and Pacific Market Value (USD Billion) Forecast by Distribution Channel, 2021 to 2036
- Table 43: Middle East and Africa Market Value (USD Billion) Forecast by Country, 2021 to 2036
- Table 44: Middle East and Africa Market Value (USD Billion) Forecast by Nutrient Formulation, 2021 to 2036
- Table 45: Middle East and Africa Market Value (USD Billion) Forecast by Application Method, 2021 to 2036
- Table 46: Middle East and Africa Market Value (USD Billion) Forecast by Crop Type, 2021 to 2036
- Table 47: Middle East and Africa Market Value (USD Billion) Forecast by Physical Form, 2021 to 2036
- Table 48: Middle East and Africa Market Value (USD Billion) Forecast by Distribution Channel, 2021 to 2036
List of Figures
- Figure 1: Global Market Pricing Analysis
- Figure 2: Global Market Value (USD Billion) Forecast 2021-2036
- Figure 3: Global Market Value Share and BPS Analysis by Nutrient Formulation, 2026 and 2036
- Figure 4: Global Market Y-o-Y Growth Comparison by Nutrient Formulation, 2026-2036
- Figure 5: Global Market Attractiveness Analysis by Nutrient Formulation
- Figure 6: Global Market Value Share and BPS Analysis by Application Method, 2026 and 2036
- Figure 7: Global Market Y-o-Y Growth Comparison by Application Method, 2026-2036
- Figure 8: Global Market Attractiveness Analysis by Application Method
- Figure 9: Global Market Value Share and BPS Analysis by Crop Type, 2026 and 2036
- Figure 10: Global Market Y-o-Y Growth Comparison by Crop Type, 2026-2036
- Figure 11: Global Market Attractiveness Analysis by Crop Type
- Figure 12: Global Market Value Share and BPS Analysis by Physical Form, 2026 and 2036
- Figure 13: Global Market Y-o-Y Growth Comparison by Physical Form, 2026-2036
- Figure 14: Global Market Attractiveness Analysis by Physical Form
- Figure 15: Global Market Value Share and BPS Analysis by Distribution Channel, 2026 and 2036
- Figure 16: Global Market Y-o-Y Growth Comparison by Distribution Channel, 2026-2036
- Figure 17: Global Market Attractiveness Analysis by Distribution Channel
- Figure 18: Global Market Value (USD Billion) Share and BPS Analysis by Region, 2026 and 2036
- Figure 19: Global Market Y-o-Y Growth Comparison by Region, 2026-2036
- Figure 20: Global Market Attractiveness Analysis by Region
- Figure 21: North America Market Incremental Dollar Opportunity, 2026-2036
- Figure 22: Latin America Market Incremental Dollar Opportunity, 2026-2036
- Figure 23: Western Europe Market Incremental Dollar Opportunity, 2026-2036
- Figure 24: Eastern Europe Market Incremental Dollar Opportunity, 2026-2036
- Figure 25: East Asia Market Incremental Dollar Opportunity, 2026-2036
- Figure 26: South Asia and Pacific Market Incremental Dollar Opportunity, 2026-2036
- Figure 27: Middle East and Africa Market Incremental Dollar Opportunity, 2026-2036
- Figure 28: North America Market Value Share and BPS Analysis by Country, 2026 and 2036
- Figure 29: North America Market Value Share and BPS Analysis by Nutrient Formulation, 2026 and 2036
- Figure 30: North America Market Y-o-Y Growth Comparison by Nutrient Formulation, 2026-2036
- Figure 31: North America Market Attractiveness Analysis by Nutrient Formulation
- Figure 32: North America Market Value Share and BPS Analysis by Application Method, 2026 and 2036
- Figure 33: North America Market Y-o-Y Growth Comparison by Application Method, 2026-2036
- Figure 34: North America Market Attractiveness Analysis by Application Method
- Figure 35: North America Market Value Share and BPS Analysis by Crop Type, 2026 and 2036
- Figure 36: North America Market Y-o-Y Growth Comparison by Crop Type, 2026-2036
- Figure 37: North America Market Attractiveness Analysis by Crop Type
- Figure 38: North America Market Value Share and BPS Analysis by Physical Form, 2026 and 2036
- Figure 39: North America Market Y-o-Y Growth Comparison by Physical Form, 2026-2036
- Figure 40: North America Market Attractiveness Analysis by Physical Form
- Figure 41: North America Market Value Share and BPS Analysis by Distribution Channel, 2026 and 2036
- Figure 42: North America Market Y-o-Y Growth Comparison by Distribution Channel, 2026-2036
- Figure 43: North America Market Attractiveness Analysis by Distribution Channel
- Figure 44: Latin America Market Value Share and BPS Analysis by Country, 2026 and 2036
- Figure 45: Latin America Market Value Share and BPS Analysis by Nutrient Formulation, 2026 and 2036
- Figure 46: Latin America Market Y-o-Y Growth Comparison by Nutrient Formulation, 2026-2036
- Figure 47: Latin America Market Attractiveness Analysis by Nutrient Formulation
- Figure 48: Latin America Market Value Share and BPS Analysis by Application Method, 2026 and 2036
- Figure 49: Latin America Market Y-o-Y Growth Comparison by Application Method, 2026-2036
- Figure 50: Latin America Market Attractiveness Analysis by Application Method
- Figure 51: Latin America Market Value Share and BPS Analysis by Crop Type, 2026 and 2036
- Figure 52: Latin America Market Y-o-Y Growth Comparison by Crop Type, 2026-2036
- Figure 53: Latin America Market Attractiveness Analysis by Crop Type
- Figure 54: Latin America Market Value Share and BPS Analysis by Physical Form, 2026 and 2036
- Figure 55: Latin America Market Y-o-Y Growth Comparison by Physical Form, 2026-2036
- Figure 56: Latin America Market Attractiveness Analysis by Physical Form
- Figure 57: Latin America Market Value Share and BPS Analysis by Distribution Channel, 2026 and 2036
- Figure 58: Latin America Market Y-o-Y Growth Comparison by Distribution Channel, 2026-2036
- Figure 59: Latin America Market Attractiveness Analysis by Distribution Channel
- Figure 60: Western Europe Market Value Share and BPS Analysis by Country, 2026 and 2036
- Figure 61: Western Europe Market Value Share and BPS Analysis by Nutrient Formulation, 2026 and 2036
- Figure 62: Western Europe Market Y-o-Y Growth Comparison by Nutrient Formulation, 2026-2036
- Figure 63: Western Europe Market Attractiveness Analysis by Nutrient Formulation
- Figure 64: Western Europe Market Value Share and BPS Analysis by Application Method, 2026 and 2036
- Figure 65: Western Europe Market Y-o-Y Growth Comparison by Application Method, 2026-2036
- Figure 66: Western Europe Market Attractiveness Analysis by Application Method
- Figure 67: Western Europe Market Value Share and BPS Analysis by Crop Type, 2026 and 2036
- Figure 68: Western Europe Market Y-o-Y Growth Comparison by Crop Type, 2026-2036
- Figure 69: Western Europe Market Attractiveness Analysis by Crop Type
- Figure 70: Western Europe Market Value Share and BPS Analysis by Physical Form, 2026 and 2036
- Figure 71: Western Europe Market Y-o-Y Growth Comparison by Physical Form, 2026-2036
- Figure 72: Western Europe Market Attractiveness Analysis by Physical Form
- Figure 73: Western Europe Market Value Share and BPS Analysis by Distribution Channel, 2026 and 2036
- Figure 74: Western Europe Market Y-o-Y Growth Comparison by Distribution Channel, 2026-2036
- Figure 75: Western Europe Market Attractiveness Analysis by Distribution Channel
- Figure 76: Eastern Europe Market Value Share and BPS Analysis by Country, 2026 and 2036
- Figure 77: Eastern Europe Market Value Share and BPS Analysis by Nutrient Formulation, 2026 and 2036
- Figure 78: Eastern Europe Market Y-o-Y Growth Comparison by Nutrient Formulation, 2026-2036
- Figure 79: Eastern Europe Market Attractiveness Analysis by Nutrient Formulation
- Figure 80: Eastern Europe Market Value Share and BPS Analysis by Application Method, 2026 and 2036
- Figure 81: Eastern Europe Market Y-o-Y Growth Comparison by Application Method, 2026-2036
- Figure 82: Eastern Europe Market Attractiveness Analysis by Application Method
- Figure 83: Eastern Europe Market Value Share and BPS Analysis by Crop Type, 2026 and 2036
- Figure 84: Eastern Europe Market Y-o-Y Growth Comparison by Crop Type, 2026-2036
- Figure 85: Eastern Europe Market Attractiveness Analysis by Crop Type
- Figure 86: Eastern Europe Market Value Share and BPS Analysis by Physical Form, 2026 and 2036
- Figure 87: Eastern Europe Market Y-o-Y Growth Comparison by Physical Form, 2026-2036
- Figure 88: Eastern Europe Market Attractiveness Analysis by Physical Form
- Figure 89: Eastern Europe Market Value Share and BPS Analysis by Distribution Channel, 2026 and 2036
- Figure 90: Eastern Europe Market Y-o-Y Growth Comparison by Distribution Channel, 2026-2036
- Figure 91: Eastern Europe Market Attractiveness Analysis by Distribution Channel
- Figure 92: East Asia Market Value Share and BPS Analysis by Country, 2026 and 2036
- Figure 93: East Asia Market Value Share and BPS Analysis by Nutrient Formulation, 2026 and 2036
- Figure 94: East Asia Market Y-o-Y Growth Comparison by Nutrient Formulation, 2026-2036
- Figure 95: East Asia Market Attractiveness Analysis by Nutrient Formulation
- Figure 96: East Asia Market Value Share and BPS Analysis by Application Method, 2026 and 2036
- Figure 97: East Asia Market Y-o-Y Growth Comparison by Application Method, 2026-2036
- Figure 98: East Asia Market Attractiveness Analysis by Application Method
- Figure 99: East Asia Market Value Share and BPS Analysis by Crop Type, 2026 and 2036
- Figure 100: East Asia Market Y-o-Y Growth Comparison by Crop Type, 2026-2036
- Figure 101: East Asia Market Attractiveness Analysis by Crop Type
- Figure 102: East Asia Market Value Share and BPS Analysis by Physical Form, 2026 and 2036
- Figure 103: East Asia Market Y-o-Y Growth Comparison by Physical Form, 2026-2036
- Figure 104: East Asia Market Attractiveness Analysis by Physical Form
- Figure 105: East Asia Market Value Share and BPS Analysis by Distribution Channel, 2026 and 2036
- Figure 106: East Asia Market Y-o-Y Growth Comparison by Distribution Channel, 2026-2036
- Figure 107: East Asia Market Attractiveness Analysis by Distribution Channel
- Figure 108: South Asia and Pacific Market Value Share and BPS Analysis by Country, 2026 and 2036
- Figure 109: South Asia and Pacific Market Value Share and BPS Analysis by Nutrient Formulation, 2026 and 2036
- Figure 110: South Asia and Pacific Market Y-o-Y Growth Comparison by Nutrient Formulation, 2026-2036
- Figure 111: South Asia and Pacific Market Attractiveness Analysis by Nutrient Formulation
- Figure 112: South Asia and Pacific Market Value Share and BPS Analysis by Application Method, 2026 and 2036
- Figure 113: South Asia and Pacific Market Y-o-Y Growth Comparison by Application Method, 2026-2036
- Figure 114: South Asia and Pacific Market Attractiveness Analysis by Application Method
- Figure 115: South Asia and Pacific Market Value Share and BPS Analysis by Crop Type, 2026 and 2036
- Figure 116: South Asia and Pacific Market Y-o-Y Growth Comparison by Crop Type, 2026-2036
- Figure 117: South Asia and Pacific Market Attractiveness Analysis by Crop Type
- Figure 118: South Asia and Pacific Market Value Share and BPS Analysis by Physical Form, 2026 and 2036
- Figure 119: South Asia and Pacific Market Y-o-Y Growth Comparison by Physical Form, 2026-2036
- Figure 120: South Asia and Pacific Market Attractiveness Analysis by Physical Form
- Figure 121: South Asia and Pacific Market Value Share and BPS Analysis by Distribution Channel, 2026 and 2036
- Figure 122: South Asia and Pacific Market Y-o-Y Growth Comparison by Distribution Channel, 2026-2036
- Figure 123: South Asia and Pacific Market Attractiveness Analysis by Distribution Channel
- Figure 124: Middle East and Africa Market Value Share and BPS Analysis by Country, 2026 and 2036
- Figure 125: Middle East and Africa Market Value Share and BPS Analysis by Nutrient Formulation, 2026 and 2036
- Figure 126: Middle East and Africa Market Y-o-Y Growth Comparison by Nutrient Formulation, 2026-2036
- Figure 127: Middle East and Africa Market Attractiveness Analysis by Nutrient Formulation
- Figure 128: Middle East and Africa Market Value Share and BPS Analysis by Application Method, 2026 and 2036
- Figure 129: Middle East and Africa Market Y-o-Y Growth Comparison by Application Method, 2026-2036
- Figure 130: Middle East and Africa Market Attractiveness Analysis by Application Method
- Figure 131: Middle East and Africa Market Value Share and BPS Analysis by Crop Type, 2026 and 2036
- Figure 132: Middle East and Africa Market Y-o-Y Growth Comparison by Crop Type, 2026-2036
- Figure 133: Middle East and Africa Market Attractiveness Analysis by Crop Type
- Figure 134: Middle East and Africa Market Value Share and BPS Analysis by Physical Form, 2026 and 2036
- Figure 135: Middle East and Africa Market Y-o-Y Growth Comparison by Physical Form, 2026-2036
- Figure 136: Middle East and Africa Market Attractiveness Analysis by Physical Form
- Figure 137: Middle East and Africa Market Value Share and BPS Analysis by Distribution Channel, 2026 and 2036
- Figure 138: Middle East and Africa Market Y-o-Y Growth Comparison by Distribution Channel, 2026-2036
- Figure 139: Middle East and Africa Market Attractiveness Analysis by Distribution Channel
- Figure 140: Global Market - Tier Structure Analysis
- Figure 141: Global Market - Company Share Analysis
Frequently Asked Questions
How big is the nano fertilizers market in 2026, and what is forecast for 2036?
FMI estimates that the global nano fertilizers sector stood at USD 3.4 billion in 2025 and reaches an estimated USD 3.8 billion in 2026. Overall industry valuation is on course to hit USD 11.8 billion by 2036 as cereal and horticultural growers adopt foliar nano-nutrients.
What is the CAGR for the nano fertilizers market from 2026 to 2036?
The nano fertilizers sector is projected to expand at a 12.0% CAGR over the 2026 to 2036 window, adding USD 8.0 billion across foliar spray and drip-fertigation applications.
Which nutrient formulation segment leads the nano fertilizers market?
Nano Nitrogen Liquid Urea Nanoparticles hold an estimated 54.0% of nutrient formulation demand in 2026 given that sub-100-nanometer nitrogen clusters penetrate leaf stomata directly during vegetative top-dressing.
Which application method segment leads the nano fertilizers market?
Foliar Spray Precision Droplet Spraying represents a projected 58.0% of the application method category in 2026 as tractor boom sprayers and agricultural drones deliver uniform canopy coverage.
Which country has a notable growth outlook during the assessment period?
India leads global expansion at a 14.8% CAGR ahead of Mexico at a 14.1% CAGR through 2036, driven by FCO-notified Nano Urea Plus and Nano DAP plants and smallholder fertilizer programs.
Who are the key players in the market?
IFFCO, Lazur AG, and Nanmax AG lead commercial supply. Tropical Agrosystem India Pvt Ltd, JU Agri Sciences Pvt Ltd, and Bio-Nano Agritech Inc. also hold major positions. Additional key participants include Agri-Nano Solutions International and Coromandel International plus ICL Group and Yara International.
Preview the report firsthand - request a free sample
Get SampleGet the brochure for pricing and purchase details.
Get PDF
