The Fiber to the Home (FTTH) market is experiencing rapid growth driven by increasing demand for high-speed internet connectivity and enhanced digital services across residential and commercial segments. The future outlook of the market is shaped by the rising consumption of bandwidth-intensive applications such as streaming services, online gaming, and cloud-based platforms.
Investments in telecommunications infrastructure and government initiatives to expand broadband accessibility are further supporting market expansion. Technological advancements in fiber optic networks have improved reliability, speed, and latency, making FTTH a preferred solution for consumers and service providers.
The growing emphasis on remote work, digital education, and smart home applications has accelerated the adoption of high-speed internet, thereby driving demand for FTTH deployment Additionally, the replacement of legacy copper networks with fiber-based systems ensures sustainable long-term growth and positions the market to cater to the increasing data requirements of future digital ecosystems.
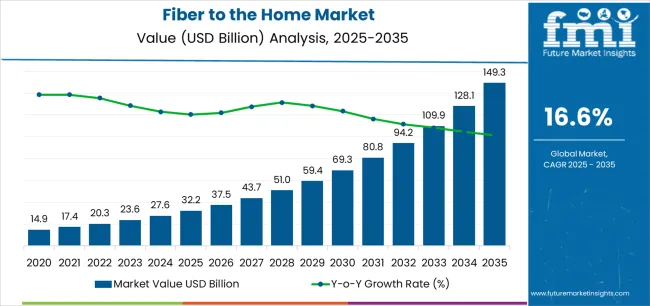
| Metric | Value |
|---|---|
| Fiber to the Home Market Estimated Value in (2025 E) | USD 32.2 billion |
| Fiber to the Home Market Forecast Value in (2035 F) | USD 149.3 billion |
| Forecast CAGR (2025 to 2035) | 16.6% |
The market is segmented by Download Speed, Application, and End User and region. By Download Speed, the market is divided into 100 Mbps to 1 Gbps, Less Than 50 Mbps, 50 Mbps to 100 Mbps, and More Than 1 Gbps. In terms of Application, the market is classified into Internet TV, VoIP, Interactive Gaming, VPN On Broadband, Virtual Private LAN Service, Remote Education, and Smart Home Application. Based on End User, the market is segmented into Single Family Homes, Multiple Dwelling Units, and Small Office Home Office. Regionally, the market is classified into North America, Latin America, Western Europe, Eastern Europe, Balkan & Baltic Countries, Russia & Belarus, Central Asia, East Asia, South Asia & Pacific, and the Middle East & Africa.
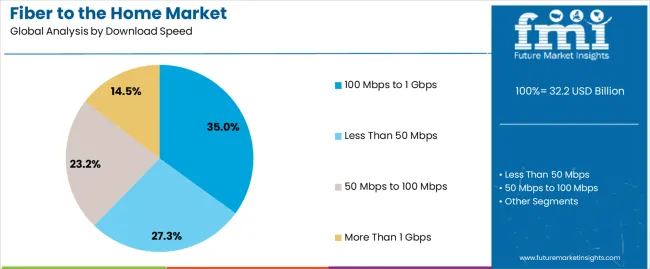
The 100 Mbps to 1 Gbps download speed segment is projected to hold 35.00% of the Fiber to the Home market revenue share in 2025, making it the leading segment. This dominance is attributed to the growing requirement for stable and fast internet connections capable of supporting multiple connected devices simultaneously.
The segment benefits from enhanced fiber optic infrastructure that delivers consistent bandwidth and low latency, ensuring seamless access to streaming, gaming, and cloud services. Increasing adoption of smart home technologies and IoT devices further drives the demand for higher download speeds.
The segment’s growth is also supported by service providers offering competitive packages that cater to both residential and small commercial users As data consumption per household continues to rise, the 100 Mbps to 1 Gbps download speed range remains a preferred choice for providing high-performance connectivity, reliability, and an optimal user experience.
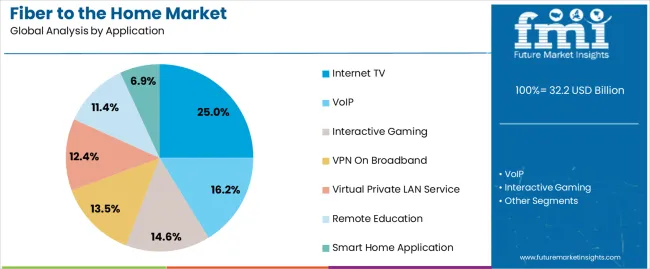
The Internet TV application segment is expected to capture 25.00% of the Fiber to the Home market revenue share in 2025, establishing it as the leading application. This growth is driven by the increasing consumption of streaming services, video-on-demand platforms, and high-definition content that require consistent and high-speed internet connectivity.
The expansion of content offerings and the rising trend of cord-cutting have significantly boosted the adoption of Internet TV services. Improved network reliability and reduced buffering enabled by fiber optic technology have reinforced the popularity of this application.
The segment has also benefited from the proliferation of smart TVs and multimedia devices in households, which facilitate convenient access to online content As consumer preference shifts towards digital entertainment and on-demand viewing experiences, Internet TV continues to dominate as a primary application driving FTTH adoption.
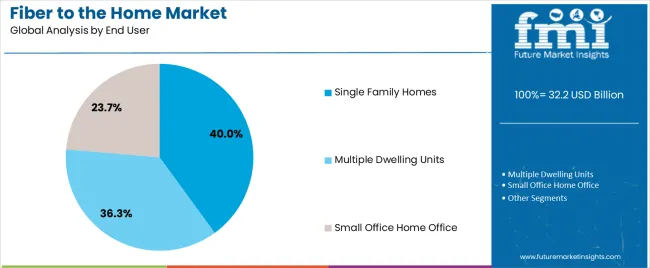
The Single Family Homes end user segment is anticipated to account for 40.00% of the Fiber to the Home market revenue in 2025, making it the leading end-use segment. The growth of this segment is fueled by the increasing demand for high-speed and reliable internet connectivity among households.
Single family homes typically require dedicated broadband services to support multiple devices and bandwidth-intensive applications such as video streaming, online gaming, remote work, and e-learning. The segment benefits from ongoing infrastructure expansion that prioritizes residential connectivity and government initiatives aimed at enhancing digital accessibility.
Service providers focus on offering tailored FTTH solutions to individual households, which ensures consistent performance and superior user experience Additionally, the trend toward smart home adoption and connected devices further reinforces the need for fiber-based connectivity in single family homes, driving sustained growth and market dominance in this segment.
The below table presents the expected CAGR for the global Fiber to the home market over several semi-annual periods spanning from 2025 to 2035. In the first half (H1) of the year from 2025 to 2035, the business is predicted to surge at a CAGR of 16.6%, followed by a slightly higher growth rate of 16.8% in the second half (H2) of the same year.
| Particular | Value CAGR |
|---|---|
| H1, 2025 | 14.3% (2025 to 2035) |
| H2, 2025 | 14.7% (2025 to 2035) |
| H1, 2025 | 16.6% (2025 to 2035) |
| H2, 2025 | 16.8% (2025 to 2035) |
Moving into the subsequent period, from H1 2025 to H2 2035, the CAGR is projected to increase slightly to 16.6% in the first half and remain relatively moderate at 16.8% in the second half. In the first half (H1) the market witnessed a decrease of 30 BPS while in the second half (H2), the market witnessed an increase of 40 BPS.
Evolution of Smart Homes & Gadgets
The adoption of smart homes and applications has increased markedly in the last five years in developed regions, due to increasing advances in home automation in these regions.
Smart home applications include advanced security features with connected home alarms and remote home monitoring; a few other smart features are control over a home's living environment, like climate control, self-powered lighting, power management, and fire alarms.
These, among many reasons, have made today's consumers move toward better Internet infrastructure with advanced security offerings: no radiate signals to operate smart devices across various premises. Therefore, the demand for fiber at home is predicted to be increased with the aim of adding value services for a better quality of living.
Increasing Construction in Developing Economies
Governments and builders across developing economies such as India and China are investing in construction projects with the growing population and the need for better building infrastructure in order to deliver better living standards to people.
In addition, increasing disposable income of individuals is a major factor responsible for better living standards. All these factors are assisting in the growth of the fiber to the home market. As indicated by the India Brand Equity Foundation, about USD 250 Million was raised by Kotak Realty Fund from institutional investors for investment in realty projects around Chennai, Mumbai, Hyderabad, Delhi, Bengaluru, and Pune.
Growing investments in real estate sectors are expected to increase demand for better infrastructure due to which, real estate developers deploy fiber to premises/homes to provide upgraded telecommunication infrastructure to consumers.
Maintaining High Data Speed at Low Prices
With increasing globalization, markets have become competitive, and the industrial and commercial sectors are competing for dominant positions in the markets.
But, due to this competition, and to deliver unique selling propositions to customers, major players are focusing on reducing prices and enhancing offerings, owing to which, new entrants delivering quality at low prices is a major challenge faced by manufactures for sustaining themselves in the market.
For instance, Reliance launched its Jio Fiber in 2020-20, in which the base plan of Jio GigaFiber broadband service will offer data speed ranging from 100Mbps to 1Gbps. JioFiber plan rentals will start at INR 699 and will go up to INR 8,499.
Threat of New Substitutes in the Market
Due to increased technological advancement, the threat of new substitutes in the technology-related domain is very high, and the fact is likely to make the fiber to the home market stagnant in growth. For instance, a technology that is a hybrid of fiber optics and conventional radio-frequency-wireless fiber could serve as a potential fiber-to-the-home substitute.
Thus, while the high cost of wireless fiber at the outstart might lend encouragement to the take up of fiber to the home subscriptions, in the long term, it might serve as a potential drag on the growth of the FTTH market. Availability of better alternatives, such as wireless fiber, is poised to be a major restraint for the market in the forecast period.
The global Fiber to the home industry recorded a CAGR of 16.6% during the historical period between 2020 and 2025. The growth of Fiber to the home industry was positive as it reached a value of USD 23,806.20 million in 2025 from USD 13,948.86 million in 2020.
During 2020 to 2025, the FTTH market increased quite significantly around the world due to the increasing demand for high-speed internet, remote working, and online entertainment.
During this period, numbers of households and businesses turning to FTTH solutions reached new levels in developed regions like North America, Europe, and parts of Asia. The COVID-19 situation further accelerated this trend, proving that reliable and fast connections have indeed become essentials.
Going forward, the demand for FTTH is set to increase between 2025 and 2035 as digital infrastructure is developed, 5G networks are deployed, and smart city projects proliferate. Developing countries in Asia, Africa, and Latin America are expected to account for substantial growth vis-à-vis investments made toward a fiber optic network that could bridge the digital divide.
Further, technological developments in fibers, supported by government policies and funding, will ensure much more market growth as FTTH becomes a critical product of telecommunication infrastructure in the coming decade.
Tier 1 includes China Telecom Corporation Limited, China Mobile Ltd., Verizon Communications Inc., and AT&T Inc. These companies represent the largest global telecom operators having large infrastructures, huge customer bases, and vast influence over the telecommunications field.
They operate across a number of regions and provide mobile, fixed line, broadband, and enterprise services. They are 5G leaders and often among the earliest to introduce innovations in telecommunications. Tier 1 firms are financially powerful, and they play a major role in setting the global telecom standards.
Tier 2 firms include Vodafone Group Plc, Nippon Telegraph and Telephone Corporation (NTT), SoftBank Group Corp, Deutsche Telekom AG, and Telefónica SA. These companies are important players in their local regions, have significant market share, and a strong brand.
They do not possess the same worldwide prominence as the Tier 1 companies, but they are major operators in Europe and Asia, often tending to be within the largest of their local markets, and they expand through strategic acquisitions. They provide a full range of services: mobile, broadband, and enterprise solutions, as well as actively engage in the development of new generation networks - 5G, networks of fiber optics.
Tier 3 are América Móvil, Singtel, and CenturyLink. These companies have significant influence in specific areas and operate mainly in the national or regional market. They play an essential role in delivering connectivity into growth markets and are often market leaders in their geographical region even though they are smaller than Tier 1 and Tier 2 companies.
They mainly focus on expanding network coverage into areas that have been underserved and upgrading existing infrastructure to cater to the delivery of modern types of services.
The section below covers the industry analysis for the fiber to the home market for different countries. The market demand analysis on key countries in several countries of the globe, including USA, Germany, UK, China and India are provided.
The united states is expected to remains at the forefront in North America, with a value share of 59.9% in 2025. In South Asia & pacific, India is projected to witness a CAGR of 21.3% during the forecasted period.
| Countries | Value CAGR (2025 to 2035) |
|---|---|
| USA | 15.8% |
| China | 17.8% |
| India | 21.3% |
| Germany | 16.0% |
| UK | 18.5% |
The fiber to the home demand in the United States is expected to account for 60.6% in FTTH market share of North America through 2025. The United States had a significant share of 15.8% in 2025. It is anticipated to grow in the upcoming years as the country is a huge market for fiber to the home systems.
Increasing construction and rising demand for high-speed internet in the United States are fueling the growth of fiber to the home industry. In addition, the country is increasing investments in the telecom sector for better internet infrastructure.
For instance, Verizon Communications launched the Fios broadband and video services suite in Boston. This initiative was part of the telco’s USD 300 million agreements. To develop an alternative broadband source to cable MSO incumbent Comcast.
The FTTH sales revenue in China is estimated to increase at a CAGR of 17.8% CAGR by 2025- 2035. The fiber-to-the-home sector is rapidly evolving, with new communication technologies in China and other East Asian countries.
The adoption of smart homes and applications in China, owing to increasing advancements in home automation. This supports consumers to adopt better internet infrastructure with advanced security offerings. Such as no radiate signals to operate all the smart gadgets.
Key players like China Mobile and others are focusing on expansion to maintain their positions and to provide innovative communication products and solutions. These factors are propelling the demand for fiber to the home solutions in China.
India will continue to be one of the lucrative markets for the forecast period. The country is pegged to achieve a CAGR of 21.3% by 2035, as assessed from the study.
Governmental intervention in the form of initiatives to increase digitalization in the country is an opportunity for service providers in fiber-to-the-home technology. A chance for equipment and FTTH service providers to tap business opportunities exists due to rapid growth in internet traffic in the country.
The government of India launched the Digital India Program. Rural governments in the region are intending to provide FTTH services across the whole nation. They are trying to connect around 600 thousand rural citizens in bridging the digital gap between the villages and cities. Thus, the demand for fiber to the home solution is expected to increase at a high rate in the country.
The section contains information about the leading segments in the fiber to the home industry. By Download Speed, the 101 Mbps to 1 Gbps segment is estimated to grow at a CAGR of 18.0% throughout 2035. Moreover, by Application, the remote education segment is projected to expand at a CAGR of 18.6% during forecasted period.
| Application | Remote Education |
|---|---|
| CAGR (2025 to 2035) | 18.6% |
Remote education accounted for the leading share of 15.5% in 2025. The remote education segment is expected to showcase a strong CAGR of 18.6% during the forecast period.
With an increasing inclination for ICT in various places the demand for FTTH is expected to increase. Such as schools, government buildings, and libraries. For instance, in schools, to facilitate advanced library infrastructure and promote e-learning, colleges, and schools are deploying FTTH network infrastructure.
Students are studying online via digital media and sharing notes with their teachers, as fiber connection is reliable. Other emerging applications of FTTH are e-Governments, distance learning, and others. Hence, increasing adoption of FTTH for remote education is expected to fuel market growth.
| Download Speed | 101 Mbps to 1 Gbps |
|---|---|
| CAGR (2025 to 2035) | 18.0% |
The 101 Mbps to 1 Gbps FTTH segment dominated the market with a share of 25.3% in 2025. The market is likely to gain traction, with around 18.0% CAGR by 2025-2035.
With the increasing population and the need for high-speed internet, consumers in various developing economies are investing in fiber internet. Increasing disposable income of individuals is a key factor driving the demand for high-speed internet from a download speed of 101 Mbps to 1 Gbps.
All these factors are assisting in the growth of the fiber-to-the-home sector. Further, the real estate sector is increasing investments in better infrastructure. Owing to this, real estate developers are deploying fiber to premises/homes to provide upgraded telecommunication infrastructure to consumers.
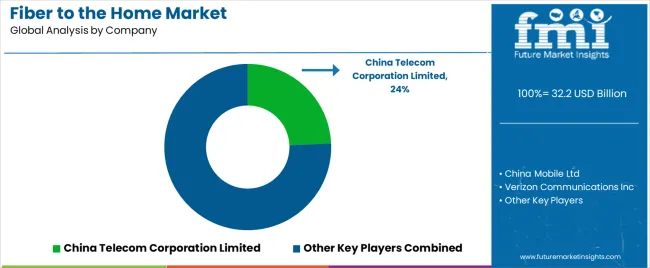
The competitive landscape of the Fiber to the Home (FTTH) market is characterized by a mix of established telecom giants, regional providers, and emerging players. Major companies like China Telecom, AT&T, Verizon, and Orange dominate the market with extensive infrastructure and large customer bases, while newer entrants and regional operators focus on niche markets or underserved areas.
The competition is intensifying as companies race to expand their fiber networks, enhance service quality, and offer competitive pricing, driven by increasing consumer demand for high-speed internet and the ongoing rollout of 5G technology.
Recent Industry Developments in Fiber to the home Market
In terms of property type, the industry is segregated into Less than 50 Mbps, 50 Mbps to 100 Mbps, 100 Mbps to 1 Gbps and More than 1 Gbps.
The Application is classified by industries as Internet TV, VoIP, Interactive Gaming, VPN on Broadband, Virtual Private LAN Service, Remote Education and Smart Home Application.
In terms of End User, the End User is distributed into Single Family Homes, Multiple Dwelling Units and Small Office Home Office.
Key countries of North America, Latin America, Western Europe, Eastern Europe, East Asia, South Asia & pacific, Middle East and Africa (MEA) have been covered in the report.
The global fiber to the home market is estimated to be valued at USD 32.2 billion in 2025.
The market size for the fiber to the home market is projected to reach USD 149.3 billion by 2035.
The fiber to the home market is expected to grow at a 16.6% CAGR between 2025 and 2035.
The key product types in fiber to the home market are 100 mbps to 1 gbps, less than 50 mbps, 50 mbps to 100 mbps and more than 1 gbps.
In terms of application, internet tv segment to command 25.0% share in the fiber to the home market in 2025.


Our Research Products

The "Full Research Suite" delivers actionable market intel, deep dives on markets or technologies, so clients act faster, cut risk, and unlock growth.

The Leaderboard benchmarks and ranks top vendors, classifying them as Established Leaders, Leading Challengers, or Disruptors & Challengers.

Locates where complements amplify value and substitutes erode it, forecasting net impact by horizon

We deliver granular, decision-grade intel: market sizing, 5-year forecasts, pricing, adoption, usage, revenue, and operational KPIs—plus competitor tracking, regulation, and value chains—across 60 countries broadly.

Spot the shifts before they hit your P&L. We track inflection points, adoption curves, pricing moves, and ecosystem plays to show where demand is heading, why it is changing, and what to do next across high-growth markets and disruptive tech

Real-time reads of user behavior. We track shifting priorities, perceptions of today’s and next-gen services, and provider experience, then pace how fast tech moves from trial to adoption, blending buyer, consumer, and channel inputs with social signals (#WhySwitch, #UX).

Partner with our analyst team to build a custom report designed around your business priorities. From analysing market trends to assessing competitors or crafting bespoke datasets, we tailor insights to your needs.
Supplier Intelligence
Discovery & Profiling
Capacity & Footprint
Performance & Risk
Compliance & Governance
Commercial Readiness
Who Supplies Whom
Scorecards & Shortlists
Playbooks & Docs
Category Intelligence
Definition & Scope
Demand & Use Cases
Cost Drivers
Market Structure
Supply Chain Map
Trade & Policy
Operating Norms
Deliverables
Buyer Intelligence
Account Basics
Spend & Scope
Procurement Model
Vendor Requirements
Terms & Policies
Entry Strategy
Pain Points & Triggers
Outputs
Pricing Analysis
Benchmarks
Trends
Should-Cost
Indexation
Landed Cost
Commercial Terms
Deliverables
Brand Analysis
Positioning & Value Prop
Share & Presence
Customer Evidence
Go-to-Market
Digital & Reputation
Compliance & Trust
KPIs & Gaps
Outputs
Full Research Suite comprises of:
Market outlook & trends analysis
Interviews & case studies
Strategic recommendations
Vendor profiles & capabilities analysis
5-year forecasts
8 regions and 60+ country-level data splits
Market segment data splits
12 months of continuous data updates
DELIVERED AS:
PDF EXCEL ONLINE
Fiber to the x (FTTx) Tester Market – Trends, Growth, Demand & Forecast 2025 to 2035
Fiber to the X Market - Connectivity & Expansion 2025 to 2035
Home Respiratory Therapy Market – Growth & Forecast 2025 to 2035
Home Theatre System Market Trends – Growth & Forecast 2024-2034
Home Automation Sensors Market Size and Share Forecast Outlook 2025 to 2035
Motorhome Market Size and Share Forecast Outlook 2025 to 2035
Tool Tethering Market Size and Share Forecast Outlook 2025 to 2035
Home Automation Market Analysis by Product, Application, Networking Technology, and Region Through 2035
Phototherapy Lamps And Units For Aesthetic Medicine Market Size and Share Forecast Outlook 2025 to 2035
Phototherapy Equipment Market Size and Share Forecast Outlook 2025 to 2035
Phototherapy Treatment Market Size and Share Forecast Outlook 2025 to 2035
Atherectomy Devices Market Size and Share Forecast Outlook 2025 to 2035
Phototherapy Lamps Market Growth - Trends & Forecast 2025 to 2035
Home Elevator Market Growth – Trends & Forecast 2025 to 2035
Potato Fiber Market Size and Share Forecast Outlook 2025 to 2035
Ethernet Storage Fabric Market Size and Share Forecast Outlook 2025 to 2035
Ethernet Storage Market Size and Share Forecast Outlook 2025 to 2035
At-Home Therapeutic Beauty Devices Market Analysis - Size, Share, and Forecast Outlook 2025 to 2035
Market Share Distribution Among Theme Park Tourism Providers
Theme Park Tourism Industry Analysis by Park Type, By Visitor Category, by Tourist Type, by Booking Channel, and by Region - Forecast for 2025 to 2035

Thank you!
You will receive an email from our Business Development Manager. Please be sure to check your SPAM/JUNK folder too.
Chat With
MaRIA