Flip Top Vials Market Size and Share Forecast Outlook 2025 to 2035

The Flip Top Vials Market is estimated to be valued at USD 1.5 billion in 2025 and is projected to reach USD 3.1 billion by 2035, registering a compound annual growth rate (CAGR) of 7.5% over the forecast period.
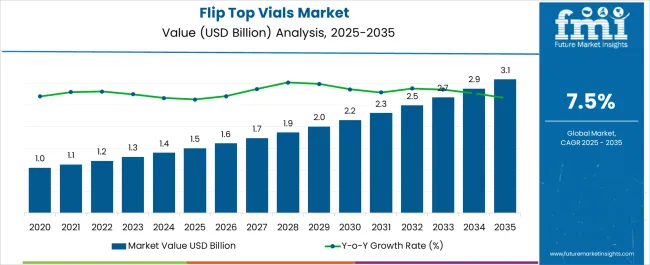
Quick Stats for Flip Top Vials Market

  • Flip Top Vials Market Value (2025): USD 1.5 billion
  • Flip Top Vials Market Forecast Value (2035): USD 3.1 billion
  • Flip Top Vials Market Forecast CAGR: 7.5%
  • Leading Segment in Flip Top Vials Market in 2025: Plastic (55.0%)
  • Key Growth Regions in Flip Top Vials Market: North America, Asia-Pacific, Europe
  • Top Key Players in Flip Top Vials Market: Schott AG, 3M, AptarGroup, Ecolopharm, Filtration Group Corporation, Sorbead India, Adelphi Group, Gerresheimer, MedicoPack, Amcor, Pacific Vials

Flip Top Vials Market Market Value Analysis

Flip Top Vials Market Key Takeaways

Metric Value
Flip Top Vials Market Estimated Value in (2025 E) USD 1.5 billion
Flip Top Vials Market Forecast Value in (2035 F) USD 3.1 billion
Forecast CAGR (2025 to 2035) 7.5%

Why is the Flip Top Vials Market Growing?

The Flip Top Vials market is witnessing steady growth, supported by rising demand for safe, convenient, and hygienic packaging solutions across healthcare, pharmaceutical, and laboratory applications. In 2025, the market is shaped by the growing emphasis on product safety, contamination prevention, and compliance with stringent regulatory requirements for medical and laboratory consumables. The easy usability of flip top closures, coupled with their leak-proof sealing, has made these vials highly preferred for sensitive applications.

Increasing research and development activities, expanding pharmaceutical manufacturing, and the rising need for compact sample storage formats are further fueling adoption. Manufacturers are focusing on sustainable material innovations and improved closure mechanisms to enhance usability and environmental compliance, thereby broadening future opportunities.

As global healthcare systems expand and diagnostic activities continue to scale up, demand for flip top vials is projected to rise steadily, supported by their adaptability, low unit cost, and compatibility with automated filling and handling systems These trends are expected to shape a strong and sustainable market outlook in the years ahead.

Segmental Analysis

The flip top vials market is segmented by material type, capacity, end use, and geographic regions. By material type, flip top vials market is divided into Plastic and Glass. In terms of capacity, flip top vials market is classified into 5 ml to 10 ml, Less than 5 ml, and 10 ml & Above. Based on end use, flip top vials market is segmented into Medical, Food & Beverages, Laboratories, Forensics, and Cosmetics. Regionally, the flip top vials industry is classified into North America, Latin America, Western Europe, Eastern Europe, Balkan & Baltic Countries, Russia & Belarus, Central Asia, East Asia, South Asia & Pacific, and the Middle East & Africa.
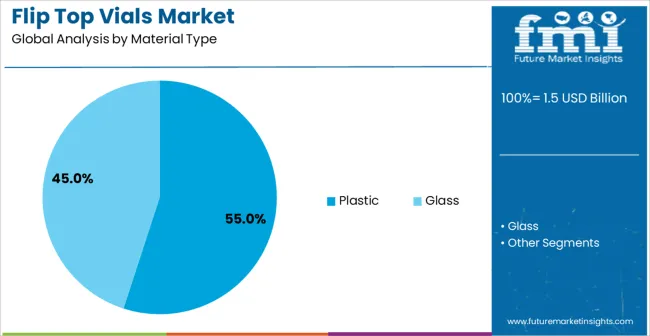
Insights into the Plastic Segment

Flip Top Vials Market Analysis By Material Type

The Plastic segment is projected to hold 55.00% of the Flip Top Vials market revenue share in 2025, making it the leading material type. This position is being driven by the cost-effectiveness, lightweight nature, and versatility of plastic vials compared to alternatives. Plastic offers durability and resistance to breakage, making it suitable for handling, storage, and transportation in high-volume applications.

The material also allows for customization in terms of size, design, and transparency, which has facilitated its adoption in medical and laboratory settings where visibility and secure sealing are critical. Growing concerns about contamination control and ease of sterilization have further favored plastic vials, as they can be manufactured under sterile conditions and designed for single-use applications.

Additionally, advancements in polymer technology have enabled the development of recyclable and sustainable plastic variants, aligning with regulatory and environmental considerations With increasing global demand for cost-efficient yet safe packaging solutions, the Plastic segment is expected to retain its leadership in the market over the coming years.
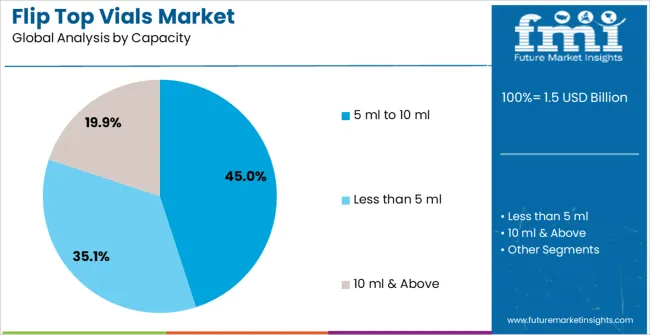
Insights into the 5 ml to 10 ml Capacity Segment

Flip Top Vials Market Analysis By Capacity

The 5 ml to 10 ml capacity segment is expected to account for 45.00% of the Flip Top Vials market revenue share in 2025, positioning it as the leading capacity type. This dominance is being attributed to the suitability of this size range for storing small volumes of pharmaceuticals, diagnostic samples, and laboratory reagents. The balance between compact size and adequate volume capacity has made this segment highly preferred in medical and laboratory environments where efficiency and convenience are prioritized.

These vials are increasingly adopted in single-dose packaging, clinical testing, and field-based diagnostic applications where portability and contamination prevention are critical. Their compatibility with automated filling systems and ease of labeling have further enhanced demand in regulated industries.

As personalized medicine and small-dose therapeutics gain momentum, the need for reliable, small-capacity vials continues to expand The rising prevalence of diagnostic testing and point-of-care sampling globally is also supporting the sustained dominance of this capacity segment within the overall market.
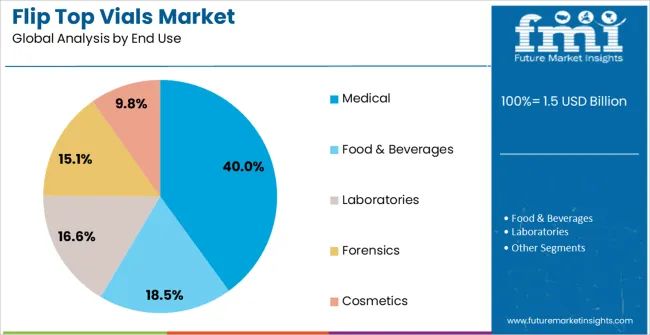
Insights into the Medical Segment

Flip Top Vials Market Analysis By End Use

The Medical end-use industry is projected to hold 40.00% of the Flip Top Vials market revenue share in 2025, making it the largest application area. This growth is being influenced by the increasing demand for safe, sterile, and reliable packaging solutions in hospitals, clinics, diagnostic centers, and pharmaceutical facilities. Flip top vials are widely utilized for storing medications, vaccines, and diagnostic samples due to their secure sealing, which minimizes the risk of leakage or contamination.

Their ease of handling and convenience in dispensing make them particularly valuable in fast-paced medical settings. Regulatory emphasis on infection control and safe packaging standards has accelerated adoption, as healthcare providers seek solutions that ensure compliance while maintaining efficiency.

The medical industry’s focus on operational effectiveness, patient safety, and reliable sample management is reinforcing demand for flip top vials With healthcare infrastructure expanding globally and the increasing frequency of medical testing and treatments, this segment is anticipated to continue leading the market over the forecast period.

Market Overview

Flip Top Vials Market: Overview

Vials are small containers made up of plastic or glass. Vials are used in a wide range of industries including medical, household purposes and scientific applications. Flip top vials are a type of vials which have special closure that can be flipped.

Flip top vials have one piece closure system where closure is permanently attached to the vials body. Flip top vials are easy to open and close. Flip top vials are bottles or vessels that offers a leak-proof, air-tight and controlled environment which helps in maintaining product stability and enhances the shelf life of the product.

Flip top vials are generally made up of plastic or glass. The ease of accessing flip top vials is a significant benefit to end users and consumers who have trouble manipulating regular bottles or containers. Flip top vials can be a single dose, or multi dose depend on the application. The outlook for the global flip top vials market is expected to be positive during the forecast period.
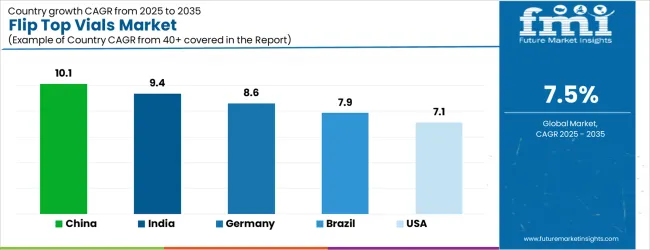
Analysis of Flip Top Vials Market By Key Countries

Flip Top Vials Market Cagr Analysis By Country

Country CAGR
China 10.1%
India 9.4%
Germany 8.6%
Brazil 7.9%
USA 7.1%
UK 6.4%
Japan 5.6%

Country-wise Analysis

The Flip Top Vials Market is expected to register a CAGR of 7.5% during the forecast period, exhibiting varied country level momentum. China leads with the highest CAGR of 10.1%, followed by India at 9.4%. Developed markets such as Germany, France, and the UK continue to expand steadily, while the USA is likely to grow at consistent rates. Japan posts the lowest CAGR at 5.6%, yet still underscores a broadly positive trajectory for the global Flip Top Vials Market. In 2024, Germany held a dominant revenue in the Western Europe market and is expected to grow with a CAGR of 8.6%. The USA Flip Top Vials Market is estimated to be valued at USD 510.0 million in 2025 and is anticipated to reach a valuation of USD 510.0 million by 2035. Sales are projected to rise at a CAGR of 0.0% over the forecast period between 2025 and 2035. While Japan and South Korea markets are estimated to be valued at USD 72.3 million and USD 41.1 million respectively in 2025.
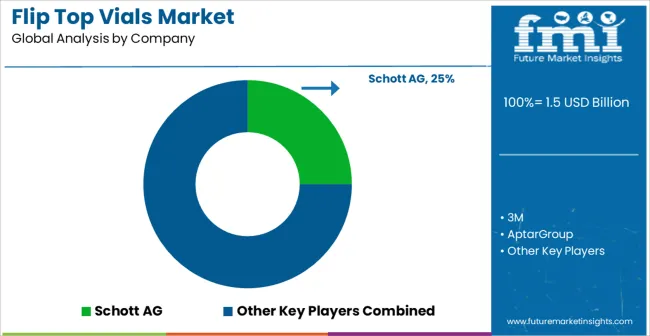
Key Players in the Flip Top Vials Market

Flip Top Vials Market Analysis By Company

  • Schott AG
  • 3M
  • AptarGroup
  • Ecolopharm
  • Filtration Group Corporation
  • Sorbead India
  • Adelphi Group
  • Gerresheimer
  • MedicoPack
  • Amcor
  • Pacific Vials

Scope of the Report

Item Value
Quantitative Units USD 1.5 Billion
Material Type Plastic and Glass
Capacity 5 ml to 10 ml, Less than 5 ml, and 10 ml & Above
End Use Medical, Food & Beverages, Laboratories, Forensics, and Cosmetics
Regions Covered North America, Europe, Asia-Pacific, Latin America, Middle East & Africa
Country Covered United States, Canada, Germany, France, United Kingdom, China, Japan, India, Brazil, South Africa
Key Companies Profiled Schott AG, 3M, AptarGroup, Ecolopharm, Filtration Group Corporation, Sorbead India, Adelphi Group, Gerresheimer, MedicoPack, Amcor, and Pacific Vials

Flip Top Vials Market by Segments

Material Type:

  • Plastic
  • Glass

Capacity:

  • 5 ml to 10 ml
  • Less than 5 ml
  • 10 ml & Above

End Use:

  • Medical
  • Food & Beverages
  • Laboratories
  • Forensics
  • Cosmetics

Region:

  • North America
    • USA
    • Canada
    • Mexico
  • Latin America
    • Brazil
    • Chile
    • Rest of Latin America
  • Western Europe
    • Germany
    • UK
    • Italy
    • Spain
    • France
    • Nordic
    • BENELUX
    • Rest of Western Europe
  • Eastern Europe
    • Russia
    • Poland
    • Hungary
    • Balkan & Baltic
    • Rest of Eastern Europe
  • East Asia
    • China
    • Japan
    • South Korea
  • South Asia and Pacific
    • India
    • ASEAN
    • Australia & New Zealand
    • Rest of South Asia and Pacific
  • Middle East & Africa
    • Kingdom of Saudi Arabia
    • Other GCC Countries
    • Turkiye
    • South Africa
    • Other African Union
    • Rest of Middle East & Africa

Table of Content

  1. Executive Summary
    • Global Market Outlook
    • Demand-side Trends
    • Supply-side Trends
    • Technology Roadmap Analysis
    • Analysis and Recommendations
  2. Market Overview
    • Market Coverage / Taxonomy
    • Market Definition / Scope / Limitations
  3. Market Background
    • Market Dynamics
      • Drivers
      • Restraints
      • Opportunity
      • Trends
    • Scenario Forecast
      • Demand in Optimistic Scenario
      • Demand in Likely Scenario
      • Demand in Conservative Scenario
    • Opportunity Map Analysis
    • Product Life Cycle Analysis
    • Supply Chain Analysis
    • Investment Feasibility Matrix
    • Value Chain Analysis
    • PESTLE and Porter’s Analysis
    • Regulatory Landscape
    • Regional Parent Market Outlook
    • Production and Consumption Statistics
    • Import and Export Statistics
  4. Global Market Analysis 2020 to 2024 and Forecast, 2025 to 2035
    • Historical Market Size Value (USD Million) Analysis, 2020 to 2024
    • Current and Future Market Size Value (USD Million) Projections, 2025 to 2035
      • Y-o-Y Growth Trend Analysis
      • Absolute $ Opportunity Analysis
  5. Global Market Pricing Analysis 2020 to 2024 and Forecast 2025 to 2035
  6. Global Market Analysis 2020 to 2024 and Forecast 2025 to 2035, By Material Type
    • Introduction / Key Findings
    • Historical Market Size Value (USD Million) Analysis By Material Type , 2020 to 2024
    • Current and Future Market Size Value (USD Million) Analysis and Forecast By Material Type , 2025 to 2035
      • Plastic
      • Glass
    • Y-o-Y Growth Trend Analysis By Material Type , 2020 to 2024
    • Absolute $ Opportunity Analysis By Material Type , 2025 to 2035
  7. Global Market Analysis 2020 to 2024 and Forecast 2025 to 2035, By Capacity
    • Introduction / Key Findings
    • Historical Market Size Value (USD Million) Analysis By Capacity, 2020 to 2024
    • Current and Future Market Size Value (USD Million) Analysis and Forecast By Capacity, 2025 to 2035
      • 5 ml to 10 ml
      • Less than 5 ml
      • 10 ml & Above
    • Y-o-Y Growth Trend Analysis By Capacity, 2020 to 2024
    • Absolute $ Opportunity Analysis By Capacity, 2025 to 2035
  8. Global Market Analysis 2020 to 2024 and Forecast 2025 to 2035, By End Use
    • Introduction / Key Findings
    • Historical Market Size Value (USD Million) Analysis By End Use, 2020 to 2024
    • Current and Future Market Size Value (USD Million) Analysis and Forecast By End Use, 2025 to 2035
      • Medical
      • Food & Beverages
      • Laboratories
      • Forensics
      • Cosmetics
    • Y-o-Y Growth Trend Analysis By End Use, 2020 to 2024
    • Absolute $ Opportunity Analysis By End Use, 2025 to 2035
  9. Global Market Analysis 2020 to 2024 and Forecast 2025 to 2035, By Region
    • Introduction
    • Historical Market Size Value (USD Million) Analysis By Region, 2020 to 2024
    • Current Market Size Value (USD Million) Analysis and Forecast By Region, 2025 to 2035
      • North America
      • Latin America
      • Western Europe
      • Eastern Europe
      • East Asia
      • South Asia and Pacific
      • Middle East & Africa
    • Market Attractiveness Analysis By Region
  10. North America Market Analysis 2020 to 2024 and Forecast 2025 to 2035, By Country
    • Historical Market Size Value (USD Million) Trend Analysis By Market Taxonomy, 2020 to 2024
    • Market Size Value (USD Million) Forecast By Market Taxonomy, 2025 to 2035
      • By Country
        • USA
        • Canada
        • Mexico
      • By Material Type
      • By Capacity
      • By End Use
    • Market Attractiveness Analysis
      • By Country
      • By Material Type
      • By Capacity
      • By End Use
    • Key Takeaways
  11. Latin America Market Analysis 2020 to 2024 and Forecast 2025 to 2035, By Country
    • Historical Market Size Value (USD Million) Trend Analysis By Market Taxonomy, 2020 to 2024
    • Market Size Value (USD Million) Forecast By Market Taxonomy, 2025 to 2035
      • By Country
        • Brazil
        • Chile
        • Rest of Latin America
      • By Material Type
      • By Capacity
      • By End Use
    • Market Attractiveness Analysis
      • By Country
      • By Material Type
      • By Capacity
      • By End Use
    • Key Takeaways
  12. Western Europe Market Analysis 2020 to 2024 and Forecast 2025 to 2035, By Country
    • Historical Market Size Value (USD Million) Trend Analysis By Market Taxonomy, 2020 to 2024
    • Market Size Value (USD Million) Forecast By Market Taxonomy, 2025 to 2035
      • By Country
        • Germany
        • UK
        • Italy
        • Spain
        • France
        • Nordic
        • BENELUX
        • Rest of Western Europe
      • By Material Type
      • By Capacity
      • By End Use
    • Market Attractiveness Analysis
      • By Country
      • By Material Type
      • By Capacity
      • By End Use
    • Key Takeaways
  13. Eastern Europe Market Analysis 2020 to 2024 and Forecast 2025 to 2035, By Country
    • Historical Market Size Value (USD Million) Trend Analysis By Market Taxonomy, 2020 to 2024
    • Market Size Value (USD Million) Forecast By Market Taxonomy, 2025 to 2035
      • By Country
        • Russia
        • Poland
        • Hungary
        • Balkan & Baltic
        • Rest of Eastern Europe
      • By Material Type
      • By Capacity
      • By End Use
    • Market Attractiveness Analysis
      • By Country
      • By Material Type
      • By Capacity
      • By End Use
    • Key Takeaways
  14. East Asia Market Analysis 2020 to 2024 and Forecast 2025 to 2035, By Country
    • Historical Market Size Value (USD Million) Trend Analysis By Market Taxonomy, 2020 to 2024
    • Market Size Value (USD Million) Forecast By Market Taxonomy, 2025 to 2035
      • By Country
        • China
        • Japan
        • South Korea
      • By Material Type
      • By Capacity
      • By End Use
    • Market Attractiveness Analysis
      • By Country
      • By Material Type
      • By Capacity
      • By End Use
    • Key Takeaways
  15. South Asia and Pacific Market Analysis 2020 to 2024 and Forecast 2025 to 2035, By Country
    • Historical Market Size Value (USD Million) Trend Analysis By Market Taxonomy, 2020 to 2024
    • Market Size Value (USD Million) Forecast By Market Taxonomy, 2025 to 2035
      • By Country
        • India
        • ASEAN
        • Australia & New Zealand
        • Rest of South Asia and Pacific
      • By Material Type
      • By Capacity
      • By End Use
    • Market Attractiveness Analysis
      • By Country
      • By Material Type
      • By Capacity
      • By End Use
    • Key Takeaways
  16. Middle East & Africa Market Analysis 2020 to 2024 and Forecast 2025 to 2035, By Country
    • Historical Market Size Value (USD Million) Trend Analysis By Market Taxonomy, 2020 to 2024
    • Market Size Value (USD Million) Forecast By Market Taxonomy, 2025 to 2035
      • By Country
        • Kingdom of Saudi Arabia
        • Other GCC Countries
        • Turkiye
        • South Africa
        • Other African Union
        • Rest of Middle East & Africa
      • By Material Type
      • By Capacity
      • By End Use
    • Market Attractiveness Analysis
      • By Country
      • By Material Type
      • By Capacity
      • By End Use
    • Key Takeaways
  17. Key Countries Market Analysis
    • USA
      • Pricing Analysis
      • Market Share Analysis, 2024
        • By Material Type
        • By Capacity
        • By End Use
    • Canada
      • Pricing Analysis
      • Market Share Analysis, 2024
        • By Material Type
        • By Capacity
        • By End Use
    • Mexico
      • Pricing Analysis
      • Market Share Analysis, 2024
        • By Material Type
        • By Capacity
        • By End Use
    • Brazil
      • Pricing Analysis
      • Market Share Analysis, 2024
        • By Material Type
        • By Capacity
        • By End Use
    • Chile
      • Pricing Analysis
      • Market Share Analysis, 2024
        • By Material Type
        • By Capacity
        • By End Use
    • Germany
      • Pricing Analysis
      • Market Share Analysis, 2024
        • By Material Type
        • By Capacity
        • By End Use
    • UK
      • Pricing Analysis
      • Market Share Analysis, 2024
        • By Material Type
        • By Capacity
        • By End Use
    • Italy
      • Pricing Analysis
      • Market Share Analysis, 2024
        • By Material Type
        • By Capacity
        • By End Use
    • Spain
      • Pricing Analysis
      • Market Share Analysis, 2024
        • By Material Type
        • By Capacity
        • By End Use
    • France
      • Pricing Analysis
      • Market Share Analysis, 2024
        • By Material Type
        • By Capacity
        • By End Use
    • India
      • Pricing Analysis
      • Market Share Analysis, 2024
        • By Material Type
        • By Capacity
        • By End Use
    • ASEAN
      • Pricing Analysis
      • Market Share Analysis, 2024
        • By Material Type
        • By Capacity
        • By End Use
    • Australia & New Zealand
      • Pricing Analysis
      • Market Share Analysis, 2024
        • By Material Type
        • By Capacity
        • By End Use
    • China
      • Pricing Analysis
      • Market Share Analysis, 2024
        • By Material Type
        • By Capacity
        • By End Use
    • Japan
      • Pricing Analysis
      • Market Share Analysis, 2024
        • By Material Type
        • By Capacity
        • By End Use
    • South Korea
      • Pricing Analysis
      • Market Share Analysis, 2024
        • By Material Type
        • By Capacity
        • By End Use
    • Russia
      • Pricing Analysis
      • Market Share Analysis, 2024
        • By Material Type
        • By Capacity
        • By End Use
    • Poland
      • Pricing Analysis
      • Market Share Analysis, 2024
        • By Material Type
        • By Capacity
        • By End Use
    • Hungary
      • Pricing Analysis
      • Market Share Analysis, 2024
        • By Material Type
        • By Capacity
        • By End Use
    • Kingdom of Saudi Arabia
      • Pricing Analysis
      • Market Share Analysis, 2024
        • By Material Type
        • By Capacity
        • By End Use
    • Turkiye
      • Pricing Analysis
      • Market Share Analysis, 2024
        • By Material Type
        • By Capacity
        • By End Use
    • South Africa
      • Pricing Analysis
      • Market Share Analysis, 2024
        • By Material Type
        • By Capacity
        • By End Use
  18. Market Structure Analysis
    • Competition Dashboard
    • Competition Benchmarking
    • Market Share Analysis of Top Players
      • By Regional
      • By Material Type
      • By Capacity
      • By End Use
  19. Competition Analysis
    • Competition Deep Dive
      • Schott AG
        • Overview
        • Product Portfolio
        • Profitability by Market Segments (Product/Age /Sales Channel/Region)
        • Sales Footprint
        • Strategy Overview
          • Marketing Strategy
          • Product Strategy
          • Channel Strategy
      • 3M
      • AptarGroup
      • Ecolopharm
      • Filtration Group Corporation
      • Sorbead India
      • Adelphi Group
      • Gerresheimer
      • MedicoPack
      • Amcor
      • Pacific Vials
  20. Assumptions & Acronyms Used
  21. Research Methodology

List of Tables

  • Table 1: Global Market Value (USD Million) Forecast by Region, 2020-2035
  • Table 2: Global Market Value (USD Million) Forecast by Material Type , 2020-2035
  • Table 3: Global Market Value (USD Million) Forecast by Capacity, 2020-2035
  • Table 4: Global Market Value (USD Million) Forecast by End Use, 2020-2035
  • Table 5: North America Market Value (USD Million) Forecast by Country, 2020-2035
  • Table 6: North America Market Value (USD Million) Forecast by Material Type , 2020-2035
  • Table 7: North America Market Value (USD Million) Forecast by Capacity, 2020-2035
  • Table 8: North America Market Value (USD Million) Forecast by End Use, 2020-2035
  • Table 9: Latin America Market Value (USD Million) Forecast by Country, 2020-2035
  • Table 10: Latin America Market Value (USD Million) Forecast by Material Type , 2020-2035
  • Table 11: Latin America Market Value (USD Million) Forecast by Capacity, 2020-2035
  • Table 12: Latin America Market Value (USD Million) Forecast by End Use, 2020-2035
  • Table 13: Western Europe Market Value (USD Million) Forecast by Country, 2020-2035
  • Table 14: Western Europe Market Value (USD Million) Forecast by Material Type , 2020-2035
  • Table 15: Western Europe Market Value (USD Million) Forecast by Capacity, 2020-2035
  • Table 16: Western Europe Market Value (USD Million) Forecast by End Use, 2020-2035
  • Table 17: Eastern Europe Market Value (USD Million) Forecast by Country, 2020-2035
  • Table 18: Eastern Europe Market Value (USD Million) Forecast by Material Type , 2020-2035
  • Table 19: Eastern Europe Market Value (USD Million) Forecast by Capacity, 2020-2035
  • Table 20: Eastern Europe Market Value (USD Million) Forecast by End Use, 2020-2035
  • Table 21: East Asia Market Value (USD Million) Forecast by Country, 2020-2035
  • Table 22: East Asia Market Value (USD Million) Forecast by Material Type , 2020-2035
  • Table 23: East Asia Market Value (USD Million) Forecast by Capacity, 2020-2035
  • Table 24: East Asia Market Value (USD Million) Forecast by End Use, 2020-2035
  • Table 25: South Asia and Pacific Market Value (USD Million) Forecast by Country, 2020-2035
  • Table 26: South Asia and Pacific Market Value (USD Million) Forecast by Material Type , 2020-2035
  • Table 27: South Asia and Pacific Market Value (USD Million) Forecast by Capacity, 2020-2035
  • Table 28: South Asia and Pacific Market Value (USD Million) Forecast by End Use, 2020-2035
  • Table 29: Middle East & Africa Market Value (USD Million) Forecast by Country, 2020-2035
  • Table 30: Middle East & Africa Market Value (USD Million) Forecast by Material Type , 2020-2035
  • Table 31: Middle East & Africa Market Value (USD Million) Forecast by Capacity, 2020-2035
  • Table 32: Middle East & Africa Market Value (USD Million) Forecast by End Use, 2020-2035

List of Figures

  • Figure 1: Global Market Pricing Analysis
  • Figure 2: Global Market Value (USD Million) Forecast 2020-2035
  • Figure 3: Global Market Value Share and BPS Analysis by Material Type , 2025 and 2035
  • Figure 4: Global Market Y-o-Y Growth Comparison by Material Type , 2025-2035
  • Figure 5: Global Market Attractiveness Analysis by Material Type
  • Figure 6: Global Market Value Share and BPS Analysis by Capacity, 2025 and 2035
  • Figure 7: Global Market Y-o-Y Growth Comparison by Capacity, 2025-2035
  • Figure 8: Global Market Attractiveness Analysis by Capacity
  • Figure 9: Global Market Value Share and BPS Analysis by End Use, 2025 and 2035
  • Figure 10: Global Market Y-o-Y Growth Comparison by End Use, 2025-2035
  • Figure 11: Global Market Attractiveness Analysis by End Use
  • Figure 12: Global Market Value (USD Million) Share and BPS Analysis by Region, 2025 and 2035
  • Figure 13: Global Market Y-o-Y Growth Comparison by Region, 2025-2035
  • Figure 14: Global Market Attractiveness Analysis by Region
  • Figure 15: North America Market Incremental Dollar Opportunity, 2025-2035
  • Figure 16: Latin America Market Incremental Dollar Opportunity, 2025-2035
  • Figure 17: Western Europe Market Incremental Dollar Opportunity, 2025-2035
  • Figure 18: Eastern Europe Market Incremental Dollar Opportunity, 2025-2035
  • Figure 19: East Asia Market Incremental Dollar Opportunity, 2025-2035
  • Figure 20: South Asia and Pacific Market Incremental Dollar Opportunity, 2025-2035
  • Figure 21: Middle East & Africa Market Incremental Dollar Opportunity, 2025-2035
  • Figure 22: North America Market Value Share and BPS Analysis by Country, 2025 and 2035
  • Figure 23: North America Market Value Share and BPS Analysis by Material Type , 2025 and 2035
  • Figure 24: North America Market Y-o-Y Growth Comparison by Material Type , 2025-2035
  • Figure 25: North America Market Attractiveness Analysis by Material Type
  • Figure 26: North America Market Value Share and BPS Analysis by Capacity, 2025 and 2035
  • Figure 27: North America Market Y-o-Y Growth Comparison by Capacity, 2025-2035
  • Figure 28: North America Market Attractiveness Analysis by Capacity
  • Figure 29: North America Market Value Share and BPS Analysis by End Use, 2025 and 2035
  • Figure 30: North America Market Y-o-Y Growth Comparison by End Use, 2025-2035
  • Figure 31: North America Market Attractiveness Analysis by End Use
  • Figure 32: Latin America Market Value Share and BPS Analysis by Country, 2025 and 2035
  • Figure 33: Latin America Market Value Share and BPS Analysis by Material Type , 2025 and 2035
  • Figure 34: Latin America Market Y-o-Y Growth Comparison by Material Type , 2025-2035
  • Figure 35: Latin America Market Attractiveness Analysis by Material Type
  • Figure 36: Latin America Market Value Share and BPS Analysis by Capacity, 2025 and 2035
  • Figure 37: Latin America Market Y-o-Y Growth Comparison by Capacity, 2025-2035
  • Figure 38: Latin America Market Attractiveness Analysis by Capacity
  • Figure 39: Latin America Market Value Share and BPS Analysis by End Use, 2025 and 2035
  • Figure 40: Latin America Market Y-o-Y Growth Comparison by End Use, 2025-2035
  • Figure 41: Latin America Market Attractiveness Analysis by End Use
  • Figure 42: Western Europe Market Value Share and BPS Analysis by Country, 2025 and 2035
  • Figure 43: Western Europe Market Value Share and BPS Analysis by Material Type , 2025 and 2035
  • Figure 44: Western Europe Market Y-o-Y Growth Comparison by Material Type , 2025-2035
  • Figure 45: Western Europe Market Attractiveness Analysis by Material Type
  • Figure 46: Western Europe Market Value Share and BPS Analysis by Capacity, 2025 and 2035
  • Figure 47: Western Europe Market Y-o-Y Growth Comparison by Capacity, 2025-2035
  • Figure 48: Western Europe Market Attractiveness Analysis by Capacity
  • Figure 49: Western Europe Market Value Share and BPS Analysis by End Use, 2025 and 2035
  • Figure 50: Western Europe Market Y-o-Y Growth Comparison by End Use, 2025-2035
  • Figure 51: Western Europe Market Attractiveness Analysis by End Use
  • Figure 52: Eastern Europe Market Value Share and BPS Analysis by Country, 2025 and 2035
  • Figure 53: Eastern Europe Market Value Share and BPS Analysis by Material Type , 2025 and 2035
  • Figure 54: Eastern Europe Market Y-o-Y Growth Comparison by Material Type , 2025-2035
  • Figure 55: Eastern Europe Market Attractiveness Analysis by Material Type
  • Figure 56: Eastern Europe Market Value Share and BPS Analysis by Capacity, 2025 and 2035
  • Figure 57: Eastern Europe Market Y-o-Y Growth Comparison by Capacity, 2025-2035
  • Figure 58: Eastern Europe Market Attractiveness Analysis by Capacity
  • Figure 59: Eastern Europe Market Value Share and BPS Analysis by End Use, 2025 and 2035
  • Figure 60: Eastern Europe Market Y-o-Y Growth Comparison by End Use, 2025-2035
  • Figure 61: Eastern Europe Market Attractiveness Analysis by End Use
  • Figure 62: East Asia Market Value Share and BPS Analysis by Country, 2025 and 2035
  • Figure 63: East Asia Market Value Share and BPS Analysis by Material Type , 2025 and 2035
  • Figure 64: East Asia Market Y-o-Y Growth Comparison by Material Type , 2025-2035
  • Figure 65: East Asia Market Attractiveness Analysis by Material Type
  • Figure 66: East Asia Market Value Share and BPS Analysis by Capacity, 2025 and 2035
  • Figure 67: East Asia Market Y-o-Y Growth Comparison by Capacity, 2025-2035
  • Figure 68: East Asia Market Attractiveness Analysis by Capacity
  • Figure 69: East Asia Market Value Share and BPS Analysis by End Use, 2025 and 2035
  • Figure 70: East Asia Market Y-o-Y Growth Comparison by End Use, 2025-2035
  • Figure 71: East Asia Market Attractiveness Analysis by End Use
  • Figure 72: South Asia and Pacific Market Value Share and BPS Analysis by Country, 2025 and 2035
  • Figure 73: South Asia and Pacific Market Value Share and BPS Analysis by Material Type , 2025 and 2035
  • Figure 74: South Asia and Pacific Market Y-o-Y Growth Comparison by Material Type , 2025-2035
  • Figure 75: South Asia and Pacific Market Attractiveness Analysis by Material Type
  • Figure 76: South Asia and Pacific Market Value Share and BPS Analysis by Capacity, 2025 and 2035
  • Figure 77: South Asia and Pacific Market Y-o-Y Growth Comparison by Capacity, 2025-2035
  • Figure 78: South Asia and Pacific Market Attractiveness Analysis by Capacity
  • Figure 79: South Asia and Pacific Market Value Share and BPS Analysis by End Use, 2025 and 2035
  • Figure 80: South Asia and Pacific Market Y-o-Y Growth Comparison by End Use, 2025-2035
  • Figure 81: South Asia and Pacific Market Attractiveness Analysis by End Use
  • Figure 82: Middle East & Africa Market Value Share and BPS Analysis by Country, 2025 and 2035
  • Figure 83: Middle East & Africa Market Value Share and BPS Analysis by Material Type , 2025 and 2035
  • Figure 84: Middle East & Africa Market Y-o-Y Growth Comparison by Material Type , 2025-2035
  • Figure 85: Middle East & Africa Market Attractiveness Analysis by Material Type
  • Figure 86: Middle East & Africa Market Value Share and BPS Analysis by Capacity, 2025 and 2035
  • Figure 87: Middle East & Africa Market Y-o-Y Growth Comparison by Capacity, 2025-2035
  • Figure 88: Middle East & Africa Market Attractiveness Analysis by Capacity
  • Figure 89: Middle East & Africa Market Value Share and BPS Analysis by End Use, 2025 and 2035
  • Figure 90: Middle East & Africa Market Y-o-Y Growth Comparison by End Use, 2025-2035
  • Figure 91: Middle East & Africa Market Attractiveness Analysis by End Use
  • Figure 92: Global Market - Tier Structure Analysis
  • Figure 93: Global Market - Company Share Analysis

Frequently Asked Questions

How big is the flip top vials market in 2025?

The global flip top vials market is estimated to be valued at USD 1.5 billion in 2025.

What will be the size of flip top vials market in 2035?

The market size for the flip top vials market is projected to reach USD 3.1 billion by 2035.

How much will be the flip top vials market growth between 2025 and 2035?

The flip top vials market is expected to grow at a 7.5% CAGR between 2025 and 2035.

What are the key product types in the flip top vials market?

The key product types in flip top vials market are plastic and glass.

Which capacity segment to contribute significant share in the flip top vials market in 2025?

In terms of capacity, 5 ml to 10 ml segment to command 45.0% share in the flip top vials market in 2025.

Explore Similar Insights

Future Market Insights

Flip Top Vials Market

Chat With MaRIA

Chat With

MaRIA

Hi There, I am MaRIA, Your Market Research Intelligence Assistant. How may I help you?