
- Market Size (2026)
- USD 2120.0 Mn
- Forecast (2036)
- USD 3453.3 Mn
- CAGR (2026 to 2036)
- 5.0%
How big is the Floating Storage Regasification Unit (FSRU) Market in 2026?
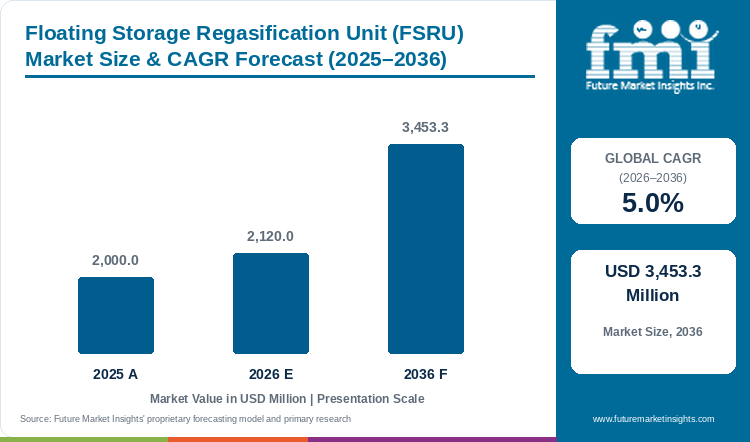
By 2036, FMI expects the global FSRU market to reach USD 3,453.3 million, growing at 5.0% a year from 2026 to 2036. The market was valued at USD 2,000.0 million in 2025. FMI estimates USD 2,120.0 million for 2026.
Floating Storage Regasification Unit (FSRU) Market Size and Forecast
Table 1: Floating Storage Regasification Unit (FSRU) Market Size and Forecast
| Market size and forecast | Value |
|---|---|
| Market size in 2025 | USD 2,000.0 million |
| Estimated market size in 2026 | USD 2,120.0 million |
| Projected market size by 2036 | USD 3,453.3 million |
| CAGR from 2026 to 2036 | 5.0% |
Source: Future Market Insights analysis of the floating storage regasification unit (FSRU) market, 2026.
Established terminals are creating a second investment cycle around vessel renewal and longer service contracts. Access to an appropriate ship and a financeable customer contract matter together. In August 2026, Excelerate Energy agreed to extend the Sequoia contract with Petrobras through 2038. A planned reliquefaction installation during the vessel's 2028 dry dock forms part of that agreement.
New demand also includes replacing temporary arrangements with a dedicated vessel. Höegh Evi's May 2025 agreement with Egypt's EGAS specified a 10-year charter for the converted Hoegh Gandria. Deployment was scheduled for the fourth quarter of 2026, replacing Hoegh Galleon before its planned transfer to Australia. In Europe, EemsEnergyTerminal reported in July 2026 that most capacity for its proposed 2028 to 2036 extension had been contracted. The final investment decision still depended on permits. Commercial commitments therefore support the outlook, while shore approvals and vessel availability continue to determine when revenue begins.
Key Market Trends & Insights
- Terminal ownership and marine operation remain separate sources of revenue. At Wilhelmshaven 2, DET operates the terminal while Excelerate performs onboard regasification. KN Energies and Gasfin have different technical and commercial responsibilities. Contract comparisons must identify which services the quoted fee actually covers.
- Boil-off management is drawing investment into existing assets. The July 2025 agreement for Experience in Brazil specified a reliquefaction installation at a future dry dock. This supports an equipment and service opportunity within the chartered fleet.
- Small storage barges remain relevant within larger terminal systems. EXMAR reports that its Eemshaven unit achieved 100.0% uptime during 2025. Its role shows that storage capacity says little about a unit's contribution to a combined import installation.
Regional Highlights
- Share of global revenue grows for Bangladesh, Indonesia and Argentina. FMI projects Bangladesh from 7.0% to 7.8%, Indonesia from 5.0% to 5.6% and Argentina from 4.0% to 4.5% by 2036.
- Global share declines for Italy, Germany and the Netherlands even as revenue grows. FMI's 2036 shares are Italy 6.2% (from 7.0%), Germany 9.2% (from 10.0%) and the Netherlands 5.3% (from 6.0%).
Analyst Perspective
“The next FSRU contract cycle will reward owners that can deliver the correct ship at a credible delivery date. An extension supported by a defined upgrade programme may be more valuable than an uncommitted new terminal announcement. Buyers need to resolve the shore connection and replacement arrangements before the existing charter expires. A low daily vessel rate loses its attraction if the terminal cannot receive cargoes when required.”
- Nikhil Kaitwade, Principal Consultant, FMI
How is the Floating Storage Regasification Unit (FSRU) Market segmented?
- By type: Converted LNG carrier FSRU, Newbuild FSRU and Other floating regasification.
- By capacity: Below 150,000 cubic metres, 150,000 to 170,000 cubic metres and Above 170,000 cubic metres.
- By charter: Long-term charter (over 10 years), Medium-term charter and Short-term and spot charter.
- By region: Latin America, Europe, Middle East and North Africa, South Asia, Southeast Asia and Rest of world.
Why does the Converted LNG carrier FSRU segment lead by Type in the Floating Storage Regasification Unit (FSRU) Market in 2026?
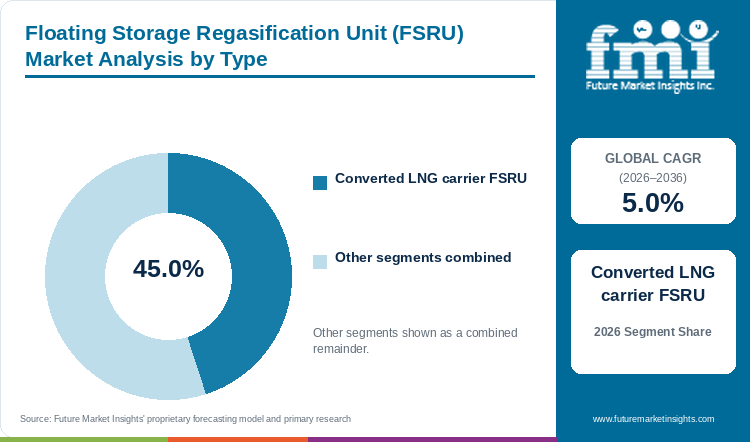
The Converted LNG carrier FSRU segment holds 45.0% of the Floating Storage Regasification Unit (FSRU) Market by type in 2026.
The conversion business connects the trading life of an LNG carrier with a new terminal contract. Existing hulls offer a route into the regasification fleet when their condition and layout support the required conversion. They still need engineering work and a customer capable of committing to the resulting asset. Höegh Gandria was acquired in 2023 with conversion in mind. The later EGAS charter connected that vessel strategy with a specific receiving location.
FMI expects the converted-carrier share to ease to 38.8% by 2036 as newbuild FSRUs reach 48.2%. It indicates faster value growth for purpose-built assets from a slightly smaller 2026 base. Converted-carrier value is forecast to grow at 3.5%, compared with 6.5% for newbuilds. Fleet owners therefore have different ways to expand, with asset selection depending on delivery timing and the customer's service requirements.
Conversion decisions also connect terminal spending to specialist equipment. The relevant cryogenic pump market covers part of the equipment chain, while cryogenic valves sit within the isolation and flow-control package. Their commercial relevance lies in installation, maintenance and replacement during a vessel's service life.
Newbuild FSRU and Other floating regasification together hold the remaining 55.0% by type.
Table 2: Type, 2026 Share
| Leading Share | 2026 market share |
|---|---|
| Converted LNG carrier FSRU | 45.0% |
| All Other Segments Combined Share | 55.0% |
Source: Future Market Insights analysis of the floating storage regasification unit (FSRU) market, 2026.
Why does the 150,000 to 170,000 cubic metres segment lead by Capacity in the Floating Storage Regasification Unit (FSRU) Market in 2026?
The 150,000 to 170,000 cubic metres segment holds 40.0% of the Floating Storage Regasification Unit (FSRU) Market by capacity in 2026.
A 170,000 cubic metre storage design appears in operating projects with quite different customers. MOL's Jawa Satu serves an integrated Indonesian power project, while Türkiye's Ertuğrul Gazi supports the national gas transmission system. These examples support the commercial relevance of the capacity band.
The middle band is forecast to retain a 40.4% share in 2036. Above 170,000 cubic metre assets grow more quickly at a 6.6% value CAGR, taking their share from 25.0% to 29.1%. This gives owners a reason to consider larger vessels where customer commitments justify them. The storage measure needs to be read beside local gas delivery requirements. The ship's storage tank is one part of a system that includes the receiving berth and gas connection.
Capacity choice is therefore a terminal design and commercial scheduling issue. Adding storage has limited value if customers cannot receive more gas or if the cargo programme does not use the additional space. Smaller units also retain a role. Wilhelmshaven's Excelsior has 138,000 cubic metres of storage and operates under a five-year charter. The market consequently supports several sizes within a wider cryogenic technology supply chain, with terminal configuration determining the appropriate combination.
Below 150,000 cubic metres and Above 170,000 cubic metres together hold the remaining 60.0% by capacity.
Table 3: Capacity, 2026 Share
| Leading Share | 2026 market share |
|---|---|
| 150,000 to 170,000 cubic metres | 40.0% |
| All Other Segments Combined Share | 60.0% |
Source: Future Market Insights analysis of the floating storage regasification unit (FSRU) market, 2026.
Why does the Long-term charter (over 10 years) segment lead by Charter in the Floating Storage Regasification Unit (FSRU) Market in 2026?
The Long-term charter (over 10 years) segment holds 50.0% of the Floating Storage Regasification Unit (FSRU) Market by charter in 2026.
Longer charters align vessel employment with the time needed to recover investment in a terminal and its connection. They also give the customer a defined marine asset for a continuing import programme. The commercial benefit depends on the agreement's actual duration and termination rights. A charter counts in the over-10-year category only if its actual duration exceeds 10 years.
An April 2025 investor presentation describes a portfolio built around take-or-pay contracts and identifies a typical initial duration of 10 years. It separately lists customer-specific contracts and extension dates. Under the FMI outlook, the over-10-year category grows at 4.5% through 2036, while short-term and spot charter value grows at 6.0%.
The resulting share adjustment is moderate: the leading charter category declines to 47.8% by 2036. Shorter commitments retain a place where import needs are seasonal or where a permanent terminal strategy is still being settled. Owners seeking those opportunities face a different commercial problem from owners funding a dedicated newbuild. A vessel available for a brief deployment may need another customer before the first contract concludes. Renewal options and redeployment costs therefore matter alongside the headline rate.
Medium-term charter and Short-term and spot charter together hold the remaining 50.0% by charter.
Table 4: Charter, 2026 Share
| Leading Share | 2026 market share |
|---|---|
| Long-term charter (over 10 years) | 50.0% |
| All Other Segments Combined Share | 50.0% |
Source: Future Market Insights analysis of the floating storage regasification unit (FSRU) market, 2026.
What are the key drivers restraints and opportunities?
Replacement schedules and gas supply diversification support FSRU demand. Permitting and connection delays constrain delivery. Upgrades to contracted vessels create an additional route to value growth.
Driver
Importers are securing marine capacity before temporary arrangements expire, creating demand for replacement and extended charters.
Restraint
A completed ship cannot generate terminal service revenue without the required receiving infrastructure and approvals.
Opportunity
Fleet owners can connect a charter renewal with equipment investment that improves an asset's operating performance.
How do purchasing rules and qualification affect floating storage regasification unit (FSRU) market demand?
FSRU demand extends beyond the first year in which a country begins importing LNG. An existing terminal may need continued marine capacity after its original contract ends. That creates an investment decision around extension, replacement or a different terminal configuration. EemsEnergyTerminal's June 2026 conditional decision followed customer contracts and a government guarantee. The final investment decision remained dependent on permits. This sequence matters commercially because customer commitments support a project before the last approval is obtained.
The growth opportunity also includes more value from an installed vessel. Equipment improvements can be timed to a planned dry dock and linked to revised contract economics. In Brazil, the Experience agreement identifies a specific upgrade programme without requiring the opening of another receiving site. FMI therefore expects operating assets and new projects to contribute through different spending cycles. Shipowners and component suppliers need to distinguish a charter extension from a vessel order when assessing the opportunity.
What limits reliable floating storage regasification unit (FSRU) market supply and quality?
Delivery risk sits at the interface between the ship and the terminal. Wilhelmshaven 2 records separate milestones for arrival, connection and commercial operation. Treating those dates as interchangeable overstates the point at which a project begins serving contracted customers. Commercial schedules need an explicit boundary between marine readiness and acceptance of the combined installation.
Regulatory responsibility is equally specific. The IMO's IGC Code sets standards for gas carriers within its applicable construction categories. Shore-side permissions and terminal access rules remain separate matters. An investment case must therefore account for the ship's required compliance and the receiving site's approvals. These constraints support experienced marine contractors but also expose them to delay when another party controls the remaining work.
Where can suppliers win additional business in the floating storage regasification unit (FSRU) market?
Suppliers have an opening in renewal programmes that combine vessel availability with a credible equipment schedule. The customer needs continuity during a transfer or shipyard stay, while the owner needs clarity on who pays for the modifications. Carefully scoped service agreements can assign these responsibilities before an existing charter expires.
There is also adjacent demand for LNG distribution and marine fuel supply. The LNG bunkering market concerns a different end use from national gas-grid regasification. Shared storage and logistics can connect the two, but an FSU serving a distribution hub does not become an FSRU unless regasification is included. BW LNG's project descriptions explicitly distinguish the two asset types.
Floating Storage Regasification Unit (FSRU) Market by Country (2026 to 2036)
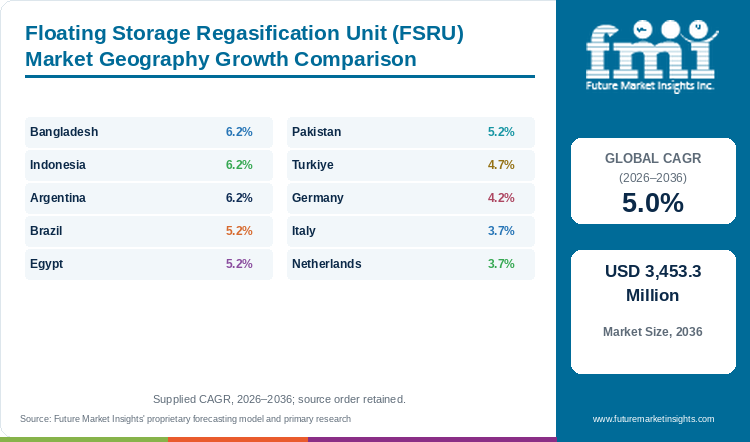
Table 5: Floating Storage Regasification Unit (FSRU) Market Country Growth Forecast
| Country | CAGR, 2026 to 2036 |
|---|---|
| Bangladesh | 6.2% |
| Indonesia | 6.2% |
| Argentina | 6.2% |
| Brazil | 5.2% |
| Egypt | 5.2% |
| Pakistan | 5.2% |
| Turkiye | 4.7% |
| Germany | 4.2% |
| Italy | 3.7% |
| Netherlands | 3.7% |
Source: Future Market Insights analysis of the floating storage regasification unit (FSRU) market, 2026.
Bangladesh
Cargo supply has a direct bearing on the commercial use of Bangladesh's receiving assets. An agreement with QatarEnergy provides for LNG deliveries beginning in January 2026. The stated purchase volume is approximately 0.9 million tonnes a year in 2026 and 2027, increasing to 1.0 million tonnes from 2028. A supply agreement supports the cargo side of a terminal programme. It should still be distinguished from the charter that makes a regasification vessel available.
Bangladesh is one of three named countries with a 6.2% FSRU market CAGR over 2026 to 2036. FMI projects market value of USD 148.4 million in 2026 and USD 270.0 million in 2036. The outlook reflects a smaller initial revenue base than Brazil or Egypt, with a faster expected expansion in value.
For a marine infrastructure provider, the commercial attraction is a receiving programme with a clearly identified customer and continuing LNG requirements. The risk is that different pieces of the chain do not operate on the same timetable. Cargo purchasing, vessel maintenance and gas delivery each require an agreed schedule. A terminal owner should therefore evaluate the supply arrangement alongside the marine service commitment. An additional ship is useful only if the terminal configuration and downstream arrangements support it. Suppliers offering operating support need to understand the terminal's agreed service windows and the responsibilities held by other parties.
Indonesia
Jawa Satu demonstrates a project structure in which the floating terminal and the power station form part of the same commercial chain. MOL reported that commercial operation began in March 2024 for the FSRU serving Indonesia's Jawa 1 project. The associated power station has 1,760.0 megawatts of capacity and a 25-year electricity sales period to PLN. The ship is therefore linked to a specific electricity customer arrangement, instead of simply offering open import capacity to any gas purchaser.
FMI forecasts Indonesia's FSRU market value to reach USD 192.9 million by 2036 from USD 106.0 million in 2026. The 6.2% CAGR over the period is among the highest in the named country group. The lower starting value allows a single material project or contract expansion to have a larger effect than in markets with several established import terminals.
The integrated structure gives vessel providers a clearly defined operating purpose, but also creates dependencies between the marine and power facilities. Terminal readiness and the generating project's service schedule need to remain aligned. A buyer cannot assess the FSRU solely by its storage size, because the gas delivery requirement follows the power project's obligations. Project sponsors must decide who holds the vessel and who contracts for each part of the chain. That allocation affects financing and the timing of cash flows. Indonesia's opportunity consequently favours marine providers that can participate in a wider contracted project without presenting the entire power station's value as FSRU revenue.
Argentina
Seasonal procurement gives Argentina a different FSRU demand pattern from a year-round gas-to-power project. Resolution 33/2026 established a tender framework for a private LNG importer and aggregator using Escobar. It allocated terminal capacity during the April to September 2026 winter period under a one-year contract. The resolution identified Escobar as the country's operating LNG regasification terminal.
The FMI outlook places Argentina's FSRU market value at USD 84.8 million in 2026 and USD 154.3 million in 2036. Its 6.2% CAGR is a value forecast for floating infrastructure activity. Changes in domestic gas availability and winter demand can alter the terminal's use without eliminating the need to maintain access to receiving capacity. In the floating storage regasification unit market, Argentina's revenue grows 1.8 times over the decade, against 1.6 times globally. Global revenue share for Argentina increases from 4.0% to 4.5%. Revenue in Argentina climbs by USD 69.5 million, eighth among the ten.
The owner's commercial problem is matching a ship with the period in which the customer needs it. A seasonal arrangement may leave time for alternative employment, but redeployment has a schedule and a cost. The customer needs confidence that the vessel will be ready for the required winter window. Tender design and the allocation of terminal access therefore have direct implications for charter terms. Argentina's opportunity is strongest for providers able to manage those obligations precisely.
Brazil
Brazil's leading position rests on established terminal relationships that support further investment in vessels already serving the country. FMI projects USD 296.8 million of market value in 2026, rising to USD 491.2 million by 2036 at a 5.2% CAGR. The commercial issue is how an operating terminal secures efficient marine capacity over the next contract period. That is different from assuming every increase in value requires another receiving location.
The Sequoia extension agreed with Petrobras in August 2026 reaches through 2038. Its planned 2028 reliquefaction installation ties asset improvement to a longer revenue period. For the shipowner, the connection between equipment spending and contract duration reduces the risk of upgrading a vessel shortly before employment ends. Owners bidding in Brazil must price both the upgrade and the longer employment period it unlocks. For the terminal customer, the programme makes the ship's future service requirements part of the agreement.
Brazil also illustrates why country value should be assessed at the terminal and contract level. Petrobras-related capacity and integrated industrial projects serve different demand patterns. A terminal linked to an industrial user has a different commercial exposure from capacity supporting a wider gas network. The same national LNG import total cannot describe both contract structures. The outlook therefore depends on continued service commitments, the timing of dry docks and how much of each upgrade becomes part of the owner's agreed scope.
Egypt
A replacement deadline gives Egypt a distinctive position in FSRU procurement. Höegh Evi's agreement for Gandria was designed to replace Galleon before the latter's planned move to Port Kembla in 2027. The May 2025 announcement scheduled Gandria for the fourth quarter of 2026 and specified peak regasification capacity of up to 1,000.0 million standard cubic feet per day. The announcement establishes the contracted plan and its intended sequence.
FMI forecasts Egypt's market value at USD 254.4 million in 2026 and USD 421.0 million in 2036. The 5.2% CAGR over 2026 to 2036 reflects the continuing economic contribution of floating import infrastructure. Contract continuity matters because the customer needs marine capacity at the time the previous arrangement ends. A break between those dates would affect the use of connected receiving infrastructure as well as the vessel charter.
The Egyptian opportunity consequently includes conversion work and the coordination of successive assets. A shipowner must match the conversion programme to the terminal's required operating window. The buyer must align that window with its cargo and gas delivery arrangements. These obligations are commercially linked even though they may sit in different contracts. The market supports owners able to manage a defined transfer instead of simply offer an uncommitted ship. Continued charter value should still be distinguished from an assumption that every announced conversion is already operating.
Pakistan
Port Qasim provides Pakistan with an established commercial base for floating regasification. Vopak identifies Engro Elengy as an operating LNG import facility since 2015, with stated throughput capacity of 6.2 billion cubic metres per year. Its services include storage for regasification and delivery into the transmission network. The relevant investment question is therefore how a mature receiving facility continues to secure reliable marine capacity and appropriate operating support.
FMI forecasts a 5.2% CAGR for Pakistan's FSRU market from 2026 to 2036. Market value advances from USD 169.6 million to USD 280.7 million. A forecast of charter and related fleet value does not mean that the terminal processes its full nameplate throughput in every year. Terminal capability, LNG purchases and actual gas delivery remain separate measures. Pakistan accounts for 8.0% of global revenue in 2026 and 8.1% in 2036. By absolute increase, Pakistan ranks fifth with USD 111.1 million over the decade.
The vessel may be required to remain available even when the customer's cargo programme changes. The agreement must consequently define the service obligation and the allocation of operating costs. In Pakistan, the operating history at Port Qasim gives incumbent relationships practical value. New suppliers still need a role that fits the existing installation and ownership structure. Entry through an equipment replacement or a specific service contract may differ considerably from offering an entire new terminal.
Turkiye
Türkiye's floating terminals are part of a gas entry system that includes both land-based LNG installations and FSRUs. In December 2025, the energy ministry reported five LNG entry points, including three FSRU locations. Ertuğrul Gazi had completed its 100th ship-to-ship transfer and had supplied 9.3 billion cubic metres to the transmission system since entering service. This operating history makes the national opportunity more closely tied to asset reliability and network service than to first-time terminal adoption.
The FMI outlook assigns Turkiye USD 233.2 million in 2026 market value. That rises to USD 368.0 million by 2036 at a 4.7% CAGR over the forecast period. The country retains a large value base while expanding more slowly than several smaller importing markets. An established network of entry points offers a different commercial setting from a single newly connected project.
Vessel owners serving this market must consider how the customer uses several gas entry routes. The required operating profile may vary with the availability of other imports and domestic network needs. A charter therefore needs clear service commitments even when the terminal is not nominated at a constant rate. Storage capacity and peak send-out also have different meanings. Ertuğrul Gazi's 170,000.0 cubic metres describes LNG storage, while its daily gas delivery measure describes a flow. Confusing the two would distort comparisons with other vessels and overstate the gas that can be supplied over a full year.
Germany
The timetable at Wilhelmshaven 2 demonstrates how German FSRU demand depends on the readiness of an entire terminal. Excelsior arrived in April 2025, was connected in May and entered commercial operation at the end of August. DET identifies a five-year vessel charter and separate responsibilities for terminal operation, commercial management and onboard regasification. Those distinctions matter when evaluating which party earns each part of a terminal fee.
Germany's market value is projected to increase from USD 212.0 million in 2026 to USD 318.8 million in 2036. The forecast CAGR of 4.2% is below the global rate. Germany's 4.2% CAGR sits 0.8 points below the global 5.0%.
The commercial priority is matching the remaining charter period with the customer's terminal strategy. The ship's availability has value only when its berth and gas connection are ready. Once operational, maintenance windows need to be coordinated with capacity commitments and cargo arrivals. These are distinct services with different counterparties, so a low vessel rate does not describe total terminal economics. A buyer comparing offers should examine the contracted marine scope alongside the costs and responsibilities retained ashore. The market remains open to experienced shipowners, terminal specialists and maintenance providers, but their roles should be assessed individually. Germany's revenue outlook is therefore a measure of continuing floating import activity instead of a count of newly commissioned installations.
Italy
Italy's latest floating terminal investment connects a purchased ship with a regulated capacity allocation process. Snam announced completion of BW Singapore commissioning in April 2025, followed by the start of commercial activity in May. The vessel added 5.0 billion cubic metres of annual regasification capacity.
FMI projects Italy's FSRU market value at USD 148.4 million in 2026 and USD 212.7 million by 2036. The 3.7% CAGR over 2026 to 2036 places the country below the global growth rate. The size of the installed system means that operating performance and the duration of service arrangements matter as well as additional capacity. Italy contributes USD 64.3 million of new revenue, ninth of ten.
The Italian structure also separates the economic roles of a vessel seller and an operating service provider. BW Singapore's transaction history does not mean BW LNG remains the ship's owner after sale. Golar's 2025 annual report identifies FSRU operating and maintenance revenue from Snam. The commercial opportunity may therefore continue after a ship changes hands, through a service relationship with the new asset owner. Investors and prospective suppliers should identify the actual contract counterparty before assigning revenue to a company. This is particularly relevant when comparing an owned terminal with a chartered vessel, since the cash flows do not arise from the same legal or commercial arrangement.
Netherlands
Eemshaven's proposed extension is a concrete test of the commercial life of Europe's emergency floating import capacity. In June 2026, Gasunie and Vopak took a conditional investment decision after agreeing customer contracts and obtaining a government commitment to a guarantee. The terminal stated that the final decision would follow the necessary permits. By July, most capacity for the 2028 to 2036 period had been contracted.
The Netherlands is forecast to grow at a CAGR of 3.7% in FSRU market value between 2026 and 2036. The FMI outlook increases from USD 127.2 million to USD 182.3 million. The national opportunity therefore includes continuity and reconfiguration of existing marine infrastructure, instead of relying only on entirely new receiving locations.
The planned Eemshaven arrangement pairs the existing regasification unit with a converted carrier. This configuration creates a different procurement decision from replacing two identical ships. Storage and regasification functions are distributed across the terminal's assets, so a comparison based only on the size of one unit would miss the operating design. The commercial case also depends on customers booking capacity for the extension period. Long-term access agreements give the project a revenue basis before the marine arrangement is fully delivered. Permits remain a separate condition. FMI consequently sees the Dutch market as a useful example of how contracted customer demand and regulatory progress must converge before a floating terminal extension becomes an operating asset.
Who are the notable companies in the Floating Storage Regasification Unit (FSRU) Market?
Notable companies in the Floating Storage Regasification Unit (FSRU) Market include Excelerate Energy, Hoegh Evi, BW LNG, Mitsui O.S.K. Lines and Exmar.
The market includes vessel owners, marine operators and companies developing integrated gas import projects. Excelerate Energy combines FSRUs with downstream infrastructure and LNG supply. Hoegh Evi's Egypt contract illustrates the conversion-and-charter route. BW LNG describes gas-grid and gas-to-power solutions, while Mitsui O.S.K. Lines participates through project ownership structures. Those roles differ from EXMAR's smaller regasification barge within a combined terminal.
Company names attached to vessels can persist after an asset changes hands. Golar LNG's 2025 disclosures identify ongoing FSRU services within a business increasingly centred on floating liquefaction. Its role should not be confused with ownership of every ship carrying a former Golar name. Dynagas describes LNG carrier management and terminal compatibility work, making it relevant to the wider marine supply chain. New Fortress Energy's disclosures separate owned, operated and leased assets and identify vessels held through Energos. Competitive comparisons therefore need a contract-specific view. Vessel ownership, terminal development and operating support each create revenue, but they do not represent the same activity or an independently established company market share.
Key Developments in the Floating Storage Regasification Unit (FSRU) Market
- August 2026: Excelerate Energy agreed with Petrobras to extend Sequoia's contract through 2038. A reliquefaction installation is planned for the vessel's 2028 dry dock.
Key Players in the Floating Storage Regasification Unit (FSRU) Market
- Excelerate Energy
- Hoegh Evi
- BW LNG
- Mitsui O.S.K. Lines
- Exmar
- Golar LNG
- Dynagas
- New Fortress Energy
Floating Storage Regasification Unit (FSRU) Market Report Scope
Table 6: Floating Storage Regasification Unit (FSRU) Market Report Scope
| Coverage field | Report scope |
|---|---|
| Market definition | Floating units that receive, store and regasify LNG offshore or nearshore |
| Commercial coverage | Operating fleet under charter, new conversions and newbuilds |
| Quantitative Units | USD million |
| Fleet volume | Units on an annualized fleet activity basis |
| Storage capacity measure | Cubic metres of LNG aboard the unit |
| Segmentation | Type, capacity and charter |
| Countries | Brazil, Egypt, Turkiye, Germany, Pakistan, Bangladesh, Italy, Netherlands, Indonesia and Argentina |
| Other geography | Rest of world aggregate |
| Scope boundaries | LNG cargo value, power station revenue, land-based terminals and storage-only FSUs are separate from FSRU market value |
Source: Future Market Insights analysis of the floating storage regasification unit (FSRU) market, 2026.
Floating Storage Regasification Unit (FSRU) Market Research Methodology
The FSRU assessment combines FMI's numerical market outlook with a secondary review of original marine infrastructure, terminal and regulatory publications. The review distinguishes fleet units from LNG throughput and storage from regasification. Company analysis follows the documented ownership or service role, while development evidence retains its announced, conditional or operating status. Market values, segment shares, country forecasts and arithmetic consistency were reviewed across the assessment period.
Floating Storage Regasification Unit (FSRU) Market by Segments
Floating Storage Regasification Unit (FSRU) Market segmented by Type:
- Converted LNG carrier FSRU
- Newbuild FSRU
- Other floating regasification
Floating Storage Regasification Unit (FSRU) Market segmented by Capacity:
- Below 150,000 cubic metres
- 150,000 to 170,000 cubic metres
- Above 170,000 cubic metres
Floating Storage Regasification Unit (FSRU) Market segmented by Charter:
- Long-term charter (over 10 years)
- Medium-term charter
- Short-term and spot charter
Floating Storage Regasification Unit (FSRU) Market by Region
- Latin America
- Brazil
- Argentina
- Europe
- Germany
- Italy
- Netherlands
- Middle East and North Africa
- Egypt
- Turkiye
- South Asia
- Pakistan
- Bangladesh
- Southeast Asia
- Indonesia
- Other geographic coverage
- Rest of world aggregate
Research Sources and Bibliography
- Argentina Secretariat of Energy. (2026, February 6). Resolution 33/2026: National and International Public Tender for LNG Import and Escobar Access.
- BW Group. (Accessed 2026, November 9). BW LNG Gas Solutions.
- Deutsche Energy Terminal. (Accessed 2026, November 9). Wilhelmshaven 2: Terminal, Vessel and Operational Responsibilities.
- Dynagas. (Accessed 2026, November 9). Fleet and Objective.
- EemsEnergyTerminal. (2025, October 22). Partners with EXMAR for Terminal Extension. https://www.eemsenergyterminal.com/latest-news/eemsenergyterminal-partners-with-exmar-for-terminal-extension
- EemsEnergyTerminal. (2026, June 1). Takes Conditional Investment Decision on Extension. https://www.eemsenergyterminal.com/latest-news/eemsenergyterminal-takes-conditional-investment-decision-on-extension
- EemsEnergyTerminal. (2026, July 9). Capacity Booked for Extension of EemsEnergyTerminal. https://www.eemsenergyterminal.com/latest-news/capacity-booked-for-extension-of-eemsenergyterminal
- Excelerate Energy. (2024, January 29). Signs 15-Year LNG Supply Deal with QatarEnergy. https://excelerateenergy.com/news/excelerate-energy-signs-15-year-lng-supply-deal-with-qatarenergy/
- Excelerate Energy. (2025, April). Investor Presentation: FSRU Contract Overview. https://s29.q4cdn.com/254994371/files/doc_presentations/2025/Apr/01/April-Investor-Presentation.pdf
- Excelerate Energy. (2025, August 11). Reports Strong Second Quarter 2025 Results and Raises Full-Year Guidance. https://excelerateenergy.com/news/excelerate-energy-reports-strong-second-quarter-2025-results-and-raises-full-year-guidance/
- Excelerate Energy. (2026, November). Reports Strong Third Quarter 2026 Results. https://excelerateenergy.com/news/excelerate-energy-reports-strong-third-quarter-2026-results/
- EXMAR. (2026). Annual Report 2025, Section 2.2.2: Floating Regasification and Storage. https://exmarannualreport.clients.dms.be/sites/all/themes/exmar_yearreport/flipbooks/en/40/
- Golar LNG. (2026). Annual Report Form 20-F for the Year Ended December 31, 2025: Corporate and Other Activities. https://www.golarlng.com/~/media/Files/G/Golar-Lng/documents/annual-reports/2025-annual-report-form-20-f-golar-lng.pdf
- Hoegh Evi. (2025, May 12). Signs FSRU Charter with EGAS, Supporting Egypt's Role as Energy Hub in the Middle East. https://hoeghevi.com/hoegh-evi-signs-fsru-charter-with-egas-supporting-egypts-role-as-energy-hub-in-the-middle-east/
- International Maritime Organization. (Accessed 2026, November 9). International Code for the Construction and Equipment of Ships Carrying Liquefied Gases in Bulk. https://www.imo.org/en/ourwork/environment/pages/igccode.aspx
- Mitsui O.S.K. Lines. (2024, April 5). Starts Commercial Operation of FSRU for Indonesia's Jawa 1 LNG-Fired Power Plant. https://www.mol.co.jp/en/pr/2024/24049.html
- New Fortress Energy. (2026). Form 10-K for the Year Ended December 31, 2025: LNG Facilities and Shipping. US Securities and Exchange Commission. https://www.sec.gov/Archives/edgar/data/1749723/000174972326000032/nfe-20251231.htm
- Republic of Türkiye Ministry of Energy and Natural Resources. (2025, December 17). Gazlaştırma Kapasitemizi 200 Milyon Metreküpün Üzerine Çıkaracağız. https://enerji.gov.tr/haber-detay?id=31678
- Royal Vopak. (Accessed 2026, November 9). Engro Elengy Terminal Pakistan LNG. https://www.vopak.com/terminals/engro-elengy-terminal-pakistan-lng?language_content_entity=en
- Snam. (2025). Half-Year Financial Report 2025: Main Events and LNG Regasification. https://www.snam.it/content/dam/snam/pages-attachments-search/en/documenti/relazioni/2025/SNAM_2025_Half_Year_Financial_Report.pdf
Table of Content
- Key Takeaways
- Market Size and CAGR
- Top Growth Driver
- Fastest Growing Segment
- Leading Region
- Key Companies
- Emerging Opportunities
- Executive Summary
- Global Market Outlook
- Demand-side Trends
- Supply-side Trends
- Technology Roadmap Analysis
- Analysis and Recommendations
- Analyst Perspective (What is happening? Why now? What should investors know?)
- Key Questions Answered
- How large is the market?
- What is the CAGR?
- What are key trends?
- Which region dominates?
- Who are the leaders?
Read More...
- Market Overview
- Market Coverage / Taxonomy
- Market Definition / Scope / Limitations
- Research Methodology
- Chapter Orientation
- Analytical Lens and Working Hypotheses
- Market Structure, Signals, and Trend Drivers
- Benchmarking and Cross-market Comparability
- Market Sizing, Forecasting, and Opportunity Mapping
- Research Design and Evidence Framework
- Desk Research Programme (Secondary Evidence)
- Expert Input and Fieldwork (Primary Evidence)
- Tooling, Models, and Reference Databases
- Data Engineering and Model Build
- Quality Assurance and Audit Trail
- Market Background
- Market Dynamics (Drivers, Restraints, Opportunity, Trends)
- Scenario Forecast (Optimistic, Likely, Conservative)
- Impact Analysis
- AI Impact
- Sustainability Impact
- Regulatory Impact
- Technology Impact
- Consumer / Buyer Analysis
- Purchase Drivers
- Adoption Barriers
- Buyer Journey
- Opportunity Map Analysis
- Product Life Cycle Analysis
- Supply Chain Analysis
- Investment Feasibility Matrix
- Value Chain Analysis
- PESTLE and Porter's Analysis
- Regulatory Landscape
- Regional Parent Market Outlook
- Production and Consumption Statistics
- Import and Export Statistics
- Global Market Analysis and Forecast, 2021 to 2036
- Historical Market Size Value (USD Million) Analysis, 2021 to 2025
- Current and Future Market Size Value (USD Million) Projections, 2026 to 2036
- Y-o-Y Growth Trend Analysis
- Absolute $ Opportunity Analysis
- Global Market Pricing Analysis, 2021 to 2036
- Global Market Analysis and Forecast, By Type, 2021 to 2036
- Introduction / Key Findings
- Historical Market Size Value (USD Million) Analysis By Type, 2021 to 2025
- Current and Future Market Size Value (USD Million) Analysis and Forecast By Type, 2026 to 2036
- Converted LNG carrier FSRU
- Newbuild FSRU
- Other floating regasification
- Y-o-Y Growth Trend Analysis By Type, 2021 to 2025
- Absolute $ Opportunity Analysis By Type, 2026 to 2036
- Global Market Analysis and Forecast, By Capacity, 2021 to 2036
- Introduction / Key Findings
- Historical Market Size Value (USD Million) Analysis By Capacity, 2021 to 2025
- Current and Future Market Size Value (USD Million) Analysis and Forecast By Capacity, 2026 to 2036
- Below 150,000 cubic metres
- 150,000 to 170,000 cubic metres
- Above 170,000 cubic metres
- Y-o-Y Growth Trend Analysis By Capacity, 2021 to 2025
- Absolute $ Opportunity Analysis By Capacity, 2026 to 2036
- Global Market Analysis and Forecast, By Charter, 2021 to 2036
- Introduction / Key Findings
- Historical Market Size Value (USD Million) Analysis By Charter, 2021 to 2025
- Current and Future Market Size Value (USD Million) Analysis and Forecast By Charter, 2026 to 2036
- Long-term charter (over 10 years)
- Medium-term charter
- Short-term and spot charter
- Y-o-Y Growth Trend Analysis By Charter, 2021 to 2025
- Absolute $ Opportunity Analysis By Charter, 2026 to 2036
- Global Market Analysis and Forecast, By Region, 2021 to 2036
- Introduction
- Historical Market Size Value (USD Million) Analysis By Region, 2021 to 2025
- Current Market Size Value (USD Million) Analysis and Forecast By Region, 2026 to 2036
- Latin America
- Europe
- South Asia
- Market Attractiveness Analysis By Region
- Latin America Market Analysis and Forecast, By Country
- Historical Market Size Value (USD Million) Trend Analysis By Market Taxonomy, 2021 to 2025
- Market Size Value (USD Million) Forecast By Market Taxonomy, 2026 to 2036
- By Country
- Brazil
- Argentina
- By Type
- By Capacity
- By Charter
- By Country
- Market Attractiveness Analysis
- By Country
- By Type
- By Capacity
- By Charter
- Key Takeaways
- Europe Market Analysis and Forecast, By Country
- Historical Market Size Value (USD Million) Trend Analysis By Market Taxonomy, 2021 to 2025
- Market Size Value (USD Million) Forecast By Market Taxonomy, 2026 to 2036
- By Country
- Germany
- Italy
- Netherlands
- Middle East and North Africa
- Egypt
- Turkiye
- By Type
- By Capacity
- By Charter
- By Country
- Market Attractiveness Analysis
- By Country
- By Type
- By Capacity
- By Charter
- Key Takeaways
- South Asia Market Analysis and Forecast, By Country
- Historical Market Size Value (USD Million) Trend Analysis By Market Taxonomy, 2021 to 2025
- Market Size Value (USD Million) Forecast By Market Taxonomy, 2026 to 2036
- By Country
- Pakistan
- Bangladesh
- Southeast Asia
- Indonesia
- Other geographic coverage
- Rest of world aggregate
- By Type
- By Capacity
- By Charter
- By Country
- Market Attractiveness Analysis
- By Country
- By Type
- By Capacity
- By Charter
- Key Takeaways
- Key Countries Market Analysis
- Brazil
- Pricing Analysis
- Market Share Analysis, 2025
- By Type
- By Capacity
- By Charter
- Germany
- Pricing Analysis
- Market Share Analysis, 2025
- By Type
- By Capacity
- By Charter
- Italy
- Pricing Analysis
- Market Share Analysis, 2025
- By Type
- By Capacity
- By Charter
- Bangladesh
- Pricing Analysis
- Market Share Analysis, 2025
- By Type
- By Capacity
- By Charter
- Indonesia
- Pricing Analysis
- Market Share Analysis, 2025
- By Type
- By Capacity
- By Charter
- Argentina
- Pricing Analysis
- Market Share Analysis, 2025
- By Type
- By Capacity
- By Charter
- Egypt
- Pricing Analysis
- Market Share Analysis, 2025
- By Type
- By Capacity
- By Charter
- Pakistan
- Pricing Analysis
- Market Share Analysis, 2025
- By Type
- By Capacity
- By Charter
- Turkiye
- Pricing Analysis
- Market Share Analysis, 2025
- By Type
- By Capacity
- By Charter
- Netherlands
- Pricing Analysis
- Market Share Analysis, 2025
- By Type
- By Capacity
- By Charter
- Brazil
- Market Structure Analysis
- Competition Dashboard
- Competition Benchmarking
- Market Share Analysis of Top Players
- By Regional
- By Type
- By Capacity
- By Charter
- Emerging Startups
- Innovation Benchmarking
- Competition Analysis
- Competition Deep Dive
- Excelerate Energy
- Overview
- Product Portfolio
- Profitability by Market Segments
- Sales Footprint
- Strategy Overview
- Marketing Strategy
- Product Strategy
- Channel Strategy
- Hoegh Evi
- BW LNG
- Mitsui O.S.K. Lines
- Exmar
- Golar LNG
- Dynagas
- New Fortress Energy
- Excelerate Energy
- Case Studies
- Success Stories
- Recent Developments
- Competition Deep Dive
- Assumptions & Acronyms Used
List of Tables
- Table 1: Global Market Value (USD Million) Forecast by Region, 2021 to 2036
- Table 2: Global Market Value (USD Million) Forecast by Type, 2021 to 2036
- Table 3: Global Market Value (USD Million) Forecast by Capacity, 2021 to 2036
- Table 4: Global Market Value (USD Million) Forecast by Charter, 2021 to 2036
- Table 5: Latin America Market Value (USD Million) Forecast by Country, 2021 to 2036
- Table 6: Latin America Market Value (USD Million) Forecast by Type, 2021 to 2036
- Table 7: Latin America Market Value (USD Million) Forecast by Capacity, 2021 to 2036
- Table 8: Latin America Market Value (USD Million) Forecast by Charter, 2021 to 2036
- Table 9: Europe Market Value (USD Million) Forecast by Country, 2021 to 2036
- Table 10: Europe Market Value (USD Million) Forecast by Type, 2021 to 2036
- Table 11: Europe Market Value (USD Million) Forecast by Capacity, 2021 to 2036
- Table 12: Europe Market Value (USD Million) Forecast by Charter, 2021 to 2036
- Table 13: South Asia Market Value (USD Million) Forecast by Country, 2021 to 2036
- Table 14: South Asia Market Value (USD Million) Forecast by Type, 2021 to 2036
- Table 15: South Asia Market Value (USD Million) Forecast by Capacity, 2021 to 2036
- Table 16: South Asia Market Value (USD Million) Forecast by Charter, 2021 to 2036
List of Figures
- Figure 1: Global Market Pricing Analysis
- Figure 2: Global Market Value (USD Million) Forecast 2021-2036
- Figure 3: Global Market Value Share and BPS Analysis by Type, 2026 and 2036
- Figure 4: Global Market Y-o-Y Growth Comparison by Type, 2026-2036
- Figure 5: Global Market Attractiveness Analysis by Type
- Figure 6: Global Market Value Share and BPS Analysis by Capacity, 2026 and 2036
- Figure 7: Global Market Y-o-Y Growth Comparison by Capacity, 2026-2036
- Figure 8: Global Market Attractiveness Analysis by Capacity
- Figure 9: Global Market Value Share and BPS Analysis by Charter, 2026 and 2036
- Figure 10: Global Market Y-o-Y Growth Comparison by Charter, 2026-2036
- Figure 11: Global Market Attractiveness Analysis by Charter
- Figure 12: Global Market Value (USD Million) Share and BPS Analysis by Region, 2026 and 2036
- Figure 13: Global Market Y-o-Y Growth Comparison by Region, 2026-2036
- Figure 14: Global Market Attractiveness Analysis by Region
- Figure 15: Latin America Market Incremental Dollar Opportunity, 2026-2036
- Figure 16: Europe Market Incremental Dollar Opportunity, 2026-2036
- Figure 17: South Asia Market Incremental Dollar Opportunity, 2026-2036
- Figure 18: Latin America Market Value Share and BPS Analysis by Country, 2026 and 2036
- Figure 19: Latin America Market Value Share and BPS Analysis by Type, 2026 and 2036
- Figure 20: Latin America Market Y-o-Y Growth Comparison by Type, 2026-2036
- Figure 21: Latin America Market Attractiveness Analysis by Type
- Figure 22: Latin America Market Value Share and BPS Analysis by Capacity, 2026 and 2036
- Figure 23: Latin America Market Y-o-Y Growth Comparison by Capacity, 2026-2036
- Figure 24: Latin America Market Attractiveness Analysis by Capacity
- Figure 25: Latin America Market Value Share and BPS Analysis by Charter, 2026 and 2036
- Figure 26: Latin America Market Y-o-Y Growth Comparison by Charter, 2026-2036
- Figure 27: Latin America Market Attractiveness Analysis by Charter
- Figure 28: Europe Market Value Share and BPS Analysis by Country, 2026 and 2036
- Figure 29: Europe Market Value Share and BPS Analysis by Type, 2026 and 2036
- Figure 30: Europe Market Y-o-Y Growth Comparison by Type, 2026-2036
- Figure 31: Europe Market Attractiveness Analysis by Type
- Figure 32: Europe Market Value Share and BPS Analysis by Capacity, 2026 and 2036
- Figure 33: Europe Market Y-o-Y Growth Comparison by Capacity, 2026-2036
- Figure 34: Europe Market Attractiveness Analysis by Capacity
- Figure 35: Europe Market Value Share and BPS Analysis by Charter, 2026 and 2036
- Figure 36: Europe Market Y-o-Y Growth Comparison by Charter, 2026-2036
- Figure 37: Europe Market Attractiveness Analysis by Charter
- Figure 38: South Asia Market Value Share and BPS Analysis by Country, 2026 and 2036
- Figure 39: South Asia Market Value Share and BPS Analysis by Type, 2026 and 2036
- Figure 40: South Asia Market Y-o-Y Growth Comparison by Type, 2026-2036
- Figure 41: South Asia Market Attractiveness Analysis by Type
- Figure 42: South Asia Market Value Share and BPS Analysis by Capacity, 2026 and 2036
- Figure 43: South Asia Market Y-o-Y Growth Comparison by Capacity, 2026-2036
- Figure 44: South Asia Market Attractiveness Analysis by Capacity
- Figure 45: South Asia Market Value Share and BPS Analysis by Charter, 2026 and 2036
- Figure 46: South Asia Market Y-o-Y Growth Comparison by Charter, 2026-2036
- Figure 47: South Asia Market Attractiveness Analysis by Charter
- Figure 48: Global Market - Tier Structure Analysis
- Figure 49: Global Market - Company Share Analysis
Frequently Asked Questions
How big is the floating storage regasification unit (FSRU) market in 2026?
FMI estimates the market at USD 2,120.0 million in 2026, up from USD 2,000.0 million in 2025. It is forecast to reach USD 3,453.3 million by 2036 at a 5.0% CAGR.
Which type leads the floating storage regasification unit (FSRU) market in 2026?
Converted LNG carrier FSRU leads by type with 45.0% in 2026. All other segments together hold 55.0%.
Which capacity and charter lead in 2026?
150,000 to 170,000 cubic metres holds 40.0% by capacity and Long-term charter (over 10 years) holds 50.0% by charter in FMI's 2026 assessment.
Which market is forecast to grow fastest through 2036?
Bangladesh, Indonesia and Argentina tie for the highest forecast CAGR at 6.2% during 2026 to 2036, followed by Brazil, Egypt and Pakistan at 5.2%.
Which countries have the fastest forecast growth?
Bangladesh, Indonesia and Argentina each have a 6.2% forecast CAGR from 2026 to 2036. Brazil is the largest named country market by 2026 revenue at USD 296.8 million.
Preview the report firsthand - request a free sample
Get SampleGet the brochure for pricing and purchase details.
Get PDF
