Forged and Casting Component Market Outlook (2023 to 2033)

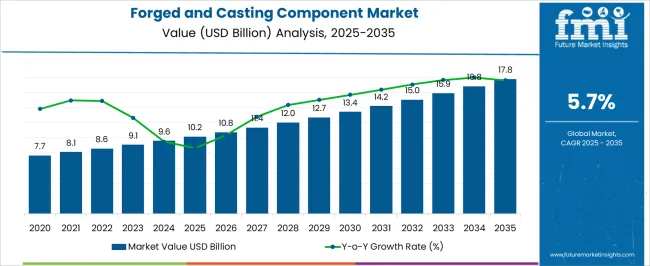
The global forged and casting component market recorded sales of US$ 9,081.3 million in 2022. The market registered a 5.3% year-on-year growth in 2022 and is projected to attain a valuation of US$ 9,591.6 million in 2023.

Over the forecast period, the global market is projected to expand at a compound annual growth rate (CAGR) of 6.0%. By 2033, global forged and casting component sales revenue is set to reach US$ 17,146.7 million.

Forged and casting components are vital components strategically chosen for their strength, durability, and versatility, making them integral to a wide range of industrial applications. These components are gaining wider popularity across industries like automotive and aerospace.

A forged component refers to a part created through the manufacturing process of forging, where a solid piece of aluminum alloy is subjected to controlled pressure and shaping to achieve the desired form. This process enhances the component's mechanical properties, such as strength and durability, making it suitable for applications within the weight range of up to 6 kilograms.

The casting process produces a casting component wherein molten aluminum alloy is poured into a mold to solidify and take the desired shape. This method allows for intricate designs and components within the weight range of up to 6 kilograms.

Casting components maintain structural integrity and exhibit various properties based on alloy composition and casting techniques. As a result, they are witnessing wider popularity across industries.

With industries like automotive and aerospace seeking fuel efficiency, demand for forged and casting components is expected to rise significantly. These components allow lightweight vehicles, aircraft, and other equipment production.

The ongoing global shift towards electrification and sustainable mobility is a transformative trend that profoundly impacts multiple industries, including those involved in forged and casting components. This is expected to create opportunities for forged and casting component manufacturers.

Leading companies focus on developing more complex and lightweight components using novel materials and processes. This will bode well for the global forged and casting components market.

Attribute Key Insights
Estimated Forged and Casting Component Market Size (2023E) US$ 9,591.6 million
Projected Forged and Casting Component Market Value (2033E) US$ 17,146.7 million
Expected Forged and Casting Components Market CAGR (2023 to 2033) 6.0%

Don't pay for what you don't need

Customize your report by selecting specific countries or regions and save 30%!

Historical Performance Vs Forged and Casting Component Market Forecast

From 2018 to 2022, the global forged and casting component market experienced a CAGR of 4.8%. It attained a total valuation of about reaching a market size of US$ 9,081.3 million at the end of 2022.

Attribute Details
Historical CAGR (2018 to 2022) 4.8%
Forecast CAGR (2023 to 2033) 6.0%

From 2018 to 2022, forged and casting component sales experienced steady growth. This growth can be attributed to several factors, including increased industrial production, infrastructure development, and the adoption of advanced manufacturing techniques.

Future Forecast for Forged and Casting Component Industry

The global forged and casting component industry is expected to rise at a CAGR of 6.0% during the forecast period. By 2033, the market size is predicted to reach US$ 17,146.7 million.

This anticipated growth rate signifies a promising future for manufacturers and suppliers of forged and casting components. Growing aftermarket demand, increased infrastructure projects, and advancements in material technology are few of the key factors expected to boost the market.

Robust expansion of industries such as military & defense, automotive, and others will likely create a high demand for forged and casting components. These precision components are crucial for producing advanced weaponry, high-performance electronics, and other machinery and equipment.

Nikhil Kaitwade
Nikhil Kaitwade

Principal Consultant

Talk to Analyst

Find your sweet spots for generating winning opportunities in this market.

Forged and Casting Component Market Growth Drivers

Advancements in Forging and Casting Technologies to Boost the Market

The manufacturing landscape is undergoing a revolutionary transformation propelled by advancements in forging and casting technologies. Innovations in materials science, automation, and simulation are emerging as pivotal drivers within this dynamic environment.

The new cutting-edge developments are redefining the manufacturing process and augmenting the quality, precision, and design intricacies of component production. They are improving machines' and equipment's quality, performance, and lifespan.

The integration of novel materials and the infusion of automation synergistically enhance efficiency. It also ensures a higher degree of precision and facilitates the creation of intricate, high-performance parts.

Adopting novel materials and automation is particularly significant as it empowers industries to cater to diverse demands while minimizing waste and energy consumption. It helps them to align with the growing emphasis on sustainable practices.

The convergence of these technological leaps is reshaping the manufacturing landscape, underscoring a new era of possibilities and capabilities in forging and casting components. This is expected to provide impetus for market growth.

Rapid Urbanization to Uplift Forged and Component Market Demand

Rapid urbanization is becoming a significant catalyst for the burgeoning demand within the forged and casting components market. The expansion of cities on a global scale is instigating an exponential surge in requirements for robust and dependable components, particularly in the realm of infrastructure projects.

Forged and casting components play a pivotal role in construction machinery, transportation systems, and energy facilities that constitute the backbone of urban development. With the burgeoning urban landscape comes an amplified need for durability and reliability, driving the demand for high-quality forged and casting components.

As urban hubs evolve, forged and casting components are critical to ensuring diverse urban infrastructure elements' enduring performance, longevity, and efficiency. This symbiotic relationship between urbanization and component demand is steering sustained market growth and reshaping the forged and casting landscape in response to the evolving needs of modern urban environments.

Forged and Casting Components Market Constraints

The forged and casting components market faces restraint due to disruptions in global supply chains. Factors such as material shortages, transportation challenges, and geopolitical uncertainties can lead to delays in production and affect the timely delivery of components.

Supply chain disruptions can increase lead times, production bottlenecks, and manufacturer costs. Industries reliant on forged and cast components, including automotive, aerospace, and manufacturing, may experience reduced operational efficiency and potential project delays.

To mitigate supply chain restraint, companies must diversify suppliers, enhance visibility in supply chains, and invest in resilient sourcing strategies. By taking these steps, they might overcome this challenge.

Forged and casting components also face competition from alternative materials like composites and advanced plastics. These materials offer advantages such as lighter weight, corrosion resistance, and design flexibility.

Industries seeking lightweight solutions, such as automotive and aerospace, are exploring alternatives to traditional forged and cast components to enhance fuel efficiency and performance. As a result, the market for forged and casting components faces the challenge of demonstrating their ongoing relevance and competitiveness in the face of innovative materials.

Manufacturers must innovate by optimizing designs, exploring hybrid materials, and collaborating with end-users to meet evolving demands. They can also invest in research and development to explore new materials and processes.

Forged and Casting Components Market Trends

Where industries are increasingly setting high benchmarks for efficiency, precision, and durability in their electronic and automation solutions, the role of forged and casting components is taking center stage. These components, crafted meticulously to meet stringent demands, are emerging as the bedrock of excellence in this dynamic landscape. It's not just about the parts; it's about a new paradigm of performance enhancement.

From robust heat management solutions to intricately designed housing structures that safeguard delicate electronics, aluminum alloy forged and casting components are indispensable in enabling seamless operations. Their ability to withstand the rigors of demanding applications translates into uninterrupted functionality, minimized downtime, and prolonged equipment lifespans.

As technology and innovation converge, the forged and casting market reshapes the fabric of high-performance electronics and automation. Forged and casing components allow industries to develop lightweight, complex, high-performance products, machinery, and equipment.

The ascent of digital twin technology is reshaping the forged and casting components landscape. This emerging trend involves the creation of virtual duplicates of tangible components, a breakthrough gaining momentum.

Manufacturers harness this innovation to model and fine-tune component performance across diverse scenarios before actual production, marking a transformative departure from traditional prototyping.

By leveraging simulation-driven design, accuracy and quality are heightened, yielding components tailored to exacting specifications without exhaustive physical trials. This curtails prototyping costs and time and streamlines the design-to-manufacturing trajectory.

With digital twins at the helm, the forged and casting components market embraces a new era of precision, efficiency, and ingenuity, epitomizing the fusion of digital prowess with physical excellence. As a result, a positive growth trajectory has been predicted for the target market.

Country-wise Insights

The table below highlights key countries’ market value. China, the United States, and Japan are the three key markets for forged and casting components, with projected valuations of US$ 4,002.7 million, US$ 2,264.0 million, and US$ 491.6 million, respectively, in 2033.

Countries Market Value (2033)
United States US$ 2,264.0 million
United Kingdom US$ 287.3 million
China US$ 4,002.7 million
Japan US$ 491.6 million
South Korea US$ 271.7 million

Below table shows the expected forged and casting components market growth rates of top five countries. China, Korea, and the United States are set to experience higher CAGRs of 6.3%, 5.9%, and 5.7%, respectively, through 2033.

Countries Projected Forged and Casting Components Market CAGR (2023 to 2033)
United States 5.7%
United Kingdom 4.6%
China 6.3%
Japan 4.9%
South Korea 5.9%

Robust Expansion of Manufacturing Industry Driving Demand in the United States

The United States forged and casting component market size is expected to reach US$ 2,264.0 million by 2033. Over the assessment period, demand for forged and cast components in the United States will likely rise at 5.7% CAGR.

Several factors are expected to drive forged and casting components demand in the United States. One of the key drivers fueling demand is the nation's thriving manufacturing sector.

The manufacturing sector relies heavily on forged and casting components. These components are crucial in ensuring the performance and safety of machinery and structures.

Increased investments in infrastructure development and a growing emphasis on renewable energy projects are expected to create substantial opportunities for forged and casting component manufacturers. These components are essential in the construction of infrastructure projects and the production of renewable energy equipment.

Growing popularity of electric vehicles is expected to improve the United States forged and casting components market share. As the demand for electric vehicles continues to increase, demand for forged and casting components is also expected to rise.

Rising Demand for High-performance Electronics Fueling Sales in Germany

As per the latest analysis, Germany forged and casting component industry is expected to attain a valuation of US$ 597.8 million by 2033. Sales of forged and casting components in the country are predicted to soar at a CAGR of 4.9% during the forecast period.

High-performance electronics and automation systems require precision-engineered components to meet stringent quality and performance standards. As a result, companies use forged and casting components. These components play a critical role in ensuring the reliability and efficiency of these systems.

Germany is known for its advanced manufacturing capabilities and engineering expertise, making it a hub for automotive, aerospace, and machinery industries. These industries heavily rely on forged and casting components for their machinery and equipment.

As the demand for high-performance electronics and automation systems continues to rise, so will the need for specialized components. This is expected to bolster forged and casting component sales in Germany.

Rising Demand from Defense Industry to Boost China Market

China forged and casting component industry value is anticipated to reach US$ 4,002.7 million by 2033, moving at a CAGR of 5.9% during the forecast period. It is expected to witness robust growth due to rising demand from the arms & defense sector.

China's increasing investments in defense capabilities and focus on domestic arms manufacturing drive the demand for forged and casting components in this sector. These components are becoming vital for improving equipment performance, safety, and durability.

The arms & defense industry requires precision-engineered components to ensure the reliability and performance of military equipment, including vehicles, aircraft, and weapons systems. Forged and casting components are vital in producing these critical assets, as they offer the strength, durability, and quality required for defense applications.

China's growing geopolitical influence and the need to modernize its armed forces are leading to substantial investments in defense technology and equipment. As a result, the demand for high-quality forged and casting components is expected to surge rapidly, creating a favorable environment for growth in the forged and casting component industry.

Evolving Trends in Automotive Industry Uplifting Demand in Japan

Japan is anticipated to register a CAGR of 4.9% during the assessment period. Total market valuation in the country is predicted to reach US$ 491.6 million by 2033. Rapid expansion of automotive industry coupled with changing trends in this sector is driving demand in Japan.

The Japan automotive industry is witnessing emerging trends such as electrification and lightweight. This, in turn, is expected to create high demand for forged and casting components as they can reduce overall weight of vehicles.

Increasing investments in renewable energy sector is another key factor expected to boost sales of forged and casting components in the country. Renewable energy projects rely on forged and casting components for equipment like turbine blades.

Rapid Industrial Growth Making Korea a Lucrative Market for Manufacturers

South Korea is anticipated to experience a CAGR of 5.9% throughout the forecast period. Overall, the country's forged and casting components sales revenue is set to reach around US$ 271.7 million by 2033.

Several factors are expected to stimulate growth in South Korea market. These include rapid industrial growth, rising demand for fuel-efficient vehicles, and the developing of new & innovative components.

As industrialization continues to penetrate its roots across Korea, demand for forged and casting components is expected to rise robustly. This is because aerospace, construction, and automotive industries need these specialized components for producing machinery, infrastructure, and vehicles.

Get the data you need at a Fraction of the cost

Personalize your report by choosing insights you need
and save 40%!

Category-wise Insights

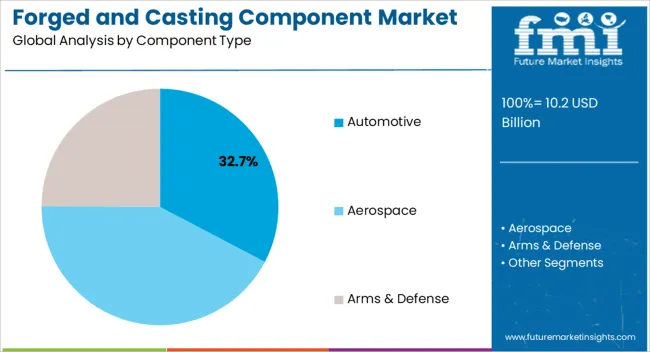
Below section shows the automotive segment dominating the market based on component type. It is predicted to thrive at 5.5% CAGR between 2023 and 2033.

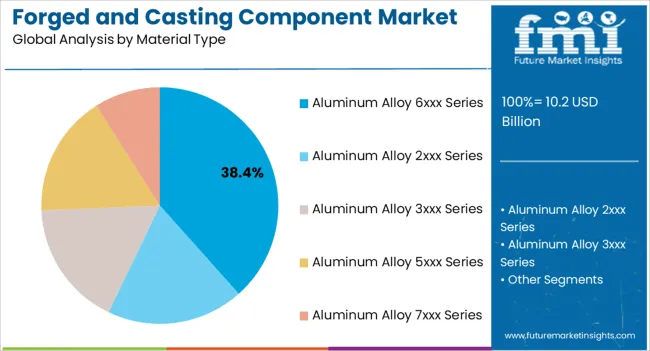
The aluminum alloy 7xxx series segment is set to lead the market based on material type. It will likely progress at a CAGR of 5.2% during the forecast period.

Demand to Remain High for Automotive Forged and Casting Components

Top Segment (Component Type) Automotive
Predicted CAGR (2023 to 2033) 5.5%

The automotive segment is expected to dominate the forged and casting component industry, with a share of around 69.7% in 2023. Over the assessment period, demand for automotive forged and casting components will likely rise at 5.5% CAGR.

Forged and casting components made for automotive segment are critical components that play a pivotal role in ensuring vehicle performance, safety, and reliability. These components are becoming indispensable in the automotive manufacturing sector amid evolving trends.

Multiple factors are driving growth of the target segment. These include continuous advancements in automotive technology, stringent quality standards, and the ever-increasing demand for innovative and durable components in the automotive industry.

Emerging trends like the shift towards electric and autonomous vehicles and lightweight are expected to generate high demand for forged and casting automotive components. This is because these components are generally lighter and stronger than traditional components.

Exceptional Strength-to-Weight Ratio Driving Popularity of Alloy 7xxx Series

Top Segment (Material Type) Lead-acid
Predicted CAGR (2023 to 2033) 5.2%

The aluminum alloy 7xxx series is expected to dominate the forged and casting component industry, holding a share of around 24.3% in 2023. It is poised to exhibit a CAGR of 5.2% during the assessment period.

Forged and casting components of aluminum alloy 7xxx series are known for their exceptional strength-to-weight ratio and corrosion resistance. This makes them a preferred choice in various critical applications within the forged and casting component industry.

Forged and casting components crafted from aluminum alloy 7xxx series offer superior performance, durability, and reliability. They help meet the stringent demands of aerospace, automotive, and structural engineering industries.

The 7xxx series alloys, containing zinc as the main alloying element and magnesium and copper, offer exceptional toughness. Typical chemical composition includes around 1 to 8% zinc, 0.2 to 2.9% magnesium, 1.2 to 2.4% copper, and small amounts of other elements.

Growing demand for forged and casting components made from aluminum alloy 7xxx series from diverse industries is expected to boost the target segment. Subsequently, the continuous technological advancements in materials engineering, which have led to the development of alloys with improved properties, will bode well for the target segment and the market.
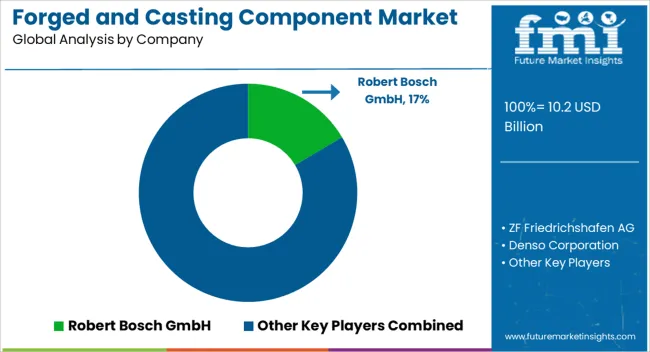
Competitive Landscape

Leading forged and casting component companies focus on developing innovative and technologically advanced solutions to meet evolving end-user demand. They are also adopting acquisitions, alliances, facility expansions, collaborations, mergers, and partnerships to solidify their market positions.

Recent Developments in Forged and Casting Component Market:

  • In February 2022, Schaeffler AG launched two new bearings for electric vehicles. The new TriFinity bearing model is anticipated to make chassis systems more energy efficient.
  • In November 2021, Schaeffler India inaugurated a big bearings refurbishing center in Jamshedpur, significantly expanding the service portfolio of its industrial business. The new dedicated center enables customers to achieve defect-free, sustainable production.
  • In November 2023, Hitachi Ltd. announced its Lumada Alliance Program to get industrial partners in the field of information technology, operational technology, and others.

Scope of Forging and Casting Components Market Report

Attribute Details
Estimated Market Value (2023) US$ 9,591.6 million
Projected Market Size (2033) US$ 17,146.7 million
Anticipated Growth Rate (2023 to 2033) 6.0% CAGR
Historical Data 2018 to 2022
Forecast Period 2023 to 2033
Quantitative Units Revenue in US$ Million, Volume in Units, and CAGR from 2023 to 2033
Segments Covered By Component Type, By Material Type, By Manufacturing Process, By Sales Channel, By Region
Regions Covered North America; Latin America; Western Europe; Eastern Europe; Central Asia; Russia & Belarus; Balkan & Baltics; East Asia; South Asia Pacific; Middle East & Africa
Key Companies Profiled Robert Bosch GmbH; ZF Friedrichshafen AG; Denso Corporation; Continental AG; Thyssenkrupp AG; Magna International; Faurecia; Valeo S.A; Lear Corporation; Eaton Corporation Plc; Delphi Automotive PLC; Schaeffler AG; BorgWarner; Hitachi Astemo, Ltd.; Mahle GmbH; JTEKT CORPORATION; Dana Incorporated; Brembo S.p.A.; Aisin Corporation; Akebono Brake Industry Co., Ltd.

Segmentation Analysis of the Forged and Casting Component Market

By Component Type:

  • Automotive
    • Engine Components
    • Transmission Components
    • Structural Components
    • Suspension Components
    • Exhaust System Components
    • Powertrain Components
    • Interior Components
    • Exterior Components
    • Others
  • Aerospace
    • Safety Critical Structural Parts
    • Non-Safety Critical Parts
  • Arms & Defense
    • Mobility
    • Arms & Gear
  • High-Performance Electronics & Automation
    • Heat Management
    • Electronic-Housings
    • Automation Structural Parts
  • Food & Beverage
    • Structural Components
    • Functional Components

By Material Type:

  • Aluminum Alloy 2xxx Series
  • Aluminum Alloy 3xxx Series
  • Aluminum Alloy 5xxx Series
  • Aluminum Alloy 6xxx Series
  • Aluminum Alloy 7xxx Series

By Manufacturing Process:

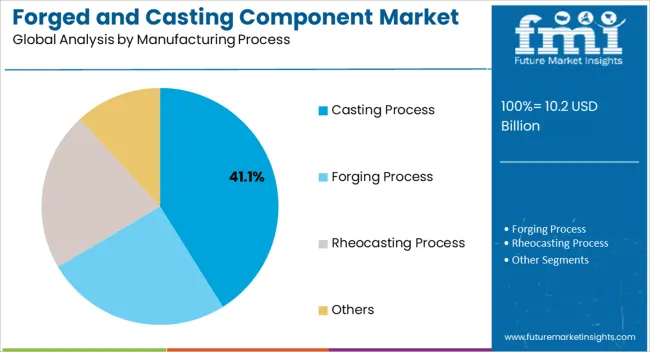
  • Casting Process
    • Sand Casting
    • Die Casting
    • High Pressure Die Casting
    • Others
  • Forging Process
    • Open Die Forging
    • Closed Die Forging
    • Upset Forging
    • Precision Forging
  • Rheocasting Process
  • Others

By Sales Channels:

  • OEM
  • Aftermarket

By Region:

  • North America
  • Latin America
  • Western Europe
  • Eastern Europe
  • East Asia
  • Central Asia
  • Russia & Belarus
  • Balkan & Baltics
  • South Asia Pacific
  • Middle East & Africa

Frequently Asked Questions

How big is the forged and casting component market?

The global market is expected to hit a value of US$ 9,591.6 million by 2023.

How is the demand for forged and casting components increasing?

Global forged and casting component demand is set to expand by 6.0% CAGR through 2033.

What is the predicted valuation of the forged and casting component market by 2033?

The market is predicted to exceed US$ 17,146.7 million by 2033.

What is the size of forged and casting components market in India?

India market size is expected to reach US$ 1,681.5 million by 2033.

What is the key trend in forged and casting components industry?

Product innovations are a key trend in the target market.

Which industry holds the notable market Share in the global market?

Automotive industry is projected to hold a dominant market share of 69.7% in 2023.

Which is the most profitable region for the forged and casting component industry?

East Asia is expected to emerge as the most profitable market.

Table of Content
1. Executive Summary
    1.1. Global Market Outlook
    1.2. Demand Side Trends
    1.3. Supply Side Trends
    1.4. Technology Roadmap
    1.5. Analysis and Recommendations
2. Market Overview
    2.1. Market Coverage / Taxonomy
    2.2. Market Definition / Scope / Limitations
3. Key Market Trends
    3.1. Key Trends Impacting the Market
    3.2. Product Innovation / Development Trends
4. Key Success Factors
    4.1. Product Adoption / Usage Analysis
    4.2. Product USPs / Features
    4.3. Strategic Promotional Strategies
5. Global Forged & Casting Components Market Demand Analysis 2018 to 2022 and Forecast, 2023 to 2033
    5.1. Historical Market Volume (Tons) Analysis, 2018 to 2022
    5.2. Current and Future Market Volume (Tons) Projections, 2023 to 2033
    5.3. Y-o-Y Growth Trend Analysis
6. Global Forged & Casting Components Market - Pricing Analysis
    6.1. Regional Pricing Analysis By Component Type
    6.2. Global Average Pricing Analysis Benchmark
7. Global Forged & Casting Components Market Demand (in Value or Size in US$ Million) Analysis 2018 to 2022 and Forecast, 2023 to 2033
    7.1. Historical Market Value (US$ Million) Analysis, 2018 to 2022
    7.2. Current and Future Market Value (US$ Million) Projections, 2023 to 2033
        7.2.1. Y-o-Y Growth Trend Analysis
        7.2.2. Absolute $ Opportunity Analysis
8. Market Background
    8.1. Macro-Economic Factors
        8.1.1. Global GDP Growth Outlook
        8.1.2. Global Manufacturing Industry Overview
        8.1.3. Manufacturing Value-Added
        8.1.4. Industry Value Added
        8.1.5. Parent Market Outlook
        8.1.6. Other Macro-Economic Factors
    8.2. Forecast Factors - Relevance & Impact
        8.2.1. Top Companies Historical Growth
        8.2.2. GDP Growth Forecast
        8.2.3. Manufacturing Industry Forecast
        8.2.4. Global Urbanization Growth Outlook
        8.2.5. Business Climate
        8.2.6. Covid-19 Impact Assessment
        8.2.7. End-use Industry Growth Outlook
    8.3. Value Chain
        8.3.1. Product Manufacturers
        8.3.2. End Users
        8.3.3. Avg. Profitability Margins
    8.4. COVID-19 Crisis – Impact Assessment
        8.4.1. Current Statistics
        8.4.2. Short-Mid-Long Term Outlook
        8.4.3. Likely Rebound
    8.5. Market Dynamics
        8.5.1. Drivers
        8.5.2. Restraints
        8.5.3. Opportunity Analysis
9. Global Forged & Casting Components Market Analysis 2018 to 2022 and Forecast 2023 to 2033, By Component Type
    9.1. Introduction / Key Findings
    9.2. Historical Market Size (US$ Million) and Volume Analysis By Component Type, 2018 to 2022
    9.3. Current and Future Market Size (US$ Million) and Volume Analysis and Forecast By Component Type, 2023 to 2033
        9.3.1. Automotive
            9.3.1.1. Engine Components
            9.3.1.2. Transmission Components
            9.3.1.3. Structural Components
            9.3.1.4. Suspension Components
            9.3.1.5. Exhaust System
            9.3.1.6. Powertrain Components
            9.3.1.7. Interior Components
            9.3.1.8. Exterior Components
            9.3.1.9. Others
        9.3.2. Aerospace
            9.3.2.1. Safety Critical Structural Parts
            9.3.2.2. Non-Safety Critical Parts
        9.3.3. Arms & Defense
            9.3.3.1. Mobility
            9.3.3.2. Arms & Gear
        9.3.4. High-Performance Electronics & Automation
            9.3.4.1. Heat Management
            9.3.4.2. Electronic-Housings Automation
            9.3.4.3. Structural Parts
        9.3.5. Food & Beverages
            9.3.5.1. Structural Components
            9.3.5.2. Functional Component
    9.4. Market Attractiveness Analysis By Component Type
10. Global Forged & Casting Components Market Analysis 2018 to 2022 and Forecast 2023 to 2033, By Material Type
    10.1. Introduction / Key Findings
    10.2. Historical Market Size (US$ Million) and Volume Analysis By Material Type, 2018 to 2022
    10.3. Current and Future Market Size (US$ Million) and Volume Analysis and Forecast By Material Type, 2023 to 2033
        10.3.1. Aluminum Alloy 2xxx Series
        10.3.2. Aluminum Alloy 3xxx Series
        10.3.3. Aluminum Alloy 5xxx Series
        10.3.4. Aluminum Alloy 6xxx Series
        10.3.5. Aluminum Alloy 7xxx Series
    10.4. Market Attractiveness Analysis By Material Type
11. Global Forged & Casting Components Market Analysis 2018 to 2022 and Forecast 2023 to 2033, By Manufacturing Process
    11.1. Introduction / Key Findings
    11.2. Historical Market Size (US$ Million) and Volume Analysis By Manufacturing Process, 2018 to 2022
    11.3. Current and Future Market Size (US$ Million) and Volume Analysis and Forecast By Manufacturing Process, 2023 to 2033
        11.3.1. Casting Process
            11.3.1.1. Sand Casting
            11.3.1.2. Die Casting
            11.3.1.3. High Pressure Die Casting
            11.3.1.4. Others
        11.3.2. Forging Process
            11.3.2.1. Open Die Forging
            11.3.2.2. Closed Die Forging
            11.3.2.3. Upset Forging
            11.3.2.4. Precision Forging
    11.4. Rheocasting Process
    11.5. Others
    11.6. Market Attractiveness Analysis By Manufacturing Process
12. Global Forged & Casting Components Market Analysis 2018 to 2022 and Forecast 2023 to 2033, By Sales Channel
    12.1. Introduction / Key Findings
    12.2. Historical Market Size (US$ Million) and Volume Analysis By Sales Channel, 2018 to 2022
    12.3. Current and Future Market Size (US$ Million) and Volume Analysis and Forecast By Sales Channel, 2023 to 2033
        12.3.1. OEM
        12.3.2. Aftermarket
    12.4. Market Attractiveness Analysis By Sales Channel
13. Global Forged & Casting Components Market Analysis 2018 to 2022 and Forecast 2023 to 2033, by Region
    13.1. Introduction
    13.2. Historical Market Size (US$ Million) and Volume Analysis By Region, 2018 to 2022
    13.3. Current Market Size (US$ Million) and Volume Analysis and Forecast By Region, 2023 to 2033
        13.3.1. North America
        13.3.2. Latin America
        13.3.3. Western Europe
        13.3.4. Eastern Europe
        13.3.5. Central Asia
        13.3.6. Russia & Belarus
        13.3.7. Balkan & Baltic Countries
        13.3.8. Middle East and Africa (MEA)
        13.3.9. East Asia
        13.3.10. South Asia and Pacific
    13.4. Market Attractiveness Analysis By Region
14. North America Forged & Casting Components Market Analysis 2018 to 2022 and Forecast 2023 to 2033
    14.1. Introduction
    14.2. Pricing Analysis
    14.3. Historical Market Size (US$ Million) and Volume Trend Analysis By Market Taxonomy, 2018 to 2022
    14.4. Market Size (US$ Million) and Volume Forecast By Market Taxonomy, 2023 to 2033
        14.4.1. By Country
            14.4.1.1. USA
            14.4.1.2. Canada
        14.4.2. By Component Type
        14.4.3. By Material Type
        14.4.4. By Manufacturing Process
        14.4.5. By Sales Channel
    14.5. Market Attractiveness Analysis
        14.5.1. By Country
        14.5.2. By Component Type
        14.5.3. By Material Type
        14.5.4. By Manufacturing Process
        14.5.5. By Sales Channel
    14.6. Market Trends
    14.7. Key Market Participants - Intensity Mapping
    14.8. Drivers and Restraints - Impact Analysis
15. Latin America Forged & Casting Components Market Analysis 2018 to 2022 and Forecast 2023 to 2033
    15.1. Introduction
    15.2. Pricing Analysis
    15.3. Historical Market Size (US$ Million) and Volume Trend Analysis By Market Taxonomy, 2018 to 2022
    15.4. Market Size (US$ Million) and Volume Forecast By Market Taxonomy, 2023 to 2033
        15.4.1. By Country
            15.4.1.1. Brazil
            15.4.1.2. Mexico
            15.4.1.3. Argentina
            15.4.1.4. Rest of Latin America
        15.4.2. By Component Type
        15.4.3. By Material Type
        15.4.4. By Manufacturing Process
        15.4.5. By Sales Channel
    15.5. Market Attractiveness Analysis
        15.5.1. By Country
        15.5.2. By Component Type
        15.5.3. By Material Type
        15.5.4. By Manufacturing Process
        15.5.5. By Sales Channel
    15.6. Market Trends
    15.7. Key Market Participants - Intensity Mapping
    15.8. Drivers and Restraints - Impact Analysis
16. Western Europe Forged & Casting Components Market Analysis 2018 to 2022 and Forecast 2023 to 2033
    16.1. Introduction
    16.2. Pricing Analysis
    16.3. Historical Market Size (US$ Million) and Volume Trend Analysis By Market Taxonomy, 2018 to 2022
    16.4. Market Size (US$ Million) and Volume Forecast By Market Taxonomy, 2023 to 2033
        16.4.1. By Country
            16.4.1.1. Germany
            16.4.1.2. Italy
            16.4.1.3. France
            16.4.1.4. UK.
            16.4.1.5. Spain
            16.4.1.6. BENELUX
            16.4.1.7. NORDICS
            16.4.1.8. Rest of Western Europe
        16.4.2. By Component Type
        16.4.3. By Material Type
        16.4.4. By Manufacturing Process
        16.4.5. By Sales Channel
    16.5. Market Attractiveness Analysis
        16.5.1. By Country
        16.5.2. By Component Type
        16.5.3. By Material Type
        16.5.4. By Manufacturing Process
        16.5.5. By Sales Channel
    16.6. Market Trends
    16.7. Key Market Participants - Intensity Mapping
    16.8. Drivers and Restraints - Impact Analysis
17. Eastern Europe Forged & Casting Components Market Analysis 2018 to 2022 and Forecast 2023 to 2033
    17.1. Introduction
    17.2. Pricing Analysis
    17.3. Historical Market Size (US$ Million) and Volume Trend Analysis By Market Taxonomy, 2018 to 2022
    17.4. Market Size (US$ Million) and Volume Forecast By Market Taxonomy, 2023 to 2033
        17.4.1. By Country
            17.4.1.1. Poland
            17.4.1.2. Hungary
            17.4.1.3. Romania
            17.4.1.4. Czech Republic
            17.4.1.5. Rest of Eastern Europe
        17.4.2. By Component Type
        17.4.3. By Material Type
        17.4.4. By Manufacturing Process
        17.4.5. By Sales Channel
    17.5. Market Attractiveness Analysis
        17.5.1. By Country
        17.5.2. By Component Type
        17.5.3. By Material Type
        17.5.4. By Manufacturing Process
        17.5.5. By Sales Channel
    17.6. Market Trends
    17.7. Key Market Participants - Intensity Mapping
    17.8. Drivers and Restraints - Impact Analysis
18. Central Asia Forged & Casting Components Market Analysis 2018 to 2022 and Forecast 2023 to 2033
    18.1. Introduction
    18.2. Pricing Analysis
    18.3. Historical Market Size (US$ Million) and Volume Trend Analysis By Market Taxonomy, 2018 to 2022
    18.4. Market Size (US$ Million) and Volume Forecast By Market Taxonomy, 2023 to 2033
        18.4.1. By Component Type
        18.4.2. By Material Type
        18.4.3. By Manufacturing Process
        18.4.4. By Sales Channel
    18.5. Market Attractiveness Analysis
        18.5.1. By Component Type
        18.5.2. By Material Type
        18.5.3. By Manufacturing Process
        18.5.4. By Sales Channel
    18.6. Market Trends
    18.7. Key Market Participants - Intensity Mapping
    18.8. Drivers and Restraints - Impact Analysis
19. Russia & Belarus Forged & Casting Components Market Analysis 2018 to 2022 and Forecast 2023 to 2033
    19.1. Introduction
    19.2. Pricing Analysis
    19.3. Historical Market Size (US$ Million) and Volume Trend Analysis By Market Taxonomy, 2018 to 2022
    19.4. Market Size (US$ Million) and Volume Forecast By Market Taxonomy, 2023 to 2033
        19.4.1. By Component Type
        19.4.2. By Material Type
        19.4.3. By Manufacturing Process
        19.4.4. By Sales Channel
    19.5. Market Attractiveness Analysis
        19.5.1. By Component Type
        19.5.2. By Material Type
        19.5.3. By Manufacturing Process
        19.5.4. By Sales Channel
    19.6. Market Trends
    19.7. Key Market Participants - Intensity Mapping
    19.8. Drivers and Restraints - Impact Analysis
20. Balkan & Baltic Countries Forged & Casting Components Market Analysis 2018 to 2022 and Forecast 2023 to 2033
    20.1. Introduction
    20.2. Pricing Analysis
    20.3. Historical Market Size (US$ Million) and Volume Trend Analysis By Market Taxonomy, 2018 to 2022
    20.4. Market Size (US$ Million) and Volume Forecast By Market Taxonomy, 2023 to 2033
        20.4.1. By Component Type
        20.4.2. By Material Type
        20.4.3. By Manufacturing Process
        20.4.4. By Sales Channel
    20.5. Market Attractiveness Analysis
        20.5.1. By Component Type
        20.5.2. By Material Type
        20.5.3. By Manufacturing Process
        20.5.4. By Sales Channel
    20.6. Market Trends
    20.7. Key Market Participants - Intensity Mapping
    20.8. Drivers and Restraints - Impact Analysis
21. South Asia and Pacific Forged & Casting Components Market Analysis 2018 to 2022 and Forecast 2023 to 2033
    21.1. Introduction
    21.2. Pricing Analysis
    21.3. Historical Market Size (US$ Million) and Volume Trend Analysis By Market Taxonomy, 2018 to 2022
    21.4. Market Size (US$ Million) and Volume Forecast By Market Taxonomy, 2023 to 2033
        21.4.1. By Country
            21.4.1.1. India
            21.4.1.2. ASEAN
            21.4.1.3. Oceania
            21.4.1.4. Rest of South Asia & Pacific
        21.4.2. By Component Type
        21.4.3. By Material Type
        21.4.4. By Manufacturing Process
        21.4.5. By Sales Channel
    21.5. Market Attractiveness Analysis
        21.5.1. By Country
        21.5.2. By Component Type
        21.5.3. By Material Type
        21.5.4. By Manufacturing Process
        21.5.5. By Sales Channel
    21.6. Market Trends
    21.7. Key Market Participants - Intensity Mapping
    21.8. Drivers and Restraints - Impact Analysis
22. East Asia Forged & Casting Components Market Analysis 2018 to 2022 and Forecast 2023 to 2033
    22.1. Introduction
    22.2. Pricing Analysis
    22.3. Historical Market Size (US$ Million) and Volume Trend Analysis By Market Taxonomy, 2018 to 2022
    22.4. Market Size (US$ Million) and Volume Forecast By Market Taxonomy, 2023 to 2033
        22.4.1. By Country
            22.4.1.1. China
            22.4.1.2. Japan
            22.4.1.3. South Korea
        22.4.2. By Component Type
        22.4.3. By Material Type
        22.4.4. By Manufacturing Process
        22.4.5. By Sales Channel
    22.5. Market Attractiveness Analysis
        22.5.1. By Country
        22.5.2. By Component Type
        22.5.3. By Material Type
        22.5.4. By Manufacturing Process
        22.5.5. By Sales Channel
    22.6. Market Trends
    22.7. Key Market Participants - Intensity Mapping
    22.8. Drivers and Restraints - Impact Analysis
23. Middle East and Africa Forged & Casting Components Market Analysis 2018 to 2022 and Forecast 2023 to 2033
    23.1. Introduction
    23.2. Pricing Analysis
    23.3. Historical Market Size (US$ Million) and Volume Trend Analysis By Market Taxonomy, 2018 to 2022
    23.4. Market Size (US$ Million) and Volume Forecast By Market Taxonomy, 2023 to 2033
        23.4.1. By Country
            23.4.1.1. GCC Countries
            23.4.1.2. Türkiye
            23.4.1.3. Northern Africa
            23.4.1.4. South Africa
            23.4.1.5. Rest of Middle East and Africa
        23.4.2. By Component Type
        23.4.3. By Material Type
        23.4.4. By Manufacturing Process
        23.4.5. By Sales Channel
    23.5. Market Attractiveness Analysis
        23.5.1. By Country
        23.5.2. By Component Type
        23.5.3. By Material Type
        23.5.4. By Manufacturing Process
        23.5.5. By Sales Channel
    23.6. Market Trends
    23.7. Key Market Participants - Intensity Mapping
    23.8. Drivers and Restraints - Impact Analysis
24. Country-wise Forged & Casting Components Market Analysis
    24.1. Introduction
        24.1.1. Market Value Proportion Analysis, By Key Countries
        24.1.2. Global Vs. Country Growth Comparison
    24.2. USA Forged & Casting Components Market Analysis
        24.2.1. By Component Type
        24.2.2. By Material Type
        24.2.3. By Manufacturing Process
        24.2.4. By Sales Channel
    24.3. Canada Forged & Casting Components Market Analysis
        24.3.1. By Component Type
        24.3.2. By Material Type
        24.3.3. By Manufacturing Process
        24.3.4. By Sales Channel
    24.4. Mexico Forged & Casting Components Market Analysis
        24.4.1. By Component Type
        24.4.2. By Material Type
        24.4.3. By Manufacturing Process
        24.4.4. By Sales Channel
    24.5. Brazil Forged & Casting Components Market Analysis
        24.5.1. By Component Type
        24.5.2. By Material Type
        24.5.3. By Manufacturing Process
        24.5.4. By Sales Channel
    24.6. Argentina Forged & Casting Components Market Analysis
        24.6.1. By Component Type
        24.6.2. By Material Type
        24.6.3. By Manufacturing Process
        24.6.4. By Sales Channel
    24.7. Germany Forged & Casting Components Market Analysis
        24.7.1. By Component Type
        24.7.2. By Material Type
        24.7.3. By Manufacturing Process
        24.7.4. By Sales Channel
    24.8. Italy Forged & Casting Components Market Analysis
        24.8.1. By Component Type
        24.8.2. By Material Type
        24.8.3. By Manufacturing Process
        24.8.4. By Sales Channel
    24.9. France Forged & Casting Components Market Analysis
        24.9.1. By Component Type
        24.9.2. By Material Type
        24.9.3. By Manufacturing Process
        24.9.4. By Sales Channel
    24.10. UK. Forged & Casting Components Market Analysis
        24.10.1. By Component Type
        24.10.2. By Material Type
        24.10.3. By Manufacturing Process
        24.10.4. By Sales Channel
    24.11. Spain Forged & Casting Components Market Analysis
        24.11.1. By Component Type
        24.11.2. By Material Type
        24.11.3. By Manufacturing Process
        24.11.4. By Sales Channel
    24.12. NORDICS Forged & Casting Components Market Analysis
        24.12.1. By Component Type
        24.12.2. By Material Type
        24.12.3. By Manufacturing Process
        24.12.4. By Sales Channel
    24.13. Poland Forged & Casting Components Market Analysis
        24.13.1. By Component Type
        24.13.2. By Material Type
        24.13.3. By Manufacturing Process
        24.13.4. By Sales Channel
    24.14. Hungary Forged & Casting Components Market Analysis
        24.14.1. By Component Type
        24.14.2. By Material Type
        24.14.3. By Manufacturing Process
        24.14.4. By Sales Channel
    24.15. Romania Forged & Casting Components Market Analysis
        24.15.1. By Component Type
        24.15.2. By Material Type
        24.15.3. By Manufacturing Process
        24.15.4. By Sales Channel
    24.16. Czech Republic Forged & Casting Components Market Analysis
        24.16.1. By Component Type
        24.16.2. By Material Type
        24.16.3. By Manufacturing Process
        24.16.4. By Sales Channel
    24.17. China Forged & Casting Components Market Analysis
        24.17.1. By Component Type
        24.17.2. By Material Type
        24.17.3. By Manufacturing Process
        24.17.4. By Sales Channel
    24.18. Japan Forged & Casting Components Market Analysis
        24.18.1. By Component Type
        24.18.2. By Material Type
        24.18.3. By Manufacturing Process
        24.18.4. By Sales Channel
    24.19. S. Korea Forged & Casting Components Market Analysis
        24.19.1. By Component Type
        24.19.2. By Material Type
        24.19.3. By Manufacturing Process
        24.19.4. By Sales Channel
    24.20. India Forged & Casting Components Market Analysis
        24.20.1. By Component Type
        24.20.2. By Material Type
        24.20.3. By Manufacturing Process
        24.20.4. By Sales Channel
    24.21. ASEAN Forged & Casting Components Market Analysis
        24.21.1. By Component Type
        24.21.2. By Material Type
        24.21.3. By Manufacturing Process
        24.21.4. By Sales Channel
    24.22. Australia and New Zealand Forged & Casting Components Market Analysis
        24.22.1. By Component Type
        24.22.2. By Material Type
        24.22.3. By Manufacturing Process
        24.22.4. By Sales Channel
    24.23. KSA Forged & Casting Components Market Analysis
        24.23.1. By Component Type
        24.23.2. By Material Type
        24.23.3. By Manufacturing Process
        24.23.4. By Sales Channel
    24.24. UAE Forged & Casting Components Market Analysis
        24.24.1. By Component Type
        24.24.2. By Material Type
        24.24.3. By Manufacturing Process
        24.24.4. By Sales Channel
    24.25. Northern Africa Forged & Casting Components Market Analysis
        24.25.1. By Component Type
        24.25.2. By Material Type
        24.25.3. By Manufacturing Process
        24.25.4. By Sales Channel
    24.26. Turkey Forged & Casting Components Market Analysis
        24.26.1. By Component Type
        24.26.2. By Material Type
        24.26.3. By Manufacturing Process
        24.26.4. By Sales Channel
    24.27. South Africa Forged & Casting Components Market Analysis
        24.27.1. By Component Type
        24.27.2. By Material Type
        24.27.3. By Manufacturing Process
        24.27.4. By Sales Channel
    24.28. Israel Forged & Casting Components Market Analysis
        24.28.1. By Component Type
        24.28.2. By Material Type
        24.28.3. By Manufacturing Process
        24.28.4. By Sales Channel
25. Market Structure Analysis
    25.1. Market Analysis by Tier of Companies (Forged & Casting Components)
    25.2. Market Concentration
    25.3. Market Share Analysis of Top Players
    25.4. Production Capacity Analysis
    25.5. Market Presence Analysis
        25.5.1. By Manufacturing Process Footprint of Players
        25.5.2. By Regional Footprint of Players
        25.5.3. By Channel Footprint of Players
26. Competition Analysis
    26.1. Competition Dashboard
    26.2. Competition Benchmarking
    26.3. Competition Deep Dive
        26.3.1. Robert Bosch GmbH
            26.3.1.1. Overview
            26.3.1.2. Product Portfolio
            26.3.1.3. Profitability by Market Segments (Product/Channel/Region)
            26.3.1.4. Sales Footprint
            26.3.1.5. Strategy Overview
        26.3.2. ZF Friedrichshafen AG
            26.3.2.1. Overview
            26.3.2.2. Product Portfolio
            26.3.2.3. Profitability by Market Segments (Product/Channel/Region)
            26.3.2.4. Sales Footprint
            26.3.2.5. Strategy Overview
        26.3.3. Denso Corporation
            26.3.3.1. Overview
            26.3.3.2. Product Portfolio
            26.3.3.3. Profitability by Market Segments (Product/Channel/Region)
            26.3.3.4. Sales Footprint
            26.3.3.5. Strategy Overview
        26.3.4. Continental AG
            26.3.4.1. Overview
            26.3.4.2. Product Portfolio
            26.3.4.3. Profitability by Market Segments (Product/Channel/Region)
            26.3.4.4. Sales Footprint
            26.3.4.5. Strategy Overview
        26.3.5. Thyssenkrupp AG
            26.3.5.1. Overview
            26.3.5.2. Product Portfolio
            26.3.5.3. Profitability by Market Segments (Product/Channel/Region)
            26.3.5.4. Sales Footprint
            26.3.5.5. Strategy Overview
        26.3.6. Magna International
            26.3.6.1. Overview
            26.3.6.2. Product Portfolio
            26.3.6.3. Profitability by Market Segments (Product/Channel/Region)
            26.3.6.4. Sales Footprint
            26.3.6.5. Strategy Overview
        26.3.7. Faurecia
            26.3.7.1. Overview
            26.3.7.2. Product Portfolio
            26.3.7.3. Profitability by Market Segments (Product/Channel/Region)
            26.3.7.4. Sales Footprint
            26.3.7.5. Strategy Overview
        26.3.8. Valeo S.A
            26.3.8.1. Overview
            26.3.8.2. Product Portfolio
            26.3.8.3. Profitability by Market Segments (Product/Channel/Region)
            26.3.8.4. Sales Footprint
            26.3.8.5. Strategy Overview
        26.3.9. Lear Corporation
            26.3.9.1. Overview
            26.3.9.2. Product Portfolio
            26.3.9.3. Profitability by Market Segments (Product/Channel/Region)
            26.3.9.4. Sales Footprint
            26.3.9.5. Strategy Overview
        26.3.10. Eaton Corporation Plc
            26.3.10.1. Overview
            26.3.10.2. Product Portfolio
            26.3.10.3. Profitability by Market Segments (Product/Channel/Region)
            26.3.10.4. Sales Footprint
            26.3.10.5. Strategy Overview
        26.3.11. Delphi Automotive PLC
            26.3.11.1. Overview
            26.3.11.2. Product Portfolio
            26.3.11.3. Profitability by Market Segments (Product/Channel/Region)
            26.3.11.4. Sales Footprint
            26.3.11.5. Strategy Overview
        26.3.12. Schaeffler AG
            26.3.12.1. Overview
            26.3.12.2. Product Portfolio
            26.3.12.3. Profitability by Market Segments (Product/Channel/Region)
            26.3.12.4. Sales Footprint
            26.3.12.5. Strategy Overview
        26.3.13. BorgWarner
            26.3.13.1. Overview
            26.3.13.2. Product Portfolio
            26.3.13.3. Profitability by Market Segments (Product/Channel/Region)
            26.3.13.4. Sales Footprint
            26.3.13.5. Strategy Overview
        26.3.14. Hitachi Astemo, Ltd.
            26.3.14.1. Overview
            26.3.14.2. Product Portfolio
            26.3.14.3. Profitability by Market Segments (Product/Channel/Region)
            26.3.14.4. Sales Footprint
            26.3.14.5. Strategy Overview
        26.3.15. Mahle GmbH
            26.3.15.1. Overview
            26.3.15.2. Product Portfolio
            26.3.15.3. Profitability by Market Segments (Product/Channel/Region)
            26.3.15.4. Sales Footprint
            26.3.15.5. Strategy Overview
        26.3.16. JTEKT CORPORATION
            26.3.16.1. Overview
            26.3.16.2. Product Portfolio
            26.3.16.3. Profitability by Market Segments (Product/Channel/Region)
            26.3.16.4. Sales Footprint
            26.3.16.5. Strategy Overview
        26.3.17. Dana Incorporated
            26.3.17.1. Overview
            26.3.17.2. Product Portfolio
            26.3.17.3. Profitability by Market Segments (Product/Channel/Region)
            26.3.17.4. Sales Footprint
            26.3.17.5. Strategy Overview
        26.3.18. Brembo S.p.A.
            26.3.18.1. Overview
            26.3.18.2. Product Portfolio
            26.3.18.3. Profitability by Market Segments (Product/Channel/Region)
            26.3.18.4. Sales Footprint
            26.3.18.5. Strategy Overview
        26.3.19. Aisin Corporation
            26.3.19.1. Overview
            26.3.19.2. Product Portfolio
            26.3.19.3. Profitability by Market Segments (Product/Channel/Region)
            26.3.19.4. Sales Footprint
            26.3.19.5. Strategy Overview
        26.3.20. Akebono Brake Industry Co., Ltd.
            26.3.20.1. Overview
            26.3.20.2. Product Portfolio
            26.3.20.3. Profitability by Market Segments (Product/Channel/Region)
            26.3.20.4. Sales Footprint
            26.3.20.5. Strategy Overview
27. Primary Insights
28. Assumptions and Acronyms Used
29. Research Methodology
Recommendations

Industrial Automation

North America Iron Casting Market

August 2023

REP-GB-17874

300 pages

Industrial Automation

Hot Chamber Die Casting Machine Market

August 2023

REP-GB-5088

333 pages

Industrial Automation

Metal Stampings, Forgings, and Castings Market

May 2023

REP-GB-17258

306 pages

Chemicals & Materials

Hot Melt Adhesives Market

October 2022

REP-GB-1184

198 pages

Explore Industrial Automation Insights

View Reports
Future Market Insights

Forged and Casting Component Market

Schedule a Call