The fusing machine market is experiencing steady expansion supported by rising demand across garment, textile, and apparel production industries. Growth has been influenced by the increasing emphasis on automation, energy efficiency, and consistent quality in manufacturing processes. Continuous advancements in machine technology have enhanced precision, speed, and fabric compatibility, enabling manufacturers to meet large-scale production requirements.
The shift towards sustainable and durable textile bonding solutions has further elevated the role of fusing machines in modern production lines. Global apparel brands are investing heavily in advanced machinery to maintain uniformity and reduce labor-intensive operations, boosting the market outlook. Moreover, the increasing adoption of fully automated systems is reducing error rates, enhancing productivity, and cutting operational costs, thereby expanding the market’s acceptance.
With rapid industrialization in emerging economies and greater penetration of modern textile technologies, the fusing machine market is positioned for sustainable growth Rising demand from garment exports and fast fashion trends is also expected to accelerate adoption, ensuring long-term market potential.
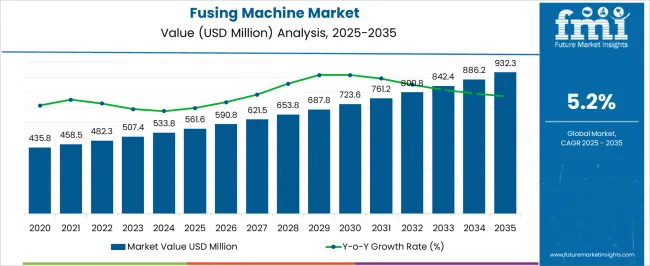
| Metric | Value |
|---|---|
| Fusing Machine Market Estimated Value in (2025 E) | USD 561.6 million |
| Fusing Machine Market Forecast Value in (2035 F) | USD 932.3 million |
| Forecast CAGR (2025 to 2035) | 5.2% |
The market is segmented by Type, Automation Level, and Application and region. By Type, the market is divided into Continuous Press, Flatbed, and Rotary. In terms of Automation Level, the market is classified into Fully Automatic, Semi-Automatic, and Manual. Based on Application, the market is segmented into Garment Manufacturing, Automotive Upholstery, Home Textiles, and Other. Regionally, the market is classified into North America, Latin America, Western Europe, Eastern Europe, Balkan & Baltic Countries, Russia & Belarus, Central Asia, East Asia, South Asia & Pacific, and the Middle East & Africa.
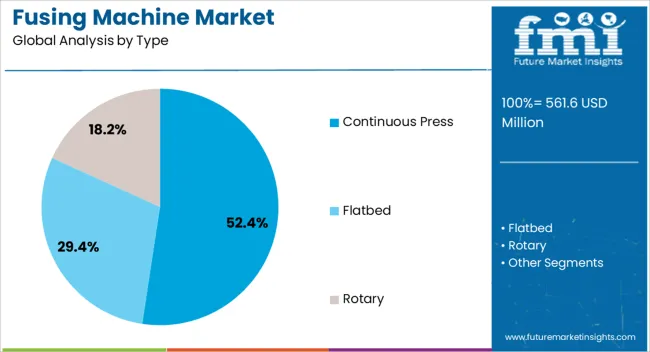
The continuous press segment is projected to account for 52.40% of the fusing machine market revenue share in 2025, making it the leading type. This dominance has been driven by the ability of continuous press machines to provide high-speed bonding and uniform adhesion, which are critical for large-scale garment production. The continuous design ensures seamless operation, reducing downtime and delivering consistent output across diverse fabric types.
Manufacturers have increasingly relied on continuous press machines due to their cost-effectiveness, high efficiency, and compatibility with modern automation systems. The capacity to manage high-volume production with minimal errors has reinforced their adoption in both large textile factories and garment export units.
Furthermore, advancements in temperature control, pressure adjustment, and fabric alignment technology have improved bonding quality, strengthening their market position Growing demand for reliable machinery that delivers speed without compromising fabric durability has established continuous press as the preferred type within the industry.
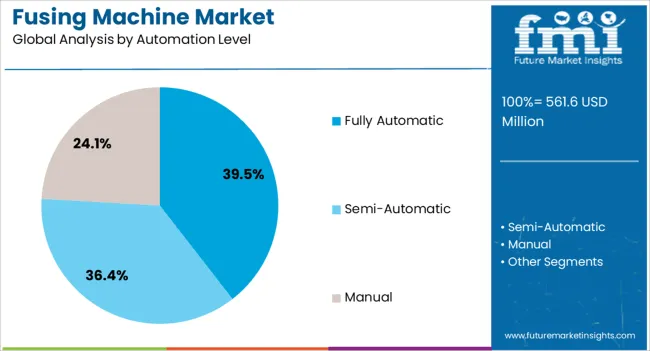
The fully automatic segment is anticipated to hold 39.50% of the fusing machine market revenue share in 2025, highlighting its growing influence. Adoption has been supported by the increasing need to reduce human intervention, minimize operational errors, and enhance efficiency in garment manufacturing processes. Fully automatic machines have delivered advantages such as faster cycle times, reduced labor costs, and higher consistency in production.
Their integration with digital controls, programmable settings, and monitoring systems has allowed manufacturers to achieve greater precision and adaptability in fabric bonding. The demand for fully automatic systems has also been reinforced by the rising focus on industrial automation and smart manufacturing, where seamless connectivity and process optimization are essential.
Additionally, businesses are leveraging these systems to align with sustainability goals by reducing material waste and energy consumption With greater emphasis on productivity, quality assurance, and scalability, the fully automatic segment continues to drive significant value within the overall fusing machine market.
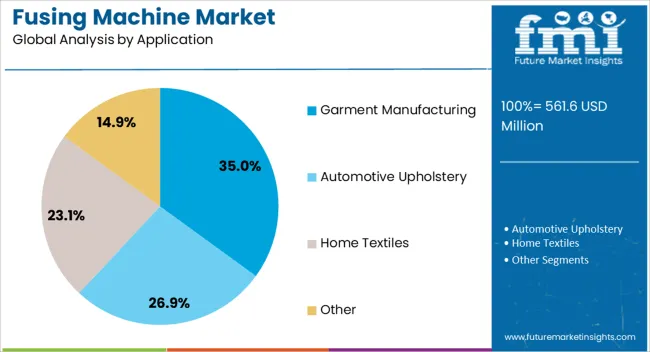
The garment manufacturing segment is projected to capture 35.00% of the fusing machine market revenue share in 2025, positioning it as the leading application area. This growth has been driven by the critical role fusing machines play in ensuring fabric strength, durability, and finishing quality, all of which are essential in apparel production. The segment has gained traction as global fashion and textile industries expand their production capacities to meet consumer demand.
Garment manufacturers have increasingly adopted advanced fusing machines to improve efficiency and reduce reliance on manual labor. With rising competition in the apparel industry, companies are prioritizing machines that enhance product quality while optimizing production timelines.
The ability of fusing machines to deliver consistent adhesion and high-quality finishes across a wide range of fabrics has strengthened their use in garment manufacturing Furthermore, the growth of fast fashion trends and expansion of apparel exports are fueling investments in modern fusing technologies, ensuring the segment remains dominant.
The fusing machine industry has the potential to evolve at 1.6X, amid a 5.2% surge in CAGR compared to the historical CAGR of 4.6%.
The market indicates a transition into sustainable and earth-conscious practices, corresponding to escalating awareness of the environment. Regional dynamics assist the global viewpoint, with different regions exhibiting fluctuating adoption and market trends.
| Attributes | Details |
|---|---|
| Market Value for 2020 | USD 408.70 million |
| Market Value for 2025 | USD 507.40 million |
| Market CAGR from 2020 to 2025 | 4.60% |
The market segmentation of textile fusing machinery is included in the following subsection. Based on comprehensive studies, the continuous press sector is commanding the type category. Similarly, the fully automatic machines segment is prevailing in the automation level category.
| Segment | Continuous Press |
|---|---|
| Share (2025) | 52.40% |
The continuous press technology segment empowers higher production, permitting firms to fulfill spurring demand. These continuous press machines bolster easy integration into prevailing manufacturing lines, diminishing installation intricacy and breaking workflows.
With their resilience and flexibility, continuous press fusing devices satisfy an array of end users, imparting pliability in production. The economical continuous press machines lead to extended savings, compelling them to be a profitable investment targeting steady growth.
| Segment | Fully Automatic Fusing Machines |
|---|---|
| Share (2025) | 39.50% |
Fully automatic fusing technology eases operations, curbing labor costs and booming efficiency. Fully automatic machines need less supervision, allowing for resources to be allocated more strategically, which escalates sales.
The fusing machine market can be observed in the subsequent tables, which focus on the leading regions in North America, Europe, and Asia Pacific. A comprehensive evaluation demonstrates that Asia Pacific has enormous market opportunities for fusing technology machines.
Future Outlook of The Fusing Machine Industry in North America
| Countries | CAGR (2025 to 2035) |
|---|---|
| United States | 4.40% |
| Canada | 5.00% |
The United States market is guided by the textile sector’s demand for proficient fabric bonding solutions. The surging consciousness regarding the advantage of these machines in strengthening product quality boosts market growth in the United States.
The spurring adoption of automated mass production in diverse industries amplifies the fusing technology device industry growth in the United States. Technological innovations and the prominence of environment-friendly products ramp up the demand for fusing devices in the United States.
The fusing machine market in Canada experiences robust growth escalated by the broadening automotive and aerospace sectors. The demand for tailored fusing device solutions booms in Canada, ushered by diverse manufacturing demands.
The strong stress on technological innovation in Canada nurtures the innovation of fusing machine techniques customized to definitive requirements. The amplifying trend of reshoring production operations presents opportunities for the fusing device solution industry in Canada as producers look for capable manufacturing solutions.
Industry Trends in Textile Fusing Machines in Europe
| Countries | CAGR (2025 to 2035) |
|---|---|
| France | 5.80% |
| Italy | 5.60% |
| Spain | 5.50% |
| United Kingdom | 4.90% |
| Germany | 4.80% |
The fusing machine market in France is upsurged by the healthy textile sector, capitalizing on advanced technology for productiveness. With an emphasis on zero waste, the fusing technology machine sector in France is experiencing a transition towards greener practices and products.
Advancements flourish in the French fusing device market, thrust by a custom of research and development. Automatism and cyberization mold the fusing gadget sector, ameliorating accuracy and efficiency.
The fusing device market in Italy highlights the country’s cultural heritage of textiles, synthesizing workmanship with innovative technology. Popular for its design expertise, Italy's fusing technology machine sector accentuates aesthetics uncompromising on performance.
SMEs are crucial in Italy's fusing device industry, nurturing flexibility and tailorization. Continuous research and development investment ushers Italy's fusing appliance industry upwards. The fusing machine market adjusts to the shifting needs of the consumers, with an amplifying demand for flexible solutions.
Spain's market is nurtured by a concentration on versatility. The fusing machine market in Spain is advancing with an escalation in demand for fuel-efficient solutions corresponding with nature-friendly goals.
Incorporating automation, the fusing appliance sector of Spain is simplifying manufacturing methods for enhanced efficiency. Adapting to developing market trends, the fusing technology machine industry in Spain is using digital transformation for upgraded connectivity and advancement.
Market Growth Drivers for Garment Fusing Equipment in Asia Pacific
| Countries | CAGR (2025 to 2035) |
|---|---|
| China | 6.20% |
| India | 5.90% |
| South Korea | 5.40% |
| Japan | 5.30% |
| Australia | 5.10% |
China's fusing machine market benefits from a strong textile industry and technological innovations. Government schemes encourage automation to spur the growth of fusing appliances. The spurring demand for good garments boosts the adoption of fusing devices in China.
The fusing technology machine sector in China observes innovation thrust by research and development investments. The intensifying awareness regarding eco-friendliness sustains the adoption of greener fusing appliances in China.
The market in India has witnessed significant growth, endorsed by the escalating apparel industry. The sales of fusing technology machines in SMEs thrust market expansion in India. Government schemes like "Make in India" ramp up domestic production of fusing devices.
Demand for lucrative and energy-saving fusing appliances spurs in the textile sector of India. The concentration on upgrading garment quality intensifies the demand for fusing devices in India.
The fusing technology sector in South Korea has the advantage of the powerful presence of dominant manufacturers and vendors. The intensified importance of automation in textile production amplifies the demand in South Korea.
Technological breakthroughs in fusing appliances assist South Korea's competition in the market. Government backing for research and development spurs innovation in the fusing device industry of South Korea.
The competitive landscape in the fusing technology machine sector comprises many vital producers who are crucial in adjusting industry dynamics. Manufacturers like Veit-Group, HASHIMA, and McElroy are popular for their advancement and dependability.
GF Central Plastics, Shanghai Weishi Mechanical, and Auto Garment catch attention to bring distinctive strengths and market solutions. Strima, Sharp International, and Maica Italia aid the competitive outlook with their specific offerings, while Oshima and Rotondi Group widen the spectrum with their myriad product range.
Reliant Machinery, Martin Group, and Zhaoqing Yili Garment Machinery are vital producers recognized for their involvement in industry breakthroughs. Ruihong Industrial and Advanced Innovative Technologies add profundity with their cutting-edge vision. Naomoto Corporation, Welco Garment Machinery, and Santex Rimar Group are predominantly assisting in the advancement of fusing technique machines.
As these vital vendors go through the competitive environment of the market, it imparts sustained breakthroughs in the industry, ushered by expertise and committed excellence.
Noteworthy Observations
| Company | Sojitz Corporation |
|---|---|
| Headquarter | Japan |
| Recent Advancement |
|
| Company | McElroy |
|---|---|
| Headquarter | United States |
| Recent Advancement |
|
| Company | GF Central Plastics |
|---|---|
| Headquarter | Switzerland |
| Recent Advancement |
|
| Company | Sharp International |
|---|---|
| Headquarter | United States |
| Recent Advancement |
|
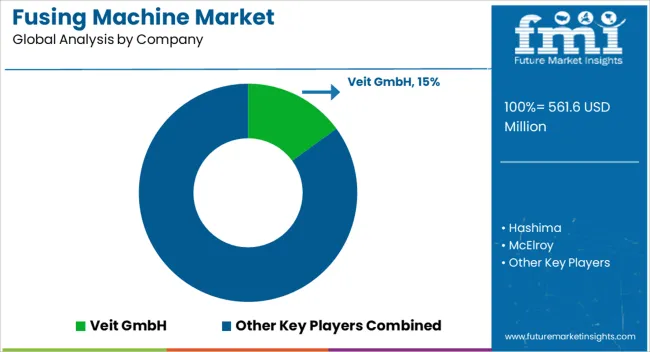
The global fusing machine market is estimated to be valued at USD 561.6 million in 2025.
The market size for the fusing machine market is projected to reach USD 932.3 million by 2035.
The fusing machine market is expected to grow at a 5.2% CAGR between 2025 and 2035.
The key product types in fusing machine market are continuous press, flatbed and rotary.
In terms of automation level, fully automatic segment to command 39.5% share in the fusing machine market in 2025.


Our Research Products

The "Full Research Suite" delivers actionable market intel, deep dives on markets or technologies, so clients act faster, cut risk, and unlock growth.

The Leaderboard benchmarks and ranks top vendors, classifying them as Established Leaders, Leading Challengers, or Disruptors & Challengers.

Locates where complements amplify value and substitutes erode it, forecasting net impact by horizon

We deliver granular, decision-grade intel: market sizing, 5-year forecasts, pricing, adoption, usage, revenue, and operational KPIs—plus competitor tracking, regulation, and value chains—across 60 countries broadly.

Spot the shifts before they hit your P&L. We track inflection points, adoption curves, pricing moves, and ecosystem plays to show where demand is heading, why it is changing, and what to do next across high-growth markets and disruptive tech

Real-time reads of user behavior. We track shifting priorities, perceptions of today’s and next-gen services, and provider experience, then pace how fast tech moves from trial to adoption, blending buyer, consumer, and channel inputs with social signals (#WhySwitch, #UX).

Partner with our analyst team to build a custom report designed around your business priorities. From analysing market trends to assessing competitors or crafting bespoke datasets, we tailor insights to your needs.
Supplier Intelligence
Discovery & Profiling
Capacity & Footprint
Performance & Risk
Compliance & Governance
Commercial Readiness
Who Supplies Whom
Scorecards & Shortlists
Playbooks & Docs
Category Intelligence
Definition & Scope
Demand & Use Cases
Cost Drivers
Market Structure
Supply Chain Map
Trade & Policy
Operating Norms
Deliverables
Buyer Intelligence
Account Basics
Spend & Scope
Procurement Model
Vendor Requirements
Terms & Policies
Entry Strategy
Pain Points & Triggers
Outputs
Pricing Analysis
Benchmarks
Trends
Should-Cost
Indexation
Landed Cost
Commercial Terms
Deliverables
Brand Analysis
Positioning & Value Prop
Share & Presence
Customer Evidence
Go-to-Market
Digital & Reputation
Compliance & Trust
KPIs & Gaps
Outputs
Full Research Suite comprises of:
Market outlook & trends analysis
Interviews & case studies
Strategic recommendations
Vendor profiles & capabilities analysis
5-year forecasts
8 regions and 60+ country-level data splits
Market segment data splits
12 months of continuous data updates
DELIVERED AS:
PDF EXCEL ONLINE
Machine Glazed Paper Market Size and Share Forecast Outlook 2025 to 2035
Machine Glazed Kraft Paper Market Forecast and Outlook 2025 to 2035
Machine Condition Monitoring Market Size and Share Forecast Outlook 2025 to 2035
Machine Glazed Paper Industry Analysis in Asia Pacific Forecast Outlook 2025 to 2035
Machine Vision Camera Market Size and Share Forecast Outlook 2025 to 2035
Machine Tool Oils Market Size and Share Forecast Outlook 2025 to 2035
Machine Vision System And Services Market Size and Share Forecast Outlook 2025 to 2035
Machine Glazed Paper Industry Analysis in Western Europe Size and Share Forecast Outlook 2025 to 2035
Machine Glazed Paper Industry Analysis in Korea Size and Share Forecast Outlook 2025 to 2035
Machine Glazed Paper Industry Analysis in Japan Size and Share Forecast Outlook 2025 to 2035
Machine Tool Cooling System Market Analysis - Size, Share, and Forecast Outlook 2025 to 2035
Machine Tool Touch Probe Market Analysis - Size, Growth, and Forecast 2025 to 2035
Machine Mount Market Analysis - Size & Industry Trends 2025 to 2035
Machine Control System Market Growth – Trends & Forecast 2025 to 2035
Machine Automation Controller Market Growth – Trends & Forecast 2025 to 2035
Machine-to-Machine (M2M) Connections Market – IoT & Smart Devices 2025 to 2035
Machine Safety Market Analysis by Component, Industry, and Region Through 2035
Key Players & Market Share in Machine Glazed Paper Industry
Machine Vision Market Insights – Growth & Forecast 2024-2034
Machine Learning As A Services Market

Thank you!
You will receive an email from our Business Development Manager. Please be sure to check your SPAM/JUNK folder too.
Chat With
MaRIA