The global glycolic acid market is valued at USD 522.4 million in 2025. It is slated to reach USD 819.1 million by 2035, recording an absolute increase of USD 290.1 million over the forecast period. This translates into a total growth of 55.5%, with the market forecast to expand at a compound annual growth rate (CAGR) of 4.6% between 2025 and 2035. Based on FMI’s verified global materials database, covering industrial resins, coatings, and additives, the overall market size is expected to grow by nearly 1.56X during the same period, supported by increasing demand for alpha hydroxy acid actives in skincare formulations, growing adoption of glycolic acid in industrial cleaning and descaling applications, and rising emphasis on efficacy-driven cosmetic ingredients across diverse personal care, pharmaceutical, and industrial processing applications.
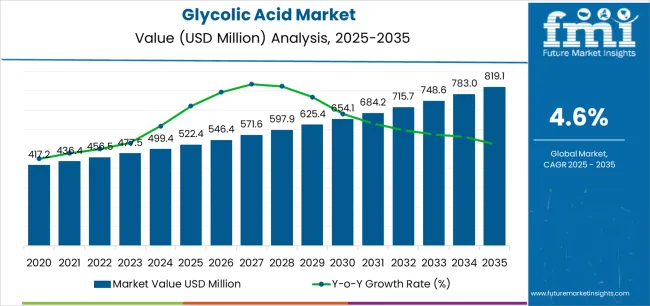
Between 2025 and 2030, the glycolic acid market is projected to expand from USD 522.4 million to USD 654.6 million, resulting in a value increase of USD 132.2 million, which represents 45.5% of the total forecast growth for the decade. This phase of development will be shaped by increasing consumer awareness of alpha hydroxy acid benefits in anti-aging skincare, rising adoption of professional chemical peel treatments in dermatology and aesthetics, and growing demand for effective industrial cleaning formulations that ensure operational efficiency and equipment maintenance across food processing, textile, and oil and gas sectors. Personal care formulators and industrial chemical suppliers are expanding their glycolic acid capabilities to address the growing demand for high-purity actives and specialized cleaning solutions.
| Metric | Value |
|---|---|
| Estimated Value in (2025E) | USD 522.4 million |
| Forecast Value in (2035F) | USD 812.5 million |
| Forecast CAGR (2025 to 2035) | 4.6% |
From 2030 to 2035, the market is forecast to grow from USD 654.6 million to USD 812.5 million, adding another USD 157.9 million, which constitutes 54.5% of the overall ten-year expansion. This period is expected to be characterized by the expansion of natural and bio-based glycolic acid production pathways, the development of advanced formulation technologies enabling higher concentration leave-on products, and the growth of specialized applications for electronics cleaning, biodegradable polymer production, and pharmaceutical intermediates. The growing adoption of clean beauty principles and sustainable sourcing practices will drive demand for glycolic acid with enhanced purity profiles, renewable feedstock origins, and comprehensive safety documentation features.
Between 2020 and 2025, the glycolic acid market experienced steady growth, driven by increasing consumer demand for clinically-proven skincare actives and growing recognition of glycolic acid as a versatile chemical intermediate for industrial applications in cleaning, textile processing, and chemical synthesis. The market developed as cosmetic formulators and industrial buyers recognized the potential for glycolic acid to deliver visible efficacy in anti-aging treatments while supporting diverse industrial processing requirements through its acidic properties and chelating capabilities. Technological advancement in purification processes and concentration optimization began emphasizing the critical importance of maintaining product quality and safety standards in sensitive personal care and pharmaceutical applications.
Market expansion is being supported by the increasing global demand for evidence-based skincare ingredients and the corresponding need for alpha hydroxy acid actives that can deliver clinically-verified exfoliation benefits, stimulate cellular turnover, and improve visible skin texture across various cosmetic, dermacosmetic, and professional aesthetic applications. Modern skincare formulators and dermatologists are increasingly focused on implementing glycolic acid solutions that can address multiple aging concerns, provide predictable performance at optimized pH levels, and support comprehensive anti-aging regimens with excellent safety profiles. Glycolic acid's proven ability to penetrate the stratum corneum, promote collagen synthesis, and deliver visible rejuvenation results makes it an essential active ingredient for contemporary personal care and professional skincare formulations.
The growing emphasis on industrial efficiency and equipment maintenance is driving demand for glycolic acid-based cleaning formulations that can support effective descaling operations, ensure reliable metal surface treatment, and enable comprehensive equipment care in food processing, textile finishing, and oil and gas applications. Industrial buyers' preference for cleaning agents that combine effectiveness with biodegradability and user safety is creating opportunities for innovative glycolic acid implementations across institutional and industrial cleaning segments. The rising influence of clean beauty movements and natural ingredient preferences is also contributing to increased adoption of bio-based glycolic acid that can provide equivalent performance without compromising sustainability credentials or formulation naturalness claims.
The market is segmented by grade, end use, source, purity/grade use-case, distribution, and region. By grade, the market is divided into technical grade, pharma grade, and industrial grade. Based on end use, the market is categorized into personal care, chemicals/industrial cleaning, textile, pharmaceuticals, oil & gas, agriculture, electronics, and others. By source, the market covers synthetic and natural/biobased. Based on purity/grade use-case, the market includes cosmetic/personal-care grades, technical/industrial blends, and specialty/high-purity pharma & electronics. By distribution, the market is divided into direct supply/key accounts and distributors/merchant. Regionally, the market is divided into Asia Pacific, North America, Europe, Latin America, and the Middle East & Africa.
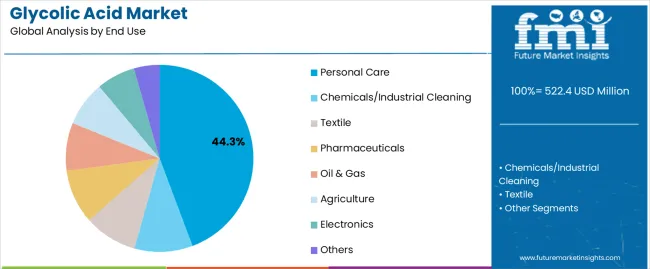
The personal care application segment is projected to represent the largest share of glycolic acid demand in 2025 with 44.3% market share, underscoring its critical role as the primary driver for glycolic acid adoption across skincare formulations, anti-aging treatments, chemical peels, and cosmetic products emphasizing exfoliation and skin renewal benefits. Personal care formulators prefer glycolic acid for its smallest molecular size among alpha hydroxy acids, superior skin penetration capabilities, clinically-documented efficacy in improving skin texture and reducing visible signs of aging, and versatile formulation compatibility enabling incorporation into diverse product formats including serums, creams, cleansers, and professional treatments. Positioned as a gold-standard exfoliating active, glycolic acid offers both proven performance and extensive safety documentation.
The segment is supported by continuous innovation in cosmetic formulation technologies and the growing availability of stabilized glycolic acid systems that enable effective delivery in leave-on products with enhanced consumer tolerance and minimized irritation potential. Additionally, personal care brands are investing in comprehensive clinical testing programs to support efficacy claims and differentiate products in competitive anti-aging markets. As consumer awareness of evidence-based skincare ingredients increases and demand for results-driven formulations grows, the personal care application will continue to dominate the market while supporting advanced formulation utilization and product innovation strategies across mass, premium, and professional skincare segments.
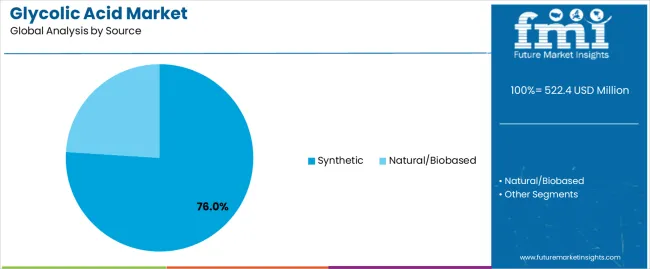
The synthetic source segment commands the largest market share at 76% in 2025, reflecting its established position as the primary production pathway for glycolic acid offering consistent quality, reliable supply, cost competitiveness, and scalable manufacturing capacity through well-established chemical synthesis routes. Synthetic glycolic acid production benefits from mature process technologies utilizing formaldehyde and carbon monoxide feedstocks or ethylene glycol oxidation pathways that deliver high-purity products meeting pharmaceutical, cosmetic, and industrial specifications. The widespread availability of raw materials, established production infrastructure, and proven manufacturing economics support synthetic pathway dominance across global markets and diverse application segments.
Natural and bio-based glycolic acid accounts for 24% share, representing emerging fermentation and renewable feedstock pathways gaining traction among clean beauty brands and sustainability-focused formulators seeking natural origin claims and renewable carbon sourcing. The synthetic segment's leadership is reinforced by decades of manufacturing optimization, comprehensive regulatory approval across global markets, extensive toxicological and safety documentation, and economic advantages that enable competitive pricing for both personal care and industrial applications. Major glycolic acid suppliers maintain synthetic production as their primary platform while selectively developing bio-based offerings to address premium segments and specific customer requirements for natural ingredient sourcing and sustainability credentials.
The glycolic acid market is advancing steadily due to increasing consumer demand for clinically-proven anti-aging ingredients and growing adoption of evidence-based skincare formulations that provide visible exfoliation benefits and documented efficacy across diverse personal care, dermacosmetic, and professional aesthetic applications. The market faces challenges, including potential skin irritation and sensitization concerns requiring careful formulation and consumer education, intense competition from alternative alpha hydroxy acids and newer exfoliating technologies including polyhydroxy acids and enzymatic systems, and regulatory scrutiny regarding sun sensitivity warnings and safe concentration limits in consumer products. Innovation in buffering systems and sustained-release technologies continues to influence product development and market expansion patterns.
The growing popularity of professional chemical peel treatments and in-office aesthetic procedures is enabling dermatologists and licensed aestheticians to deliver superior skin rejuvenation results, address stubborn hyperpigmentation and photodamage, and provide high-concentration glycolic acid applications that achieve dramatic improvements beyond home-use product capabilities. Professional treatments utilizing 30-70% glycolic acid concentrations provide accelerated exfoliation while allowing controlled application, proper neutralization, and expert monitoring for safety and optimal results. Medical spa operators are increasingly recognizing the revenue opportunities and patient satisfaction benefits of offering evidence-based chemical peel services featuring glycolic acid as a foundational treatment modality for diverse skin concerns and age groups.
Modern glycolic acid manufacturers are incorporating renewable feedstock pathways and fermentation-based production routes to enhance environmental sustainability credentials, reduce fossil carbon dependency, and support clean beauty brand requirements for natural origin ingredients through sugarcane-derived and other bio-based manufacturing processes. These technologies improve life cycle environmental performance while enabling natural ingredient claims that resonate with conscious consumers and support premium brand positioning. Advanced bio-based production also allows manufacturers to serve comprehensive sustainability objectives and differentiate offerings beyond conventional synthetic glycolic acid approaches, creating competitive advantages in clean beauty segments and supporting long-term strategic positioning as sustainability expectations continue rising across personal care and pharmaceutical industries.
The emergence of buffered glycolic acid systems, encapsulation technologies, and controlled-release mechanisms is creating new formulation possibilities with improved consumer tolerance, enhanced stability in finished products, and superior efficacy through optimized skin penetration and sustained activity over extended timeframes. These innovations enable formulators to develop sophisticated leave-on treatments combining high active concentrations with excellent sensory characteristics and minimized irritation potential through pH optimization, pairing with soothing agents, and time-release delivery platforms. Leading skincare brands are investing in proprietary delivery systems that leverage glycolic acid's proven efficacy while addressing historical limitations including potential irritation, instability in certain formulations, and incompatibility with specific ingredients, thereby expanding application possibilities across daily-use products, overnight treatments, and targeted interventions for diverse consumer segments and skin types.
| Country | CAGR (2025-2035) |
|---|---|
| India | 6.4% |
| China | 5.9% |
| USA | 4.8% |
| Brazil | 4.7% |
| Japan | 4.6% |
| South Korea | 4.5% |
| Germany | 4.4% |
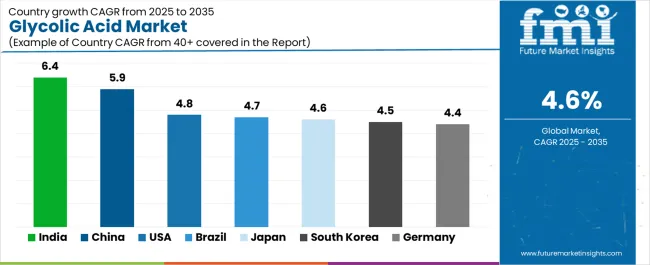
The glycolic acid market is experiencing solid growth globally, with India leading at a 6.4% CAGR through 2035, driven by rapid growth in both mass and premium skincare segments, scaling local dermacosmetics brands emphasizing clinical actives, and rising adoption in institutional and industrial cleaning formulations across expanding commercial and hospitality sectors. China follows at 5.9%, supported by expanding dermaceutical categories and industrial cleaning applications, strong original equipment manufacturer and private-label skincare export capabilities, and growing domestic consumer sophistication regarding active ingredients. The United States shows growth at 4.8%, emphasizing high adoption of alpha hydroxy acid skincare and professional chemical peel treatments, diversified institutional and industrial cleaning applications, and robust textile care markets.
Brazil records 4.7%, focusing on large beauty and personal hygiene market, local contract manufacturing pull for alpha hydroxy acid formulation lines, and growing premium skincare adoption. Japan demonstrates 4.6% growth, supported by demand for gentle yet efficacy-led actives and precision grades for cosmetics and electronics cleaning applications. South Korea exhibits 4.5% growth, emphasizing K-beauty actives adoption with global export traction and growing hair and scalp alpha hydroxy acid product innovation. Germany shows 4.4% growth, supported by strict quality and sustainability specifications and steady premium personal care and industrial demand.
The report covers an in-depth analysis of 40+ countries, the top-performing countries are highlighted below.
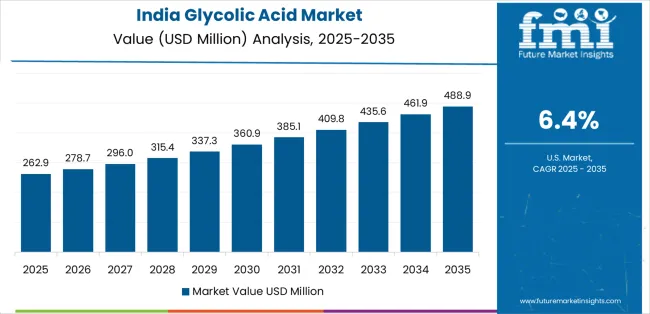
Revenue from glycolic acid in India is projected to exhibit exceptional growth with a CAGR of 6.4% through 2035, driven by rapid expansion across both mass-market and premium skincare segments with increasing consumer awareness of alpha hydroxy acid benefits and efficacy-driven formulations supported by growing disposable incomes and digital beauty education platforms. The country's large and youthful population, expanding middle class with growing purchasing power, and increasing acceptance of active ingredient-based skincare are creating substantial demand for glycolic acid across diverse product categories and price points. Major international personal care companies and domestic skincare brands are establishing comprehensive glycolic acid formulation capabilities to serve both domestic consumer markets and export opportunities in alpha hydroxy acid products.
Revenue from glycolic acid in China is expanding at a CAGR of 5.9%, supported by the country's rapidly growing dermaceutical category emphasizing clinical actives and efficacy-focused formulations, expanding industrial cleaning applications across manufacturing and food processing sectors, and strong original equipment manufacturer and private-label skincare export capabilities serving international beauty markets. The country's sophisticated cosmetic manufacturing infrastructure and expanding domestic skincare sophistication are driving demand for diverse glycolic acid grades. International ingredient suppliers and domestic chemical manufacturers are establishing extensive production and distribution capabilities to address growing glycolic acid demand.
Revenue from glycolic acid in the United States is expanding at a CAGR of 4.8%, supported by the country's mature anti-aging skincare market with high consumer adoption of alpha hydroxy acid products, extensive professional chemical peel treatment infrastructure across dermatology and medical spa channels, and diversified institutional and industrial cleaning applications spanning food service, hospitality, healthcare, and manufacturing sectors. The nation's sophisticated personal care market and advanced industrial chemical consumption are driving demand for diverse glycolic acid specifications. Major cosmetic companies and industrial chemical distributors are investing in comprehensive glycolic acid supply chains to serve both consumer and industrial markets.
Revenue from glycolic acid in Brazil is growing at a CAGR of 4.7%, driven by the country's large and sophisticated beauty and personal hygiene market with strong consumer engagement in skincare categories, growing local contract manufacturing infrastructure attracting international brands seeking cost-competitive production platforms, and increasing premium skincare adoption among expanding middle-class consumers emphasizing visible results and ingredient efficacy. The country's established cosmetic industry and growing manufacturing capabilities are supporting demand for diverse glycolic acid applications across beauty and industrial sectors. Domestic ingredient distributors and international suppliers are establishing comprehensive capabilities to serve Brazilian glycolic acid markets.
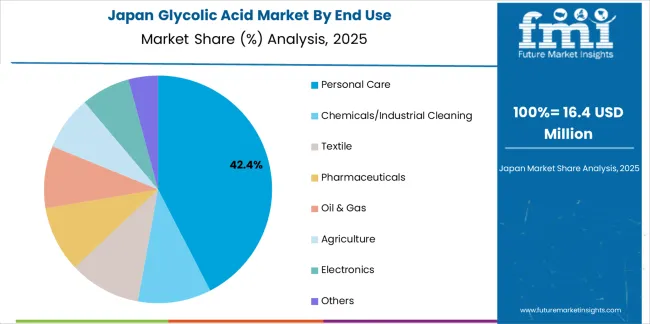
Revenue from glycolic acid in Japan is expanding at a CAGR of 4.6%, supported by the country's sophisticated skincare culture emphasizing gentle yet efficacy-led active ingredients, precision quality standards requiring ultra-high purity and comprehensive analytical documentation, and specialized applications spanning cosmetics, pharmaceutical intermediates, and electronics cleaning operations demanding exceptional material specifications. Japan's advanced cosmetic industry and precision manufacturing sectors are driving demand for premium glycolic acid grades. Leading cosmetic companies and specialty chemical suppliers are investing in specialized capabilities to serve Japanese quality requirements and innovation-driven market dynamics.
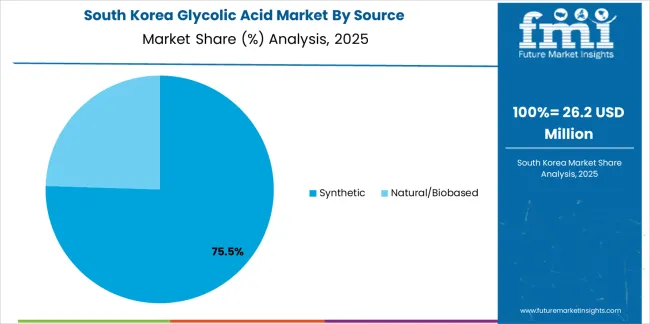
Revenue from glycolic acid in South Korea is growing at a CAGR of 4.5%, driven by the country's influential K-beauty industry's adoption of alpha hydroxy acid actives with global export traction, innovative product development in hair and scalp care categories featuring glycolic acid for gentle exfoliation and scalp health optimization, and sophisticated cosmetic manufacturing infrastructure serving both domestic and international markets with trend-leading formulations. The country's dynamic beauty industry and export-oriented manufacturing are supporting investment in glycolic acid capabilities. Major Korean cosmetic companies and ingredient suppliers are establishing comprehensive glycolic acid formulation expertise to support product innovation and export growth.
Revenue from glycolic acid in Germany is expanding at a CAGR of 4.4%, supported by the country's strict quality and sustainability specifications requiring comprehensive documentation and environmental credentials, established premium personal care market emphasizing natural and evidence-based ingredients, and steady industrial demand across cleaning, textile, and specialty chemical applications within advanced manufacturing economy. Germany's quality-focused personal care sector and precision industrial applications are driving demand for certified glycolic acid supplies. International suppliers and domestic distributors are investing in compliance capabilities and technical support to serve German market requirements.
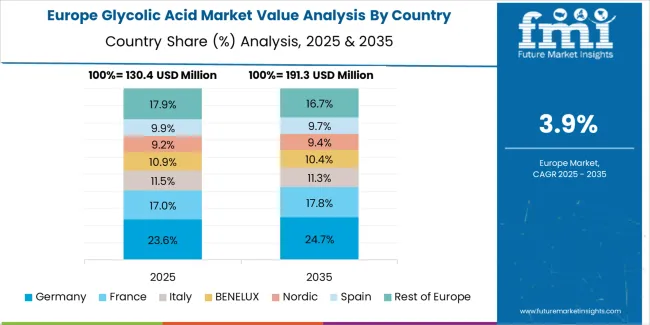
The glycolic acid market in Europe is projected to grow from USD 162 million in 2025 to USD 252 million by 2035, registering a CAGR of 4.5% over the forecast period. Germany is expected to maintain its leadership position with a 24.5% market share in 2025, moderating slightly to 24.2% by 2035, supported by its premium personal care sector, strict quality standards, and comprehensive industrial chemical infrastructure serving major European markets.
France follows with 21% in 2025, projected to reach 21.3% by 2035, driven by sophisticated cosmetic industry leadership, strong pharmacy channel distribution for dermacosmetic products, and established active ingredient manufacturing capabilities. The United Kingdom holds 18.5% in 2025, rising to 18.7% by 2035, supported by mature anti-aging skincare market and growing clean beauty movement emphasizing active ingredients. Italy commands 14% in 2025, projected to reach 14.2% by 2035, driven by established cosmetic manufacturing sector and growing professional aesthetic services.
Spain accounts for 9% in 2025, expected to reach 9.2% by 2035, supported by expanding beauty market and growing industrial applications. The Netherlands maintains 5% in 2025, growing to 5.1% by 2035, driven by chemical distribution hub position and personal care manufacturing. The Rest of Europe region, including Nordic countries, Eastern Europe, and other markets, is anticipated to hold 8% in 2025, moderating to 7.3% by 2035, attributed to diversified demand across emerging personal care markets and industrial applications implementing advanced active ingredient formulations and specialty chemical solutions.
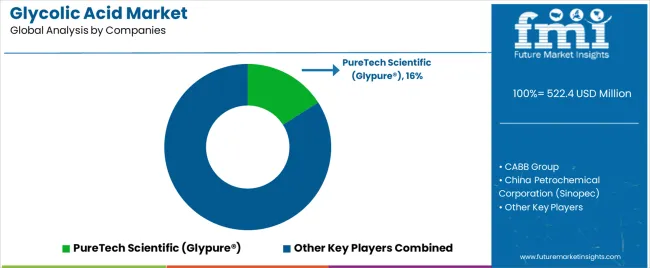
The glycolic acid market is characterized by competition among established specialty chemical manufacturers, pharmaceutical fine chemical producers, and integrated cosmetic ingredient suppliers. Companies are investing in advanced purification technology research, quality assurance excellence, sustainable production development, and comprehensive product portfolios to deliver high-purity, reliable, and certified glycolic acid solutions. Innovation in bio-based production pathways, formulation support services, and application-specific grade development is central to strengthening market position and competitive advantage.
PureTech Scientific leads the market with a commanding 16% market share through its Glypure® brand, offering comprehensive glycolic acid solutions with advanced purification technologies, emphasizing ultra-high purity grades and extensive technical support across personal care, pharmaceutical, and industrial applications. CABB Group provides specialized fine chemical manufacturing with emphasis on pharmaceutical and cosmetic-grade glycolic acid production meeting stringent European quality standards. China Petrochemical Corporation (Sinopec) delivers large-scale chemical production with focus on cost-competitive glycolic acid supply serving Asian and global industrial markets. Merck (Sigma-Aldrich) specializes in laboratory and pharmaceutical-grade chemicals with emphasis on analytical standards and research applications.
DuPont offers specialty chemicals portfolio with focus on personal care ingredients and industrial applications. CrossChem provides regional supply and distribution with emphasis on cosmetic-grade materials and technical service. Hebei Chengxin focuses on cost-competitive Chinese production serving domestic and export industrial markets. Shandong Xinhua Pharma specializes in pharmaceutical intermediates and fine chemicals including high-purity glycolic acid. Zhonglan Industry offers integrated chemical production with focus on industrial and technical grades. Haihang Industry provides specialty chemical manufacturing and distribution serving diverse Asian markets.
Glycolic acid represents a specialized alpha hydroxy acid segment within personal care actives and industrial chemicals, projected to grow from USD 522.4 million in 2025 to USD 812.5 million by 2035 at a 4.6% CAGR. This smallest molecular weight alpha hydroxy acid—primarily technical and cosmetic grades for exfoliation and chemical processing—is produced through synthetic and bio-based pathways to serve as a key active ingredient in anti-aging skincare formulations, professional chemical peels, industrial cleaning and descaling solutions, textile processing, and pharmaceutical intermediate applications. Market expansion is driven by increasing consumer demand for evidence-based skincare ingredients, growing adoption of professional aesthetic treatments, expanding institutional and industrial cleaning requirements, and rising emphasis on efficacy-driven formulations across beauty, pharmaceutical, and industrial processing sectors.
How Cosmetic Regulators Could Strengthen Safety Standards and Market Confidence?
How Personal Care Industry Associations Could Advance Best Practices and Innovation?
How Glycolic Acid Manufacturers Could Drive Quality Excellence and Market Expansion?
How Personal Care Formulators Could Optimize Product Performance and Consumer Satisfaction?
How Dermatologists and Aesthetic Practitioners Could Enhance Treatment Outcomes?
How Investors and Financial Enablers Could Support Market Growth and Innovation?
| Items | Values |
|---|---|
| Quantitative Units (2025) | USD 522.4 Million |
| Grade | Technical Grade, Pharma Grade, Industrial Grade |
| End Use | Personal Care, Chemicals/Industrial Cleaning, Textile, Pharmaceuticals, Oil & Gas, Agriculture, Electronics, Others |
| Source | Synthetic, Natural/Biobased |
| Purity/Grade Use-Case | Cosmetic/Personal-care Grades (incl. leave-on & rinse-off), Technical/Industrial Blends (cleaners, descalers, I&I), Specialty/High-purity Pharma & Electronics |
| Distribution | Direct Supply/Key Accounts, Distributors/Merchant |
| Regions Covered | Asia Pacific, North America, Europe, Latin America, Middle East & Africa |
| Countries Covered | India, China, United States, Brazil, Japan, South Korea, Germany, and 40+ countries |
| Key Companies Profiled | PureTech Scientific, CABB Group, Sinopec, Merck, DuPont, CrossChem |
| Additional Attributes | Dollar sales by grade, end use, source, purity/grade use-case, and distribution categories, regional demand trends, competitive landscape, technological advancements in purification systems, bio-based production development, formulation innovation, and application expansion optimization |
The global glycolic acid market is estimated to be valued at USD 522.4 million in 2025.
The market size for the glycolic acid market is projected to reach USD 819.1 million by 2035.
The glycolic acid market is expected to grow at a 4.6% CAGR between 2025 and 2035.
The key product types in glycolic acid market are personal care, chemicals/industrial cleaning, textile, pharmaceuticals, oil & gas, agriculture, electronics and others.
In terms of source, synthetic segment to command 76.0% share in the glycolic acid market in 2025.


Full Research Suite comprises of:
Market outlook & trends analysis
Interviews & case studies
Strategic recommendations
Vendor profiles & capabilities analysis
5-year forecasts
8 regions and 60+ country-level data splits
Market segment data splits
12 months of continuous data updates
DELIVERED AS:
PDF EXCEL ONLINE
Glycolic Acid Toners Market Analysis - Size, Share, and Forecast Outlook 2025 to 2035
Glycolic Acid Peel Market Insights – Growth & Forecast 2024-2034
Polyglycolic Acid Market
Thioglycolic Acid Market
Hydroglycolic Extracts Market
Acid Resistant Pipe Market Forecast and Outlook 2025 to 2035
Acid Coil Cleaner Market Size and Share Forecast Outlook 2025 to 2035
Acid Filling and Leveling Machine Market Size and Share Forecast Outlook 2025 to 2035
Acid Chlorides Market Size and Share Forecast Outlook 2025 to 2035
Acid-Sensitive APIs Market Analysis - Size, Share, and Forecast Outlook 2025 to 2035
Acidified Whey Protein Market Analysis - Size, Share & Trends 2025 to 2035
Acid Dyes Market Growth - Trends & Forecast 2025 to 2035
Acidity Regulator Market Growth - Trends & Forecast 2025 to 2035
Acid Proof Lining Market Trends 2025 to 2035
Acid Citrate Dextrose Tube Market Trends – Growth & Industry Outlook 2024-2034
Acid Orange Market
Antacids Market Analysis – Size, Trends & Forecast 2025 to 2035
Lead Acid Battery Market Size and Share Forecast Outlook 2025 to 2035
Lead Acid Battery Recycling Market Size and Share Forecast Outlook 2025 to 2035
Feed Acidifier Market Analysis Size Share and Forecast Outlook 2025 to 2035

Thank you!
You will receive an email from our Business Development Manager. Please be sure to check your SPAM/JUNK folder too.
Chat With
MaRIA