

- Market Size (2026)
- USD 191.4 Mn
- Forecast (2036)
- USD 605.2 Mn
- CAGR (2026 to 2036)
- 12.2%
How big is Greenhouse Biostimulants Market in 2026?
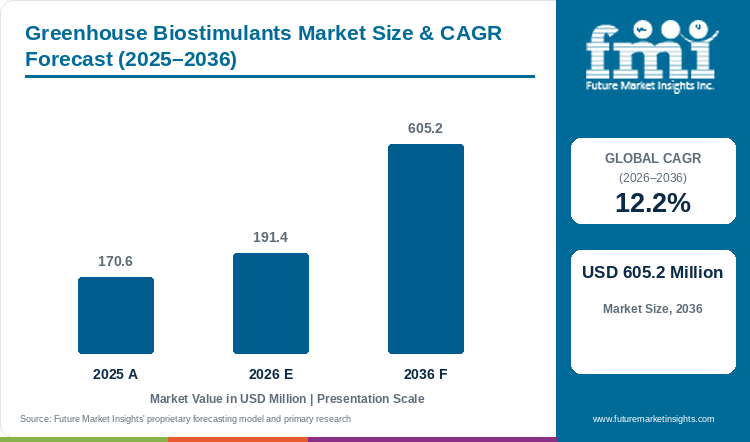
Greenhouse biostimulants generated sales of USD 170.6 million in 2025, and the market is valued at USD 191.4 million in 2026. Sales are forecast to reach USD 605.2 million by 2036, advancing at a 12.2% CAGR during 2026 to 2036.
Higher crop value under glass is the main pull on biostimulant purchases by protected growers. In February 2026, USDA reported that food crops grown under protection in the USA earned USD 1.01 billion in 2024, up 44% on the previous census [1]. An April 2026 review in Agronomy found that microbial and non-microbial products can support root growth, nutrient absorption and stress tolerance in hydroponic crops [2]. Large suppliers in the wider biostimulants business publish field results, and Yara reported a 7.5% average yield gain across 359 data points from 2018 to 2020 trials [3]. FMI notes that complete A/B nutrient systems hold the leading 36.7% share in 2026, as growers buy these base feed programs alongside biostimulant additives. Sales of plant biostimulants for crops grown under cover will keep rising as growers add root and stress products to fertigation programs.
Key Market Trends & Insights
- By product type, complete A/B nutrient systems led the market with 36.7% in 2026, as two-part concentrates hold one base feed steady across crop cycles.
- By crop, leafy greens and herbs account for 42.3% of sales in 2026, and UK protected lettuce area rose 6.1% to 458 hectares in 2025 [4].
- By system, drip substrate (cocopeat / rockwool) stays ahead with 43.5% in 2026, as growers can trial an additive on one irrigation zone first.
- By grower type, commercial greenhouses hold 48.3% in 2026, and block trials on these sites are expected to keep turning into site-wide orders through 2036.
- By sales channel, greenhouse suppliers carry 41.5% of sales in 2026, as orders come with advice on water tests and mixing order. Griffin Greenhouse Supplies was named U.S. distributor for the Biota Nutri biostimulant range in February 2026 [5].
Regional Highlights
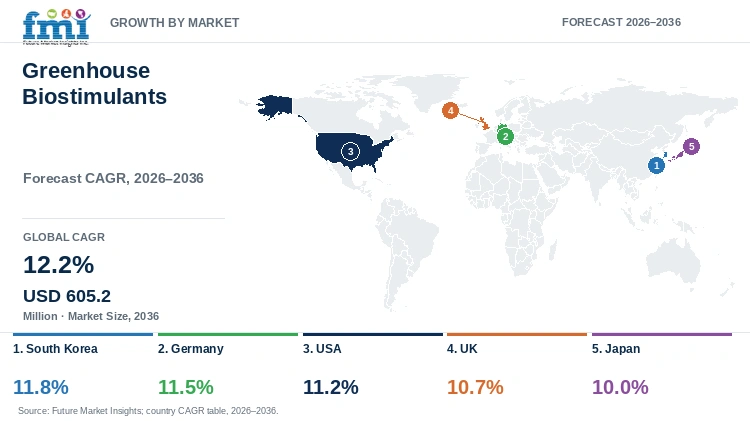
- Fastest-growing profiled country: South Korea, with an 11.8% CAGR over 2026 to 2036.
- By country: Germany follows at 11.5% and the USA at 11.2% through 2036, and the UK (10.7%) and Japan (10%) post the slower rates.
- Smart-farm conversion is behind the Korean lead, as MAFRA plans to turn 35% of about 55,000 hectares of greenhouses into smart farms by 2029 [6].
Market Size & Forecast
Table 1: Market Size and Forecast for the Greenhouse Biostimulants Market (USD million and percentage), 2025 to 2036
| Metric | Value |
|---|---|
| 2025 Market Size | USD 170.6 million |
| Estimated Market Size in 2026 | USD 191.4 million |
| Projected Market Size by 2036 | USD 605.2 million |
| CAGR, 2026 to 2036 | 12.2% |
| Added Revenue, 2026 to 2036 | USD 413.8 million |
| Market Expansion Multiple | 3.2x |
High-value vegetable and salad growers on drip substrate and recirculating systems account for most greenhouse biostimulant sales today. Each covered hectare carries high heating and labour costs, so these growers pay for inputs that protect yield. German protected vegetable output rose 4.3% to 219,200 tonnes in 2025, as covered area grew only 0.8% to 1,250 hectares [7]. Canada's greenhouse area also rose 1.4% to 35.9 million square metres in 2025 [8]. However, label rules still differ between markets, as California has allowed plant biostimulant claims only since January 2025 and only for humic acid, seaweed or kelp extract products [9]. According to FMI, suppliers printing dose rates for each substrate and water type are set to capture the bulk of reorders over the forecast period.
Covered Crop Base, Yield per Hectare and Claim Rules
Sales of greenhouse biostimulants follow crop value per covered hectare more closely than new glasshouse building. UK growers farmed 866 hectares of protected vegetables in 2025, a crop worth £431 million [4]. Dutch greenhouse vegetable area reached 5,760 hectares, with tomatoes up 180 hectares and sweet peppers up 130 hectares [10]. In Canada, greenhouse area rose to 35.9 million square metres, and tomato output grew 4.5% and cucumber output 5.2% [8]. Japan has about 37,000 hectares of glass and plastic houses [11]. South Korea has roughly 55,000 hectares of greenhouses and plans to convert 35% of that area into smart farms by 2029 [6]. These automated houses will need biostimulants suited to automatic dosing. FMI expects the market to add USD 413.8 million between 2026 and 2036, a 3.2-times rise, as growers spend to protect yield on existing glass.
Demand for tested biostimulants is rising as claim rules tighten in the main greenhouse markets. Regulation (EU) 2019/1009 has applied since 16 July 2022 and defines a plant biostimulant by the effect on the crop [12]. Those effects cover nutrient use efficiency, abiotic stress tolerance, quality traits and the availability of confined nutrients [12]. Base A/B feeds are sold next to these products as fertiliser programs with nutrient claims, and the biostimulant rules govern the additives dosed on top. COMPO EXPERT noted in June 2025 that EU biostimulants need external conformity checks backed by trial data before CE marking [13]. In the USA, House bill H.R. 3783, the Plant Biostimulant Act, was introduced on 5 June 2025 to set a federal definition [14]. Stricter rules slow first purchases, but growers place more trust in products that pass them. Published trial data also helps, and Yara reported positive results in 74% of 359 trial data points from 2018 to 2020 [3]. South Korea leads the profiled countries at an 11.8% CAGR through 2036 on the smart-farm plan [6]. Germany follows at 11.5% over the same period, as output rises from almost flat area [7]. The USA is set to grow at 11.2% through 2036, with protected food crops worth USD 1.01 billion in 2024 [1]. The UK comes next at 10.7% by 2036 after protected vegetable value slipped 1.1% in 2025 [4]. Japan is slowest at 10% during the forecast period, as MAFF issued the country's first biostimulant labeling guideline only in May 2025 [15]. Suppliers with greenhouse trial records will gain the most orders as these rules settle through 2036.
Table 2: Covered Crop Base, Yield and Claim Rule Indicators for the Greenhouse Biostimulants Market (hectares, tonnes, square metres, sales values and rule dates), mixed reporting years from 2022 to 2029
| Indicator | Data Point | Market Relevance | Source |
|---|---|---|---|
| USA food crops under protection | USD 1.01 billion in 2024 sales, up 44% on the previous census | A larger US covered crop base brings more orders for greenhouse inputs. | [1] |
| Germany protected vegetables | 1,250 ha (+0.8%); 219,200 t (+4.3%) in 2025 | Growers buy yield-support inputs to raise output per heated hectare. | [7] |
| Netherlands greenhouse vegetable area | 5,760 ha in 2025; tomatoes +180 ha; sweet peppers +130 ha | More tomato and pepper area adds Dutch orders for root and stress products. | [10] |
| UK protected vegetables | 866 ha and £431 million in 2025 (value down 1.1%) | UK growers favour inputs paying back within one crop cycle. | [4] |
| Canada greenhouse area | 35.9 million m² in 2025, up 1.4% | Added covered area brings North American orders for fertigation inputs. | [8] |
| South Korea smart-farm target | 35% of about 55,000 ha of greenhouses by 2029 | Automated dosing lines need biostimulants with fixed injector rates. | [6] |
| Yara biostimulant trials | 7.5% average yield gain; positive results in 74% of 359 data points | Published trial results help suppliers gain approval for grower trials. | [3] |
| Japan greenhouse base | About 37,000 ha of glass and plastic houses in 2024 | Japanese hydroponic feed sales draw on a wide covered crop base. | [11] |
| Japan biostimulant labeling guideline | Issued 30 May 2025 | Suppliers in Japan need test data behind each labeled effect. | [15] |
| EU fertilising products regulation | Applies from 16 July 2022 | CE-marked biostimulants in the EU are sold on proven crop effects. | [12] |
Table 3: Protected Cultivation Base Benchmarks for the Greenhouse Biostimulants Market (hectares, tonnes and mixed currencies), 2024-2029, mixed years
| Indicator | Value | Source |
|---|---|---|
| Global greenhouse biostimulants market, 2026 | USD 191.4 million | Future Market Insights |
| Added market value, 2026-2036 | USD 413.8 million (3.2x) | Future Market Insights |
| South Korea greenhouse area | About 55,000 ha | [6] |
| South Korea smart-farm conversion goal by 2029 | 35% of about 55,000 ha | [6] |
| Japan glass and plastic house area, 2024 | About 37,000 ha | [11] |
| Netherlands greenhouse vegetable area, 2025 | 5,760 ha | [10] |
| Canada greenhouse area, 2025 | 35.9 million m² (up 1.4%) | [8] |
| Germany protected vegetable area, 2025 | 1,250 ha | [7] |
| UK protected vegetable area, 2025 | 866 ha | [4] |
| UK protected lettuce area, 2025 | 458 ha (up 6.1%) | [4] |
| Germany protected vegetable output, 2025 | 219,200 t (up 4.3%) | [7] |
| UK protected vegetable value, 2025 | £431 million (down 1.1%) | [4] |
Analyst Perspective
“Greenhouse growers will buy more biostimulants once a product raises yield on the grower's own trial block and runs cleanly through existing dosing lines. Clear dose rates for each substrate, written for automatic injectors, are set to settle which brands stay in the feed program over the next decade.”
- Nikhil Kaitwade, Principal Consultant, Future Market Insights.
How is the greenhouse biostimulants market segmented?
Greenhouse biostimulants are analysed by product type, crop, system, grower type, sales channel and region. Shares for 2026 put complete A/B nutrient systems at 36.7%, leafy greens and herbs at 42.3%, drip substrate at 43.5%, commercial greenhouses at 48.3% and greenhouse suppliers at 41.5%.
By product type: complete A/B nutrient systems, single-element additives, biological additives, pH & compatibility aids, and others.
By crop: leafy greens & herbs, tomatoes & vine crops, berries, ornamentals, and others.
By system: drip substrate (cocopeat / rockwool), NFT / DWC recirculating, aeroponics, and others.
By grower type: commercial greenhouses, vertical farms, small commercial & hobby, and others.
By sales channel: greenhouse suppliers, hydro specialty retail, online / direct, distributors, and others.
By region: North America, Latin America, Western Europe, Eastern Europe, East Asia, South Asia and Pacific, and Middle East and Africa.
Why do complete A/B nutrient systems hold the top product type share?
Two-part base feeds give complete A/B nutrient systems a projected 36.7% of product type sales in 2026.
Table 4: Product Type Share for the Greenhouse Biostimulants Market (percentage share), 2026
| Product Type | Share (2026) |
|---|---|
| Complete A/B Nutrient Systems | 36.7% |
| Other Segments Combined | 63.3% |
| Total | 100% |
Table 5: Product Type Leadership and Market Growth for the Greenhouse Biostimulants Market (segment and CAGR percentage), 2026 to 2036
| Metric | Value |
|---|---|
| Global CAGR (2026 to 2036) | 12.2% |
| Leading Segment | Complete A/B Nutrient Systems |
Complete A/B nutrient systems, the base feed programs sold alongside biostimulants, control 36.7% of product type revenue in 2026, FMI finds. Glasshouse growers want one base recipe that stays stable through each crop cycle. Haifa advises growers to keep calcium and magnesium fertilizers in a separate tank from phosphorus and sulfur fertilizers so that no solids form [16]. Biological additives made from seaweed extracts and microbes are bought on top of this base as root and stress products. In September 2022, Masterblend published a guide for mixing the Tomato formula with Epsom salt and calcium nitrate, giving small growers a set three-part routine [17]. Single-element additives and pH aids stay smaller, as these products only fill gaps in the base recipe. Two-part base feeds will stay first through 2036, and biological additives are set to gain as automatic dosing makes extra products easier to run.
- Complete A/B nutrient systems take 36.7% of 2026 sales, as commercial growers keep one base recipe and add targeted products on top.
- Growers adding a biostimulant to an A/B program should first check which stock tank suits the product.
What puts leafy greens and herbs first in crop demand?
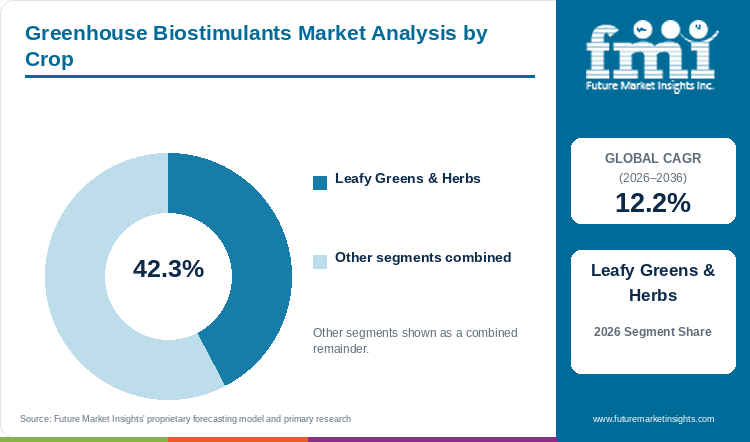
Short harvest cycles give leafy greens and herbs an estimated 42.3% of crop sales in 2026.
Leafy greens and herbs hold 42.3% of crop sales in 2026, as growers harvest within weeks and spot tip burn or pale leaves at once. Demand for hydroponic nutrients for lettuce and herbs moves fast in this short-cycle group. In April 2026, Statistics Canada reported that harvested greenhouse lettuce area rose 8.1% in 2025 to 414.1 thousand square metres [8]. UK protected lettuce area also grew 6.1% to 458 hectares in 2025 on orders from sandwich makers [4]. Tomatoes and vine crops use more product per hectare, yet longer cycles give growers fewer chances to test a change. Leafy greens and herbs will hold first place through 2036, as each short cycle turns a good trial into repeat orders.
- Growers see the effect of a feed change within weeks, which gives leafy greens and herbs a 42.3% share in 2026.
- Salad growers can compare a treated and an untreated bench inside one harvest cycle. Quick bench checks are expected to turn more salad trials into volume orders through 2036.
Why do drip substrate systems on cocopeat and rockwool take the largest system share?
Zone-level control of feed strength and pH gives drip substrate on cocopeat and rockwool 43.5% of system sales in 2026.
Drip substrate on cocopeat and rockwool accounts for 43.5% of system sales in 2026, FMI data shows, owing to zone-level control of nutrient strength (EC) and pH. CANNA gives growth-stage dose rates for the seaweed-based Rhizotonic root product [18]. Adoption of biostimulants is slower on NFT and DWC recirculating hydroponics, as all plants share one nutrient solution and any build-up affects the whole crop. In February 2026, Netafim added self-learning dosing control and EC and pH stabilisation to a fertigation range for protected crops [19]. Drip substrate should remain the main route for biostimulant use through 2036, as growers can test a new additive on one zone without risk to the whole house.
- Drip substrate holds 43.5% of system sales in 2026. Netafim added EC and pH stabilisation to a fertigation range for protected crops in February 2026 [19].
- A new root product can be trialled on one drip zone first, keeping risk away from other zones of the crop.
What gives commercial greenhouses the largest grower type share?
Formal block trials and repeat crop cycles give commercial greenhouses an expected 48.3% of grower type sales in 2026.
As per FMI, commercial greenhouses account for 48.3% of grower type sales in 2026, as head growers test a product on one block and compare yield. In December 2024, ICL secured ongoing access to the Plantarray plant-testing system at Hebrew University research greenhouses to speed up testing of new biostimulants [20]. Vertical farming operations also buy after trials, though on a smaller growing area. Small commercial and hobby growers buy small packs in shops and online, so volumes there stay low. Large sites will continue to lead grower type sales through 2036, as one passed trial becomes a standing order for every house on the site.
- Commercial greenhouses represent a 48.3% share in 2026 and will keep the lead as passed block trials become site-wide orders.
- Suppliers selling to large sites need trial plans with an untreated control block and a clear yield measure.
Why do specialist greenhouse suppliers carry the most channel sales?
Water-test and mixing advice helps greenhouse suppliers handle a projected 41.5% of channel sales in 2026.
Greenhouse suppliers carry 41.5% of channel sales in 2026, as each order comes with advice on water tests, mixing order and injector settings. In February 2026, Griffin Greenhouse Supplies was appointed U.S. distributor for the Netherlands-based Biota Nutri range of fertilizers and biostimulants [5]. Sales of biostimulant products for plants through specialist suppliers are widening as more European brands enter this route. Hydro specialty retail and online stores serve small bottle orders from hobby growers. General distributors keep a share with growers farming both open fields and greenhouses. Specialist suppliers are expected to add more biostimulant brands through 2036, as growers want technical help with each new product.
- Greenhouse suppliers take a 41.5% share in 2026, with technical advice built into each order.
- Growers want help matching a product to water and substrate, so suppliers stocking several biostimulant brands gain more orders.
What are the drivers, restraints, and opportunities in the greenhouse biostimulants market?
Growers chasing more saleable yield per covered hectare drive the market, thin dose advice for soilless systems slows repeat orders, and automated fertigation recipes open the widest path for sales.
- Driver: Demand for greenhouse biostimulants is driven by protected growers seeking more marketable yield and steadier quality from the same covered area.
- Restraint: Top challenges faced by greenhouse biostimulants market players include unclear dose rates and mixing steps for hydroponic and substrate systems. Many growers stop after a first trial when test results for the grower's own system are missing.
- Opportunity: Key opportunities in the greenhouse biostimulants market include tested doses built into automated fertigation recipes. Smart-farm houses are expected to favour suppliers selling these doses with advisory support through 2036.
Yield per Covered Hectare Lifts Orders
Sales of greenhouse biostimulants are rising as growers seek more produce from existing glasshouses. In August 2025, HortiDaily reported CBS figures putting Dutch greenhouse vegetable area at 5,760 hectares, with tomatoes up 180 hectares [10]. Higher crop value per square metre makes a weak harvest costly, so growers pay for root and stress products protecting output. Yara said in November 2023 that the Yara biostimulant portfolio had grown at a compound annual rate above 50% since 2018 [3]. As FMI observes, adoption of biostimulants for crops grown under cover will rise with each new high-value glasshouse crop through 2036.
Dose Gaps Slow Repeat Orders
Many growers stop after one trial, as dose rates and mixing steps for hydroponic and substrate systems are still unclear. An April 2026 review in Agronomy named missing dose guidelines for hydroponic crops as a key challenge [2]. Label rules add more work, and COMPO EXPERT noted in June 2025 that EU biostimulants need external conformity checks before CE marking [13]. Japan issued the first national biostimulant labeling guideline in May 2025, so suppliers there are rewriting effect claims [15]. Unclear dose advice may slow the move from first trial to standing order in smaller greenhouses.
Automated Fertigation Recipes Open New Orders
Automatic dosing lets suppliers build a biostimulant into the feed recipe running every day. In February 2025, South Korea set a plan to turn 35% of about 55,000 hectares of greenhouses into smart farms by 2029 [6]. Makers of humic and fulvic acid based biostimulants can gain orders by publishing rates suited to these dosing lines. Smart-farm houses feed crops through injectors, so products with fixed rates and clean mixing are easier to approve. Suppliers with products running cleanly through injectors are expected to gain standing orders over the forecast period.
Which country CAGRs are profiled in the greenhouse biostimulants market?
South Korea posts the highest greenhouse biostimulants CAGR among profiled countries, at 11.8% for 2026 to 2036, and Japan the lowest at 10%. None of the five matches the 12.2% global rate over the same period. Growers in all five buy once a product works on the grower's own crop and runs cleanly through automated fertigation lines.
Table 6: Country CAGRs and Primary Growth Levers for the Greenhouse Biostimulants Market (CAGR percentage), 2026 to 2036
| Country | CAGR (2026-2036) | Primary Growth Lever |
|---|---|---|
| South Korea | 11.8% | Dosing-ready products for smart-farm greenhouses |
| Germany | 11.5% | More tonnes from each heated hectare |
| USA | 11.2% | Clearer label rules across states |
| UK | 10.7% | Trial results on protected lettuce |
| Japan | 10% | Effect claims rewritten to MAFF rules |
Source: Future Market Insights
South Korea Greenhouse Biostimulants Market Outlook (2026-2036)
MAFRA plans to turn 35% of South Korea's roughly 55,000 hectares of greenhouses into smart farms by 2029 [6]. Smart-farm houses feed crops through automatic dosing, so growers there want biostimulants with fixed injector rates. FMI forecasts Korean greenhouse biostimulant sales to rise at an 11.8% CAGR through 2036, faster than in Germany, the USA, the UK or Japan. Strawberry exports earned USD 72 million in 2025, up 4% on 2024, and MAFRA is promoting local varieties such as Honghee and Gold Berry abroad [21].
Key takeaway: Fixed dose rates for automatic injectors are the main selling point for Korean smart-farm houses.
Germany Greenhouse Biostimulants Market Outlook (2026-2036)
German greenhouse growers face higher carbon costs on heating fuels under the EU ETS2 emissions trading system. In February 2025, Zentralverband Gartenbau put the extra cost for a 10-hectare tomato and cucumber farm at about EUR 103,000 at EUR 55 per tonne of CO2 [22]. Higher heating bills push growers to get more saleable produce from every heated square metre. Destatis counted 219,200 tonnes of protected vegetables in 2025, up 4.3% on area that grew only 0.8% [7]. Germany ranks second at an 11.5% CAGR through 2036. Sales of CE-marked biostimulants under Regulation (EU) 2019/1009 will favour products that pass the external conformity checks COMPO EXPERT described in 2025 [12] [13].
Key takeaway: German buyers will reward products raising output per heated hectare as fuel costs increase.
USA Greenhouse Biostimulants Market Outlook (2026-2036)
Food crops under protection earned US growers USD 1.01 billion in 2024, up 44% on the previous census [1]. Label rules are the main brake on faster sales in the country. California has allowed plant biostimulant claims only since January 2025, and only for products based on humic acid, seaweed extract or kelp extract [9]. A House bill introduced in June 2025, the Plant Biostimulant Act, proposes a single national definition [14]. Griffin Greenhouse Supplies began carrying the Biota Nutri range for US growers in 2026 [5]. US sales of greenhouse biostimulants are forecast to rise at an 11.2% CAGR through 2036.
Key takeaway: One federal definition would let suppliers sell the same biostimulant label in every state.
UK Greenhouse Biostimulants Market Outlook (2026-2036)
UK growers judge every input by payback after protected vegetable value fell 1.1% to £431 million in 2025 [4]. UK growth is projected at a 10.7% CAGR through 2036, ahead of Japan only. Protected lettuce is the growth crop, with area up 6.1% to 458 hectares on orders from sandwich makers [4]. Defra's March 2026 consultation on new fertiliser rules notes that the UK has no dedicated rules for plant biostimulants yet [23].
Key takeaway: Salad growers supplying sandwich makers are the first UK buyers for suppliers to target.
Japan Greenhouse Biostimulants Market Outlook (2026-2036)
MAFF issued Japan's first biostimulant labeling guideline on 30 May 2025, asking sellers to check the basis for each effect claim and the safety of each product [15]. Japan's 10% CAGR through 2036 is the lowest in this group, as suppliers rework labels to the new guideline. The country has about 37,000 hectares of glass and plastic houses [11]. MAFF's MIDORI strategy targets a 30% cut in chemical fertilizer use by 2050 [24], so growers will need products helping crops absorb more of each feed. The Smart Agriculture Technology Utilization Promotion Act, in force since 1 October 2024, is spreading sensor-based growing suited to tested doses [25].
Key takeaway: Early labels written to the MAFF guideline will give suppliers a head start in Japanese greenhouses.
Who are the notable companies in the greenhouse biostimulants market?
Canna, J.R. Peters (Jack's), Masterblend, Netafim (Orbia), Compo Expert, Haifa Group, Yara International and ICL Group make up the supplier group covered in this report.
Greenhouse biostimulants competition is moderately fragmented, as hydroponic recipe brands, specialty nutrition groups and fertigation suppliers each hold a different part of the grower's feed program. Canna, J.R. Peters and Masterblend sell feeds and additives for indoor and greenhouse growers, such as Jack's Nutrients [26]. Haifa Group and ICL Group add dedicated biostimulant ranges to specialty fertilizers, and Haifa serves growers in more than 100 countries through 19 subsidiaries [27]. Compo Expert and Yara International fold biostimulants into wide crop nutrition portfolios, and Netafim shapes product choice through dosing systems. Several suppliers are joining industry councils and funding crop tests to gain more commercial greenhouse accounts.
- Hydroponic recipe specialists: Canna, J.R. Peters (Jack's) and Masterblend sell soluble feed programs and additives for controlled-environment growers.
- Biostimulant-led specialty nutrition: Haifa Group and ICL Group both add dedicated biostimulant ranges to specialty fertilizer businesses.
- Crop nutrition and fertigation integrators: Compo Expert and Yara International fold biostimulants into wide crop nutrition portfolios. Netafim (Orbia) shapes product choice through dosing systems for greenhouses.
Competitive Benchmarking: Greenhouse Biostimulants Market
Table 7: Competitive Benchmarking for the Greenhouse Biostimulants Market (qualitative capability ratings), 2026
| Company | Feed Recipes | Biostimulant Range | Dosing Fit | Reach |
|---|---|---|---|---|
| Canna | High | High | High | Medium |
| J.R. Peters (Jack's) | High | Low | High | Medium |
| Masterblend | High | Low | High | Medium |
| Netafim (Orbia) | Medium | Low | High | High |
| Compo Expert | Medium | High | Medium | High |
| Haifa Group | Medium | High | High | High |
| Yara International | Medium | High | High | High |
| ICL Group | Medium | High | High | High |
High stands for wide capability in greenhouse feed or dosing programs, Medium for a narrower role, and Low for limited public documentation.
Key Developments in the Greenhouse Biostimulants Market
- In April 2026, Haifa Group joined the European Biostimulants Industry Council, linking the step to regulatory work and product development [27].
- In February 2026, Netafim (Orbia) launched the Dosing 5G fertigation range with self-learning dosing and remote management, as growers want steady EC and pH with less manual calibration [19].
- ICL reported 2025 Growing Solutions sales of USD 2,063 million in February 2026, up from USD 1,950 million in 2024 [28]. The Growing Solutions segment also includes the ICL biostimulant range.
- Yara International launched YaraAmplix as a global biostimulant brand in November 2023, with the rollout starting in China, Brazil and France [3].
Key Players in the Greenhouse Biostimulants Market
Hydroponic Recipe Specialists
- CANNA
- J.R. Peters, Inc. (Jack's)
- Masterblend International
Biostimulant-Led Specialty Nutrition
- Haifa Group
- ICL Group Ltd.
Global Crop Nutrition and Fertigation Integration
- COMPO EXPERT GmbH
- Yara International ASA
- Netafim Ltd. (Orbia)
Greenhouse Biostimulants Market - Report Scope
Table 8: Report Scope for the Greenhouse Biostimulants Market (coverage fields and definitions), 2026 to 2036
| Coverage field | Report scope |
|---|---|
| Market breakdown | Product type; crop; system; grower type; sales channel; region |
| Quantitative units | USD million |
| Market definition | First-sale revenue from plant biostimulants used in protected cultivation, together with the complete A/B nutrient programs, single-element additives and pH aids sold alongside them in greenhouse feed programs. Biostimulants are products applied for effects on nutrient use efficiency, stress tolerance or crop quality. Greenhouse structures, dosing hardware, separately sold growing media, crop-protection products, harvested produce and fertilizers used outside greenhouses are excluded. |
| Regions covered | North America; Latin America; Western Europe; Eastern Europe; East Asia; South Asia and Pacific; Middle East and Africa |
| Countries covered | South Korea; Germany; USA; UK; Japan |
| Key companies profiled | Canna, J.R. Peters (Jack's), Masterblend, Netafim (Orbia), Compo Expert, Haifa Group, Yara International, ICL Group |
| Forecast period | 2026 to 2036 |
| Approach | Bottom-up sizing by product type, crop, system and sales channel, reconciled top-down with protected crop area, crop output and supplier activity in each profiled country. |
Greenhouse Biostimulants Market - Research Methodology
Table 9: Research Methodology for the Greenhouse Biostimulants Market (research methods and approach), 2026 edition
| Method | Approach |
|---|---|
| Primary Research | Primary research includes interviews with biostimulant and fertilizer manufacturers, greenhouse suppliers, agronomists and head growers. Interviews cover dose rates, mixing practice, pack prices, trial methods and reorder criteria. |
| Desk Research | Desk research covers national horticulture statistics, fertilizer and biostimulant rules, peer-reviewed hydroponic studies, company releases and horticulture trade press. |
| Market Sizing and Forecasting | Market sizing combines the 2025 base value, segment shares, product prices per litre or kilogram, protected crop area, crop output trends and grower buying patterns in the five profiled countries. |
| Data Validation | Market estimates are checked against company disclosures, official crop statistics and primary research findings. Fertilizers used outside greenhouses, dosing hardware and harvested produce are excluded to avoid double counting. |
Greenhouse Biostimulants Market by Segments
Greenhouse Biostimulants Market segmented by Product Type:
- Complete A/B Nutrient Systems
- Single-Element Additives
- Biological Additives
- pH & Compatibility Aids
- Others
Greenhouse Biostimulants Market segmented by Crop:
- Leafy Greens & Herbs
- Tomatoes & Vine Crops
- Berries
- Ornamentals
- Others
Greenhouse Biostimulants Market segmented by System:
- Drip Substrate (Cocopeat / Rockwool)
- NFT / DWC Recirculating
- Aeroponics
- Others
Greenhouse Biostimulants Market segmented by Grower Type:
- Commercial Greenhouses
- Vertical Farms
- Small Commercial & Hobby
- Others
Greenhouse Biostimulants Market segmented by Sales Channel:
- Greenhouse Suppliers
- Hydro Specialty Retail
- Online / Direct
- Distributors
- Others
Greenhouse Biostimulants Market by Region
- North America
- United States
- Canada
- Latin America
- Brazil
- Mexico
- Argentina
- Chile
- Western Europe
- Germany
- France
- United Kingdom
- Italy
- Spain
- Benelux
- Nordics
- Eastern Europe
- Poland
- Czech Republic
- Romania
- Hungary
- East Asia
- Japan
- South Korea
- South Asia and Pacific
- ASEAN
- Australia and New Zealand
- Middle East and Africa
- GCC Countries
- South Africa
- Türkiye
- Israel
Research Sources and Bibliography
- [1] USDA National Agricultural Statistics Service. (2026, February 26). U.S. Horticulture Operations Report $18.3 Billion in Sales.https://data.nass.usda.gov/Newsroom/2026/02-26-2026.php
- [2] Wu, G., Li, T., Niu, G., Barickman, T. C., Masabni, J., and Zhang, Q. (Agronomy, MDPI). (2026, April 17). How Novel Biostimulants Enhance Resilience and Quality in Hydroponic Crop Production-A Review.https://www.mdpi.com/2073-4395/16/8/827
- [3] Yara International ASA. (2023, November 29). Yara helps farmers combat the effects of climate change and improve nutrient use efficiency.https://www.yara.com/corporate-releases/yara-helps-farmers-combat-the-effects-of-climate-change-and-improve-nutrient-use-efficiency/
- [4] Department for Environment, Food & Rural Affairs. (2026, June 25). Horticulture statistics 2025.https://www.gov.uk/government/statistics/latest-horticulture-statistics/horticulture-statistics-2025
- [5] HortiDaily. (2026, February 13). Griffin Greenhouse Supplies appointed U.S. distributor for Biota Nutri fertilizers and biostimulants.https://www.hortidaily.com/article/9810912/griffin-greenhouse-supplies-appointed-u-s-distributor-for-biota-nutri-fertilizers-and-biostimulants/
- [6] Ministry of Agriculture, Food and Rural Affairs of South Korea. (2025, February 27). S. Korea's First Master Plan for Promotion of the Growth of the Smart-Farming Industry for the Years 2025-2029.https://www.mafra.go.kr/bbs/english/25/573412/artclView.do
- [7] Statistisches Bundesamt (Destatis). (2026, February 26). Gemüseernte erreicht 2025 neuen Höchststand (Press Release No. 065).https://www.destatis.de/DE/Presse/Pressemitteilungen/2026/02/PD26_065_412.html
- [8] Statistics Canada. (2026, April 22). Greenhouse, sod and nursery industries, 2025.https://www150.statcan.gc.ca/n1/daily-quotidien/260422/dq260422c-eng.htm
- [9] California Department of Food and Agriculture. (2024, December 11). Beneficial Substance Labeling Format & Plant Biostimulant Label Claims (Notice to Industry).https://www.cdfa.ca.gov/is/ffldrs/docs/fertilizer/notice_to_industry-beneficial_substances_plant_biostimulants-final-12-11-24.pdf
- [10] HortiDaily (reporting Statistics Netherlands, CBS). (2025, August 13). Sharp increase in Dutch tomato and pepper acreage.https://www.hortidaily.com/article/9747782/sharp-increase-in-dutch-tomato-and-pepper-acreage
- [11] Ministry of Agriculture, Forestry and Fisheries of Japan. (n.d.; survey year 2024).(R6) (Status of horticultural facility installation, 2024).https://www.maff.go.jp/j/seisan/ryutu/engei/sisetsu/haipura/setti_6.html
- [12] European Parliament and Council of the European Union. (2019, June 5). Regulation (EU) 2019/1009 laying down rules on the making available on the market of EU fertilising products.https://eur-lex.europa.eu/legal-content/EN/TXT/HTML/?uri=CELEX:32019R1009
- [13] COMPO EXPERT. (2025, June 13). COMPO EXPERT at EBIC Summit 2025.https://compo-expert.com/news/company/compo-expert-ebic-summit-2025
- [14] U.S. House of Representatives (119th Congress). (2025, June 5). H.R. 3783, Plant Biostimulant Act of 2025 (Introduced in House).https://www.govinfo.gov/content/pkg/BILLS-119hr3783ih/html/BILLS-119hr3783ih.htm
- [15] Ministry of Agriculture, Forestry and Fisheries of Japan. (2025, May 30). (Biostimulant labeling guideline formulated).https://www.maff.go.jp/j/press/syouan/nouan/250530.html
- [16] Haifa Group. (n.d.; accessed 2026, October). How to prepare fertilizer solutions in a two-tank system.https://www.haifa-group.com/how-prepare-fertilizer-solutions-two-tank-system
- [17] Masterblend International. (2022, September 29). A Handy Guide for Mixing the Masterblend Tomato Formula.https://www.masterblend.com/tomato-formula-mxing-guide/
- [18] CANNA. (n.d.; accessed 2026, October). CANNA RHIZOTONIC - The Boost for your Plants Roots.https://other.canna.com/rhizotonic
- [19] Netafim (Orbia). (2026, February 17). Orbia Netafim Supercharges Precision Fertigation with AI-Powered Dosing 5G Product Range.https://www.netafim.com/en/news-and-events/announcements/orbia-netafim-supercharges-precision-fertigation-with-ai-powered-dosing-5g-product-range/
- [20] ICL Growing Solutions. (2024, December 10). Speeding up the Development of ICL Biostimulants Through Partnership.https://icl-growingsolutions.com/agriculture/news-and-events/speeding-up-the-development-of-icl-biostimulants-through-partnership/
- [21] FreshPlaza (reporting the Ministry of Agriculture, Food and Rural Affairs of South Korea). (2026, April 7). South Korea expands support for new fruit and vegetable exports.https://www.freshplaza.com/north-america/article/9826611/south-korea-expands-support-for-new-fruit-and-vegetable-exports/
- [22] top agrar (reporting Zentralverband Gartenbau e.V.). (2025, February 28). Die Folgen von CO₂-Bepreisung, ETS2 und Carbon Leakage im geschützten Anbau.https://www.topagrar.com/betriebsleitung/news/folgen-von-co2-bepreisung-ets2-und-hohen-energiepreisen-im-geschutzten-anbau-20011785.html
- [23] Department for Environment, Food & Rural Affairs, Scottish Government, Welsh Government and Northern Ireland Executive. (2026, March 19). UK fertilisers: regulatory reform (consultation and call for evidence).https://consult.defra.gov.uk/fertilisers-team/uk-fertilisers-regulatory-reform/supporting_documents/final-fertilisers-english-2026pdf
- [24] Ministry of Agriculture, Forestry and Fisheries of Japan. (n.d.; accessed 2026, October). MIDORI Strategy for Sustainable Food Systems.https://www.maff.go.jp/e/policies/env/env_policy/midori.html
- [25] Ministry of Agriculture, Forestry and Fisheries of Japan. (2024, June 14). (Smart Agriculture Technology Utilization Promotion Act).https://www.maff.go.jp/j/kanbo/smart/houritsu.html
- [26] J.R. Peters, Inc. (n.d.; accessed 2026, October). Our Fertilizer Company.https://www.jrpeters.com/our-company
- [27] Haifa Group. (2026, April 2). Haifa Group Joins the European Biostimulants Industry Council.https://www.haifa-group.com/news/haifa-joins-ebic
- [28] ICL Group Ltd. (via Business Wire). (2026, February 17). ICL Reports Fourth Quarter and Full Year 2025 Results.https://www.businesswire.com/news/home/20260217956054/en/icl-reports-fourth-quarter-and-full-year-2025-results/
This bibliography is provided for reader reference. The full report contains the complete reference list and detailed citations.
This Report Answers
- What is the greenhouse biostimulants market worth in 2026, and what value will sales reach by 2036?
- Which product type holds the largest share of demand for greenhouse biostimulants?
- What crop and system shares do leafy greens, tomatoes, drip substrate and recirculating set-ups hold?
- Which profiled countries grow fastest for greenhouse biostimulants, and which grows slowest?
- What effect do EU, USA and Japan label rules have on biostimulant claims and first purchases?
- Which crop nutrition and fertigation companies lead, and in which segments does each one compete?
Frequently Asked Questions
How large is the greenhouse biostimulants market expected in 2026?
According to FMI, greenhouse biostimulant sales stand at USD 191.4 million in 2026, against USD 170.6 million in 2025. The market will be worth USD 605.2 million by 2036 as more growers add root and stress products to feed programs.
What CAGR is projected for the greenhouse biostimulants market through 2036?
A 12.2% CAGR is projected by FMI for greenhouse biostimulants over 2026 to 2036. Tested products built into automatic dosing recipes will add much of this value.
Which product type holds a notable market share in 2026?
Complete A/B nutrient systems lead product type with 36.7% in 2026. Growers will keep a two-part base feed and add biostimulants on top of the base.
Which crop leads greenhouse biostimulant use in 2026?
Leafy greens and herbs account for 42.3% of crop sales in 2026. Short harvest cycles will let salad growers judge a product within weeks.
Which country has a notable expansion outlook through 2036?
South Korea will grow fastest among profiled countries, with greenhouse biostimulant sales rising at an 11.8% CAGR from 2026 to 2036. Smart-farm conversion of greenhouses will raise orders for products with fixed injector rates.
Who are the key companies in the greenhouse biostimulants market?
The profiled companies are Canna, J.R. Peters (Jack's), Masterblend, Netafim (Orbia), Compo Expert, Haifa Group, Yara International and ICL Group. The group covers hydroponic feed recipes, dedicated biostimulant ranges and fertigation dosing.
Preview the report firsthand - request a free sample
Get SampleGet the brochure for pricing and purchase details.
Get PDFTable of Content
- Key Takeaways
- Market Size and CAGR
- Top Growth Driver
- Fastest Growing Segment
- Leading Region
- Key Companies
- Emerging Opportunities
- Executive Summary
- Global Market Outlook
- Demand-side Trends
- Supply-side Trends
- Technology Roadmap Analysis
- Analysis and Recommendations
- Analyst Perspective (What is happening? Why now? What should investors know?)
- Key Questions Answered
- How large is the market?
- What is the CAGR?
- What are key trends?
- Which region dominates?
- Who are the leaders?
- Market Overview
- Market Coverage / Taxonomy
- Market Definition / Scope / Limitations
- Research Methodology
- Chapter Orientation
- Analytical Lens and Working Hypotheses
- Market Structure, Signals, and Trend Drivers
- Benchmarking and Cross-market Comparability
- Market Sizing, Forecasting, and Opportunity Mapping
- Research Design and Evidence Framework
- Desk Research Programme (Secondary Evidence)
- Expert Input and Fieldwork (Primary Evidence)
- Tooling, Models, and Reference Databases
- Data Engineering and Model Build
- Quality Assurance and Audit Trail
- Market Background
- Market Dynamics (Drivers, Restraints, Opportunity, Trends)
- Scenario Forecast (Optimistic, Likely, Conservative)
- Impact Analysis
- AI Impact
- Sustainability Impact
- Regulatory Impact
- Technology Impact
- Consumer / Buyer Analysis
- Purchase Drivers
- Adoption Barriers
- Buyer Journey
- Opportunity Map Analysis
- Product Life Cycle Analysis
- Supply Chain Analysis
- Investment Feasibility Matrix
- Value Chain Analysis
- PESTLE and Porter's Analysis
- Regulatory Landscape
- Regional Parent Market Outlook
- Production and Consumption Statistics
- Import and Export Statistics
- Global Market Analysis and Forecast, 2021 to 2036
- Historical Market Size Value (USD Million) Analysis, 2021 to 2025
- Current and Future Market Size Value (USD Million) Projections, 2026 to 2036
- Y-o-Y Growth Trend Analysis
- Absolute $ Opportunity Analysis
- Global Market Pricing Analysis, 2021 to 2036
- Global Market Analysis and Forecast, By Product Type, 2021 to 2036
- Introduction / Key Findings
- Historical Market Size Value (USD Million) Analysis By Product Type, 2021 to 2025
- Current and Future Market Size Value (USD Million) Analysis and Forecast By Product Type, 2026 to 2036
- Complete A/B Nutrient Systems
- Single-Element Additives
- Biological Additives
- pH & Compatibility Aids
- Others
- Y-o-Y Growth Trend Analysis By Product Type, 2021 to 2025
- Absolute $ Opportunity Analysis By Product Type, 2026 to 2036
- Global Market Analysis and Forecast, By Crop, 2021 to 2036
- Introduction / Key Findings
- Historical Market Size Value (USD Million) Analysis By Crop, 2021 to 2025
- Current and Future Market Size Value (USD Million) Analysis and Forecast By Crop, 2026 to 2036
- Leafy Greens & Herbs
- Tomatoes & Vine Crops
- Berries
- Ornamentals
- Others
- Y-o-Y Growth Trend Analysis By Crop, 2021 to 2025
- Absolute $ Opportunity Analysis By Crop, 2026 to 2036
- Global Market Analysis and Forecast, By System, 2021 to 2036
- Introduction / Key Findings
- Historical Market Size Value (USD Million) Analysis By System, 2021 to 2025
- Current and Future Market Size Value (USD Million) Analysis and Forecast By System, 2026 to 2036
- Drip Substrate (Cocopeat / Rockwool)
- NFT / DWC Recirculating
- Aeroponics
- Others
- Y-o-Y Growth Trend Analysis By System, 2021 to 2025
- Absolute $ Opportunity Analysis By System, 2026 to 2036
- Global Market Analysis and Forecast, By Grower Type, 2021 to 2036
- Introduction / Key Findings
- Historical Market Size Value (USD Million) Analysis By Grower Type, 2021 to 2025
- Current and Future Market Size Value (USD Million) Analysis and Forecast By Grower Type, 2026 to 2036
- Commercial Greenhouses
- Vertical Farms
- Small Commercial & Hobby
- Others
- Y-o-Y Growth Trend Analysis By Grower Type, 2021 to 2025
- Absolute $ Opportunity Analysis By Grower Type, 2026 to 2036
- Global Market Analysis and Forecast, By Sales Channel, 2021 to 2036
- Introduction / Key Findings
- Historical Market Size Value (USD Million) Analysis By Sales Channel, 2021 to 2025
- Current and Future Market Size Value (USD Million) Analysis and Forecast By Sales Channel, 2026 to 2036
- Greenhouse Suppliers
- Hydro Specialty Retail
- Online / Direct
- Distributors
- Others
- Y-o-Y Growth Trend Analysis By Sales Channel, 2021 to 2025
- Absolute $ Opportunity Analysis By Sales Channel, 2026 to 2036
- Global Market Analysis and Forecast, By Region, 2021 to 2036
- Introduction
- Historical Market Size Value (USD Million) Analysis By Region, 2021 to 2025
- Current Market Size Value (USD Million) Analysis and Forecast By Region, 2026 to 2036
- North America
- Latin America
- Western Europe
- Eastern Europe
- East Asia
- South Asia and Pacific
- Middle East and Africa
- Market Attractiveness Analysis By Region
- North America Market Analysis and Forecast, By Country, 2021 to 2036
- Historical Market Size Value (USD Million) Trend Analysis By Market Taxonomy, 2021 to 2025
- Market Size Value (USD Million) Forecast By Market Taxonomy, 2026 to 2036
- By Country
- United States
- Canada
- By Product Type
- By Crop
- By System
- By Grower Type
- By Sales Channel
- By Country
- Market Attractiveness Analysis
- By Country
- By Product Type
- By Crop
- By System
- By Grower Type
- By Sales Channel
- Key Takeaways
- Latin America Market Analysis and Forecast, By Country
- Historical Market Size Value (USD Million) Trend Analysis By Market Taxonomy, 2021 to 2025
- Market Size Value (USD Million) Forecast By Market Taxonomy, 2026 to 2036
- By Country
- Brazil
- Mexico
- Argentina
- Chile
- By Product Type
- By Crop
- By System
- By Grower Type
- By Sales Channel
- By Country
- Market Attractiveness Analysis
- By Country
- By Product Type
- By Crop
- By System
- By Grower Type
- By Sales Channel
- Key Takeaways
- Western Europe Market Analysis and Forecast, By Country
- Historical Market Size Value (USD Million) Trend Analysis By Market Taxonomy, 2021 to 2025
- Market Size Value (USD Million) Forecast By Market Taxonomy, 2026 to 2036
- By Country
- Germany
- France
- United Kingdom
- Italy
- Spain
- Benelux
- Nordics
- By Product Type
- By Crop
- By System
- By Grower Type
- By Sales Channel
- By Country
- Market Attractiveness Analysis
- By Country
- By Product Type
- By Crop
- By System
- By Grower Type
- By Sales Channel
- Key Takeaways
- Eastern Europe Market Analysis and Forecast, By Country
- Historical Market Size Value (USD Million) Trend Analysis By Market Taxonomy, 2021 to 2025
- Market Size Value (USD Million) Forecast By Market Taxonomy, 2026 to 2036
- By Country
- Poland
- Czech Republic
- Romania
- Hungary
- By Product Type
- By Crop
- By System
- By Grower Type
- By Sales Channel
- By Country
- Market Attractiveness Analysis
- By Country
- By Product Type
- By Crop
- By System
- By Grower Type
- By Sales Channel
- Key Takeaways
- East Asia Market Analysis and Forecast, By Country
- Historical Market Size Value (USD Million) Trend Analysis By Market Taxonomy, 2021 to 2025
- Market Size Value (USD Million) Forecast By Market Taxonomy, 2026 to 2036
- By Country
- Japan
- South Korea
- By Product Type
- By Crop
- By System
- By Grower Type
- By Sales Channel
- By Country
- Market Attractiveness Analysis
- By Country
- By Product Type
- By Crop
- By System
- By Grower Type
- By Sales Channel
- Key Takeaways
- South Asia and Pacific Market Analysis and Forecast, By Country
- Historical Market Size Value (USD Million) Trend Analysis By Market Taxonomy, 2021 to 2025
- Market Size Value (USD Million) Forecast By Market Taxonomy, 2026 to 2036
- By Country
- ASEAN
- Australia and New Zealand
- By Product Type
- By Crop
- By System
- By Grower Type
- By Sales Channel
- By Country
- Market Attractiveness Analysis
- By Country
- By Product Type
- By Crop
- By System
- By Grower Type
- By Sales Channel
- Key Takeaways
- Middle East and Africa Market Analysis and Forecast, By Country
- Historical Market Size Value (USD Million) Trend Analysis By Market Taxonomy, 2021 to 2025
- Market Size Value (USD Million) Forecast By Market Taxonomy, 2026 to 2036
- By Country
- GCC Countries
- South Africa
- Türkiye
- Israel
- By Product Type
- By Crop
- By System
- By Grower Type
- By Sales Channel
- By Country
- Market Attractiveness Analysis
- By Country
- By Product Type
- By Crop
- By System
- By Grower Type
- By Sales Channel
- Key Takeaways
- Key Countries Market Analysis
- United States
- Pricing Analysis
- Market Share Analysis, 2025
- By Product Type
- By Crop
- By System
- By Grower Type
- By Sales Channel
- Canada
- Pricing Analysis
- Market Share Analysis, 2025
- By Product Type
- By Crop
- By System
- By Grower Type
- By Sales Channel
- Mexico
- Pricing Analysis
- Market Share Analysis, 2025
- By Product Type
- By Crop
- By System
- By Grower Type
- By Sales Channel
- Brazil
- Pricing Analysis
- Market Share Analysis, 2025
- By Product Type
- By Crop
- By System
- By Grower Type
- By Sales Channel
- Chile
- Pricing Analysis
- Market Share Analysis, 2025
- By Product Type
- By Crop
- By System
- By Grower Type
- By Sales Channel
- Germany
- Pricing Analysis
- Market Share Analysis, 2025
- By Product Type
- By Crop
- By System
- By Grower Type
- By Sales Channel
- United Kingdom
- Pricing Analysis
- Market Share Analysis, 2025
- By Product Type
- By Crop
- By System
- By Grower Type
- By Sales Channel
- Italy
- Pricing Analysis
- Market Share Analysis, 2025
- By Product Type
- By Crop
- By System
- By Grower Type
- By Sales Channel
- Spain
- Pricing Analysis
- Market Share Analysis, 2025
- By Product Type
- By Crop
- By System
- By Grower Type
- By Sales Channel
- France
- Pricing Analysis
- Market Share Analysis, 2025
- By Product Type
- By Crop
- By System
- By Grower Type
- By Sales Channel
- ASEAN
- Pricing Analysis
- Market Share Analysis, 2025
- By Product Type
- By Crop
- By System
- By Grower Type
- By Sales Channel
- Australia and New Zealand
- Pricing Analysis
- Market Share Analysis, 2025
- By Product Type
- By Crop
- By System
- By Grower Type
- By Sales Channel
- Japan
- Pricing Analysis
- Market Share Analysis, 2025
- By Product Type
- By Crop
- By System
- By Grower Type
- By Sales Channel
- South Korea
- Pricing Analysis
- Market Share Analysis, 2025
- By Product Type
- By Crop
- By System
- By Grower Type
- By Sales Channel
- Poland
- Pricing Analysis
- Market Share Analysis, 2025
- By Product Type
- By Crop
- By System
- By Grower Type
- By Sales Channel
- Hungary
- Pricing Analysis
- Market Share Analysis, 2025
- By Product Type
- By Crop
- By System
- By Grower Type
- By Sales Channel
- Türkiye
- Pricing Analysis
- Market Share Analysis, 2025
- By Product Type
- By Crop
- By System
- By Grower Type
- By Sales Channel
- South Africa
- Pricing Analysis
- Market Share Analysis, 2025
- By Product Type
- By Crop
- By System
- By Grower Type
- By Sales Channel
- United States
- Market Structure Analysis
- Competition Dashboard
- Competition Benchmarking
- Market Share Analysis of Top Players
- By Regional
- By Product Type
- By Crop
- By System
- By Grower Type
- By Sales Channel
- Emerging Startups
- Innovation Benchmarking
- Competition Analysis
- Competition Deep Dive
- Canna
- Overview
- Product Portfolio
- Profitability by Market Segments
- Sales Footprint
- Strategy Overview
- Marketing Strategy
- Product Strategy
- Channel Strategy
- J.R. Peters (Jack's)
- Masterblend
- Netafim (Orbia)
- Compo Expert
- Haifa Group
- Yara International
- ICL Group
- J.R. Peters, Inc. (Jack's)
- Masterblend International
- ICL Group Ltd.
- COMPO EXPERT GmbH
- Yara International ASA
- Netafim Ltd. (Orbia)
- Canna
- Case Studies
- Success Stories
- Recent Developments
- Competition Deep Dive
- Assumptions & Acronyms Used


