

- Market Size (2026)
- USD 6200.0 Mn
- Forecast (2036)
- USD 11200.0 Mn
- CAGR (2026 to 2036)
- 6.1%
How big is the Halobutyl Rubber Market in 2026?
USD 6,200.0 million in 2026 and USD 11,200.0 million by 2036 at a 6.1% CAGR.
Demand for halobutyl rubber is projected to expand at 6.1% CAGR between 2026 and 2036, increasing valuation from USD 6,200.0 million in 2026 to USD 11,200.0 million by 2036. Tire innerliner plants use halobutyl grades because air retention affects fuel use, EV range and warranty exposure. USTMA projected in November 2025 that total USA tire shipments would reach 337.4 million units in 2025. The shipment base keeps compound approval tied to tire material demand and makes batch stability a spending trigger for tire makers.
United States and Germany accounts are expected to prioritize halogen content records and tire plant trial history. China and India accounts are projected to emphasize local polymer availability because tire output and EV assembly create faster specification cycles. Technical teams examine Mooney viscosity, cure response and permeability before a grade enters plant files. Procurement teams compare direct delivery proof and change-control files before shifting approved innerliner grades. India's Ministry of Heavy Industries reported in February 2026 that passenger vehicle production reached 5.38 million units during January to December 2025. The production base keeps synthetic rubber accounts close to local tire compounding, so technical service becomes part of the purchase decision.
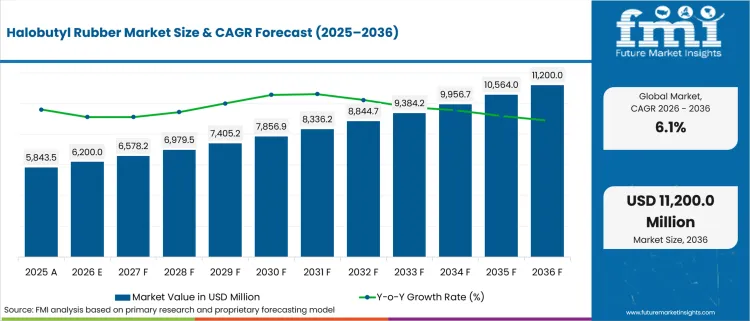
| Metric | Value |
|---|---|
| 2025 Market Size | USD 5,843.5 million |
| 2026 Market Size | USD 6,200.0 million |
| 2036 Market Size | USD 11,200.0 million |
| Forecast CAGR (2026-2036) | 6.1% |
| Sales Channel Focus | Direct Polymer Supply |
| Direct Polymer Supply Share (2026) | 58.5% |
| Product Type Focus | Chlorobutyl Rubber |
| Chlorobutyl Rubber Share (2026) | 38.0% |
| Application Focus | Tire Innerliners |
| Tire Innerliners Share (2026) | 38.0% |
Summary of the Halobutyl Rubber Market
| Market Signal | Commercial Impact |
|---|---|
| Demand and Growth Drivers | Tire air retention, pharmaceutical closure cleanliness and polymer availability are expected to shape demand. Halobutyl rubber earns its place when a plant links specification fit to fewer quality losses.
|
| Product and Segment View | Direct polymer supply, chlorobutyl rubber and tire innerliners are projected to remain the visible screens in 2026. Standard grade demand is expected to stay tied to repeatable compounding behavior.
|
| Geography and Growth Outlook | India and China are projected to expand from tire output, EV assembly and localized compound supply. The United States, Germany and Japan are expected to move with slower approval routines.
|
| Competitive Landscape | Competition is expected to form around polymer grade breadth, tire specification proof and local service ownership. Direct support carries weight where plants test low-permeability performance before broad orders.
|
| Analyst Perspective | Halobutyl rubber is sold through trust in repeat batches. Tire and closure accounts are expected to reward suppliers that explain permeability, cure behavior and service response in the same visit.
|
Source: FMI's proprietary forecasting model and primary research
How is the halobutyl rubber market segmented?
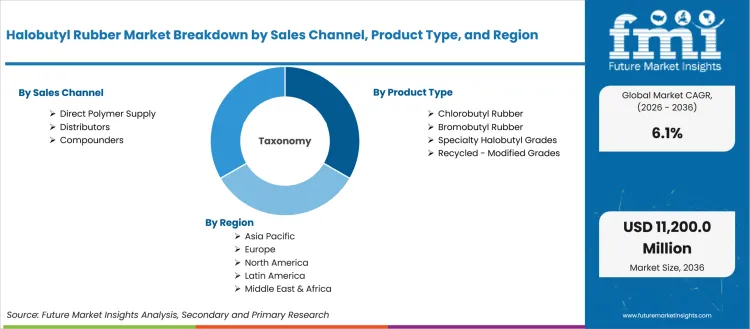
The halobutyl rubber industry is segmented by product type, application, end use, sales channel, grade, and region.
The halobutyl rubber market is segmented by product type, application, end use, sales channel, grade, and region. By product type, the market covers chlorobutyl rubber, bromobutyl rubber, specialty halobutyl grades, and recycled or modified grades. By application, it covers tire innerliners, pharmaceutical stoppers, hoses or seals, and adhesives or other uses. By end use, it covers tire manufacturing, healthcare or pharma, automotive rubber goods, and industrial rubber. By sales channel, it covers direct polymer supply, distributors, and compounders. By grade, it covers standard grade, low permeability grade, high cure reactivity grade, and clean or pharma grade. Regional coverage includes North America, Europe, East Asia, South Asia and other economies linked to industrial rubber goods.
How does direct polymer supply shape demand within the sales channel category?
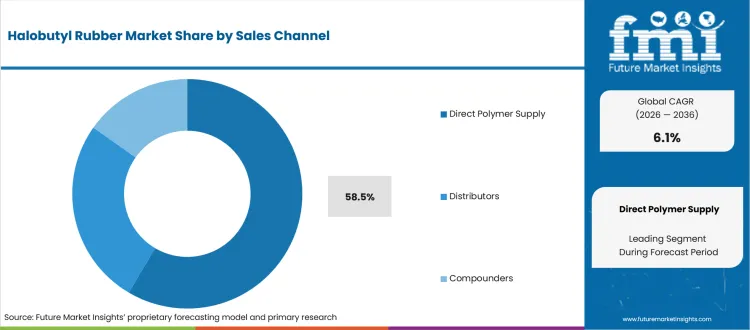
Direct polymer supply gives tire plants and closure formulators one accountable route for technical files, delivery timing and complaint response. Reliance Sibur Elastomers reported in 2025 that its halo butyl rubber plant had begun commercial operation during FY 2023-24 at Jamnagar. Local polymer supply changes the purchasing conversation because plant teams see fewer handoffs between specification approval and repeat deliveries.
- Based on sales channel, direct polymer supply is projected to account for 58.5% in 2026 due to service ownership during plant trials and repeat purchases. Reliance Sibur's Jamnagar operation gives Indian tire accounts a local source for butyl and halo butyl rubber, which supports qualification work before volume expansion.
- Direct polymer supply is drawing demand from tire manufacturers owing to fewer handoffs between polymer producer and plant team. Accounts reviewing reclaimed rubber supply are expected to keep direct routes for grades where permeability records and batch traceability decide approval.
What supports demand for chlorobutyl rubber within the product type category?
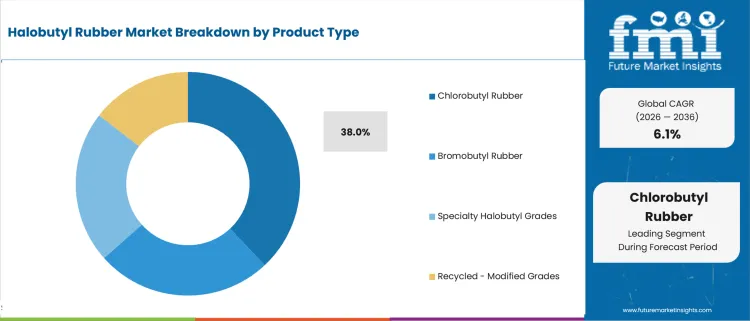
Chlorobutyl rubber is valued when a compounder needs low permeability and faster cure behavior without losing heat resistance. ExxonMobil Product Solutions describes chlorobutyl rubber as offering compression-set, heat and ozone resistance advantages compared with regular butyl rubber. Tire and closure teams connect that product fit to formulations where rubber must seal, resist ageing and release cleanly after curing.
- By product type, chlorobutyl rubber is estimated to hold 38.0% in 2026 because regulated rubber recipes need cure response and low permeability. ExxonMobil reported in 2026 that halobutyl rubber improves tire air retention and raises EV range by up to 7.0% in cited use.
- Demand for chlorobutyl rubber is expected to grow among compounders attributable to predictable cure behavior and ageing resistance. Formulators serving lower-emission tire programs need polymer evidence that remains stable beside fillers, cure packages and innerliner thickness changes.
How is tire innerliner demand positioned within the application category?
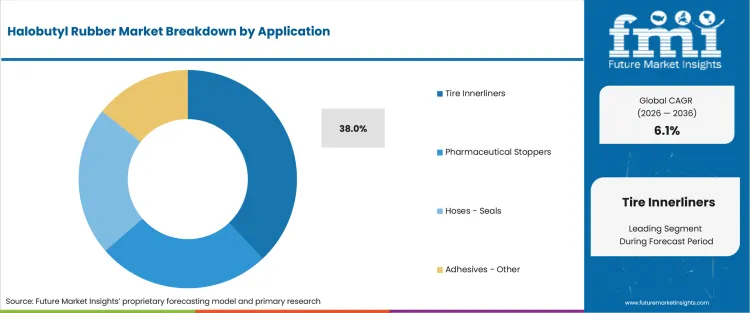
Tire innerliners are the clearest halobutyl use because air loss affects tire pressure, energy use and service complaints. USTMA projected original equipment passenger tire shipments at 41.6 million units in 2025 in its November 2025 forecast. That release keeps innerliner demand close to vehicle assembly cycles and replacement channels that test tire pressure retention.
- In 2026, tire innerliners are expected to lead application demand with 38.0% share because radial tires need low air permeability across long service intervals. USTMA projected replacement passenger tire shipments of 221.6 million units in 2025, which keeps innerliner compounds under routine validation.
- Tire manufacturers are increasingly purchasing innerliner grades led by pressure-retention needs and lower rolling resistance design work. Plants that qualify low rolling resistance tires are expected to require halobutyl proof beside calendering behavior and splice quality.
What makes tire manufacturing central to the end use category?
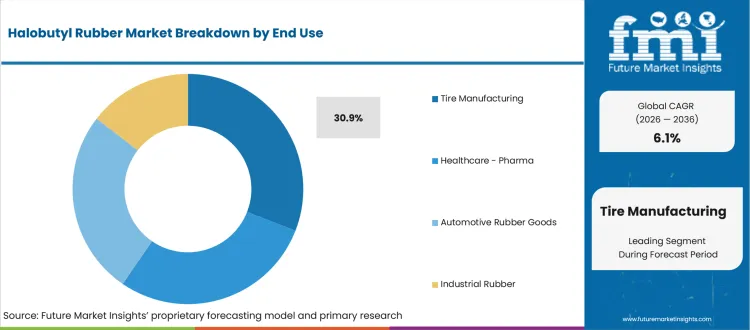
Tire manufacturing places halobutyl rubber inside a high-volume quality routine where a small permeability drift affects release decisions. OICA reported in April 2026 that global vehicle production rose to 96.4 million units in 2025. The vehicle base keeps tire plants focused on innerliner consistency, warranty exposure and local technical support during compound changes.
- By end use, tire manufacturing is forecast to represent 30.9% in 2026 driven by innerliner specification control and recurring plant approval work. OICA reported Asia-Pacific vehicle production at 59.2 million units in 2025, which keeps halobutyl qualification near major tire production clusters.
- Purchase activity for tire manufacturing is anticipated to rise driven by rework control and pressure-retention requirements. Tire teams using technology tire programs are expected to keep conventional innerliner validation in place before sensor claims or connected tire features move into production.
How do rubber compounders evaluate standard grade within the grade category?
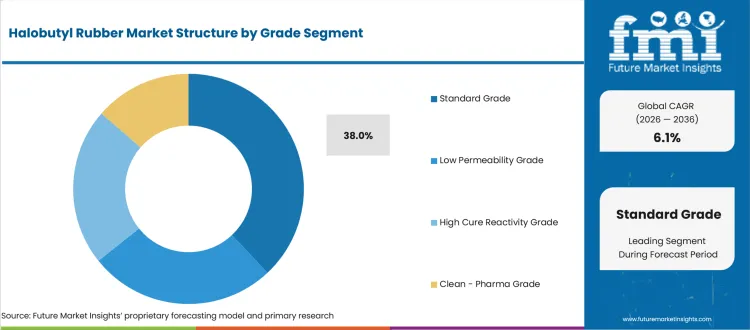
Standard grade remains practical because many tire and industrial rubber recipes need dependable behavior before they need a specialty label. Zhejiang Cenway Materials issued a 2026 safety data sheet for chlorobutyl rubber CIIR 1301, which gives distributors and compounders basic handling records for technical review. Such documents help plants compare identity, safety and storage evidence before trials begin.
- Standard grade is projected to lead the grade category with 38.0% share in 2026 due to familiar compounding behavior and broad application fit. Zhejiang Cenway's 2026 CIIR 1301 documentation supports account screening where safety, handling and polymer identity need a first file.
- Rubber compounders are expected to favor standard grade over specialty options due to easier recipe transfer and lower approval burden. Suppliers discussing bio isobutene pathways are anticipated to keep standard grade files ready because plant teams still ask first about cure response.
What are the drivers, restraints, and opportunities in the halobutyl rubber market?
Near-term purchases are projected to be shaped by tire air-retention requirements, raw material volatility, and EV tire reformulation work outlined below.
- Driver: Tire makers are expected to purchase halobutyl rubber where pressure retention reduces warranty risk and energy loss.
- Restraint: Qualification work is anticipated to delay supplier changes when plant files lack permeability and ageing proof.
- Opportunity: EV tire programs are projected to open account access for grades that handle torque load and range targets.
Tire plants are expected to raise interest in polymers that make innerliner performance easier to verify before production release. In 2025, Reliance Sibur Elastomers reported that halo butyl rubber production had reached commercial operation during FY 2023-24. Local output helps compounders test grades with shorter lead times. The local output gives tire makers a nearby technical route when a line trial needs reformulation support.
Approval teams are estimated to slow supplier changes when chemical files and plant evidence remain incomplete. The European Commission explained in 2026 that REACH registration applies when a substance exceeds 1.0 tonne per company each year. That threshold keeps European compounders focused on substance identity, exposure controls and documentation before a polymer enters repeat orders. Supplier switching stays hard when records arrive after a plant trial starts.
EV tire programs are forecast to turn the restraint into a specification route for halobutyl suppliers. The IEA reported in 2026 that global electric car production reached nearly 22.0 million units in 2025. Heavier vehicles and range claims are expected to keep air retention close to low rolling resistance tires, which gives polymer producers a clearer reason to support tire engineers early.
Which country CAGRs are profiled in the halobutyl rubber market?
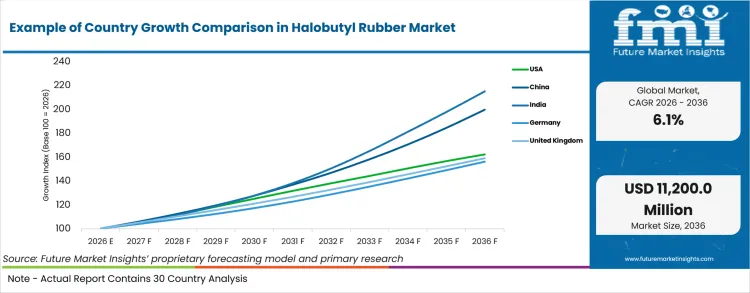
| Country | CAGR |
|---|---|
| United States | 4.96% |
| China | 7.16% |
| India | 7.96% |
| Germany | 4.56% |
| United Kingdom | 4.76% |
| Japan | 4.56% |
| South Korea | 5.96% |
| Rest of World | 6.56% |
Source: FMI's proprietary forecasting model and primary research
How do country-level CAGRs compare in the halobutyl rubber market?
Country growth is projected to separate between tire manufacturing scale and approval discipline. India and China are expected to expand from local tire output and new vehicle programs. The United States, Germany and Japan are anticipated to move through tighter qualification routines. The United Kingdom and South Korea are estimated to depend more on export channels and technical service access. Rest of World demand is forecast to follow transport growth in ASEAN, Latin America and the Middle East.
- USA tire accounts begin the discussion with replacement-channel reliability because innerliners carry pressure-retention risk after sale. United States is projected to grow at 4.96% CAGR by 2036 because approval work remains deliberate at tire makers. USTMA reported replacement light truck tire shipments of 41.8 million units in its November 2025 forecast. The replacement base keeps ExxonMobil and other local technical teams focused on pressure loss and warranty evidence. Procurement teams are expected to move cautiously when an approved grade already performs inside a tire plant.
- China gives halobutyl suppliers a scale test because tire demand runs beside rapid new-energy vehicle production. OICA reported that China produced 34.53 million vehicles in 2025. Halobutyl rubber demand in China is forecast to rise at 7.16% CAGR over the forecast period, driven by tire output and local compounding scale. Sinopec and regional distributors are expected to compete on polymer availability and technical support. The next account opening is expected to depend on stable supply near coastal tire clusters.
- India's polymer case changed after domestic halo butyl capacity moved closer to tire and closure customers. The Ministry of Heavy Industries reported passenger vehicle production of 5.38 million units during January to December 2025. Reliance Sibur gives local compounders a named domestic source for butyl and halobutyl grades. Adoption of halobutyl rubber in India is estimated to expand at 7.96% CAGR through 2036, owing to local tire output and shorter supply routes. Price discipline remains tight during the next supplier round.
- German accounts usually ask for documentation before cost savings enter the discussion. Germany is estimated to post 4.56% CAGR over the forecast period, shaped by qualification files and export tire programs. VDA reported that German plants produced 864,000 electric cars in the first half of 2025. That EV output keeps innerliner air retention and range targets near tire design conversations. ARLANXEO's European service base is expected to support accounts that require repeatable files before supplier transfer.
- The United Kingdom uses a smaller production base but keeps export discipline high in tire and vehicle supply chains. SMMT reported that UK plants built over 717,000 cars in 2025. The United Kingdom halobutyl rubber outlook is anticipated to advance at 4.76% CAGR over the assessment period, supported by export-linked specification work. Closure converters and tire distributors are expected to value short technical response from polymer partners. The country's route advantage is expected to come from service speed and documentation clarity.
- Japan's tire and rubber accounts tend to protect approved recipes because quality history carries weight in plant decisions. Japan Automobile Manufacturers Association reported vehicle production of 8.23 million units in 2024 in its 2025 industry review. Bridgestone, Yokohama Rubber and Japan Butyl remain relevant local actors in rubber specification work. The Japan halobutyl rubber sector is projected to record 4.56% CAGR during the assessment period, due to controlled approvals and stable tire demand. Supplier gains are expected to come through proof of consistency.
- South Korea links halobutyl purchasing to export tire programs and compact supplier networks. MOTIR reported that automobile exports reached USD 72.0 billion in 2025. Kumho Tire, Hankook Tire and Nexen Tire keep polymer suppliers close to performance and delivery checks. Korean tire makers watch EV tire requirements beside export schedules. Halobutyl rubber demand in South Korea is anticipated to advance at 5.96% CAGR through 2036 led by export tire value and fast technical feedback.
- Rest of World demand is spread across ASEAN, Latin America and Middle East tire channels. The IEA reported that global electric car production reached nearly 22.0 million units in 2025. Halobutyl rubber sales in Rest of World are forecast to expand at 6.56% CAGR by 2036, supported by tire replacement and EV assembly spillovers. Thailand Board of Investment and regional tire exporters keep Southeast Asia visible in procurement planning. Distributor control is expected to decide which accounts move beyond trial orders.
Who are the notable companies in the halobutyl rubber market?
ExxonMobil, ARLANXEO, Reliance Industries Limited, Reliance Sibur Elastomers Private Limited, SIBUR, Sinopec, Japan Butyl Co., Ltd., JSR Corporation, and Zhejiang Cenway Materials Co., Ltd. are the notable companies shaping this market.
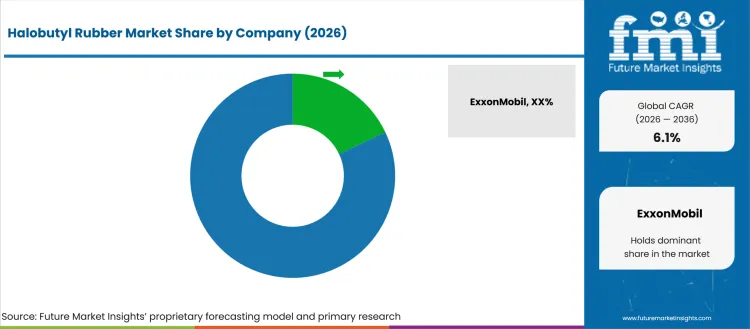
The supply base is projected to compete on grade consistency and permeability proof. Halogen chemistry control and account service are expected to separate vendors during account review. Tire manufacturers screen vendors by batch history and problem-solving speed after line trials. Pharmaceutical closure users add extractables and cleanliness records to the file review. Direct polymer producers hold an advantage when they connect plant teams with technical specialists. Distributors remain useful where smaller rubber accounts need stocked grades and local paperwork tied to retread tire demand.
- ExxonMobil and ARLANXEO compete from long polymer histories and broad technical files for tire innerliners. Their account value is expected to rest on permeability evidence, specification support and service teams that understand tire plant release work.
- Indian accounts are projected to give Reliance Industries and Reliance Sibur a closer review because Jamnagar production reduces import reliance. Local availability helps compounders test halobutyl grades while keeping commercial and technical discussions inside India.
- SIBUR, Sinopec and Japan Butyl serve accounts where regional feedstock, logistics and approved grade access affect procurement. These producers are expected to be more relevant when a tire plant needs delivery assurance before switching polymer families.
- Specialty discussions often include JSR Corporation and Zhejiang Cenway Materials because documentation and regional supply shape smaller accounts. Clean-grade and standard-grade files are expected to separate vendors before price becomes the final screen.
Competitive Benchmarking: Halobutyl Rubber Market
| Company | Polymer Focus | Tire Qualification Fit | Pharma Closure Fit | Service Reach |
|---|---|---|---|---|
| ExxonMobil | Strong | High | Medium | Global |
| ARLANXEO | Strong | High | Medium | Global |
| Reliance Industries Limited | Medium | Medium | Medium | Regional; India |
| Reliance Sibur Elastomers Private Limited | Strong | Medium | Medium | Country-specific |
| SIBUR | Strong | Medium | Medium | Regional; Eurasia |
| Sinopec | Medium | Medium | Low | Regional; China |
| Japan Butyl Co., Ltd. | Medium | High | Medium | Regional; Japan |
| JSR Corporation | Medium | Medium | Medium | Regional; Asia |
| Zhejiang Cenway Materials Co., Ltd. | Medium | Medium | Low | Regional; China |
Source: Future Market Insights competitive analysis, 2026. Ratings reflect relative portfolio relevance and workflow fit. Service capability and geographic reach shape the remaining comparison.
Key Developments in the Halobutyl Rubber Market
- In May 2026, ExxonMobil published its 2026 Advancing Climate Solutions Report and discussed halobutyl rubber in EV tire design. The company stated that better air retention in tires supports energy efficiency and range claims. The update gives tire accounts a company-backed explanation for using halobutyl innerliners in EV platforms. The update connects material selection with lower pressure loss during vehicle operation.
- In May 2025, Reliance Sibur Elastomers reported active halo-butyl rubber production at Jamnagar. Its compliance filing listed Halo-Butyl Rubber capacity at 60 KTA with matching production in the previous year. This confirms India’s domestic supply base is moving from project status into operating market relevance.
- In December 2024, DGTR recommended anti-dumping duty on HIIR imports from five subject countries. The authority concluded that dumped imports had materially retarded India’s domestic industry. This development increased scrutiny on imported bromobutyl and chlorobutyl rubber used in tires, seals and industrial rubber goods
Key Players in the Halobutyl Rubber Market
Global halobutyl producers
- ExxonMobil
- ARLANXEO
- SIBUR
- Sinopec
- Japan Butyl Co., Ltd.
India and regional producers
- Reliance Industries Limited
- Reliance Sibur Elastomers Private Limited
Specialty and technical grade suppliers
- JSR Corporation
- Zhejiang Cenway Materials Co., Ltd.
Halobutyl Rubber Market - Report Scope
| Coverage field | Report scope |
|---|---|
| Market breakdown | By product type, application, end use, sales channel, grade, and region |
| Quantitative Units | Revenue in USD Million, volume in tons, and CAGR in % |
| Market Definition | Halobutyl rubber covers chlorinated and brominated butyl elastomers used where low gas permeability, sealing and cure control guide material choice. |
| Regions Covered | North America, Latin America, Europe, East Asia, South Asia, Oceania, and Middle East and Africa |
| Countries Covered | United States, China, India, Germany, United Kingdom, Japan, South Korea, and 30+ countries |
| Key Companies Profiled | ExxonMobil, ARLANXEO, Reliance Industries Limited, Reliance Sibur Elastomers Private Limited, SIBUR, Sinopec, Japan Butyl Co., Ltd., JSR Corporation, and Zhejiang Cenway Materials Co., Ltd. |
| Forecast Period | 2026 to 2036 |
| Approach | Hybrid methodology using bottom-up polymer demand checks, market-wide tire and closure indicators, supplier disclosures and primary research with compounders and distributors |
Source: Future Market Insights - analysis driven by proprietary forecasting models and primary research
Halobutyl Rubber Market - Research Methodology
| Method | Approach |
|---|---|
| Primary Research | FMI interviewed polymer producers, rubber compounders, tire plant teams, distributors and closure formulators. Discussions covered grade selection, channel preference, delivery timing, qualification effort and service needs. Responses were checked against company disclosures and country tire indicators. Interview inputs were weighted by account type so large tire programs did not hide smaller clean-grade and industrial rubber demand. |
| Desk Research | Desk research used official company reports, trade associations, vehicle production releases, chemical regulation pages and producer product documents. Tire shipment data, EV production indicators and synthetic rubber disclosures were reviewed beside country-level manufacturing evidence. Public information was screened for date, source ownership and relevance to halobutyl rubber purchasing before any figure entered the article. |
| Market Sizing and Forecasting | Market sizing combined product-grade assumptions with tire innerliner demand, pharmaceutical closure use and industrial rubber consumption. The 2026 base was reconciled against company capacity signals and channel interviews. Forecasts were built with a hybrid bottom-up and market-wide method that links segment shares with country-level tire output, EV production and distributor feedback. |
| Data Validation | Data validation compared country CAGRs, segment shares and 2026 values against the master forecast model. Figures were checked for arithmetic consistency and rounded to one decimal place where needed. Source claims were reviewed for direct relevance to tire innerliners, sealing grades, local production and vendor selection before final text and bibliography alignment. |
Source: Future Market Insights (FMI) analysis, based on proprietary forecasting model and primary research
Halobutyl Rubber Market by Segments
Halobutyl Rubber Market segmented by Product Type:
- Chlorobutyl Rubber
- Bromobutyl Rubber
- Specialty Halobutyl Grades
- Recycled / Modified Grades
Halobutyl Rubber Market segmented by Application:
- Tire Innerliners
- Pharmaceutical Stoppers
- Hoses / Seals
- Adhesives / Other
Halobutyl Rubber Market segmented by End Use:
- Tire Manufacturing
- Healthcare / Pharma
- Automotive Rubber Goods
- Industrial Rubber
Halobutyl Rubber Market segmented by Sales Channel:
- Direct Polymer Supply
- Distributors
- Compounders
Halobutyl Rubber Market segmented by Grade:
- Standard Grade
- Low Permeability Grade
- High Cure Reactivity Grade
- Clean / Pharma Grade
Halobutyl Rubber Market by Region:
- North America
- United States
- Canada
- Latin America
- Brazil
- Mexico
- Argentina
- Europe
- Germany
- United Kingdom
- France
- Italy
- Spain
- Rest of Europe
- East Asia
- China
- Japan
- South Korea
- South Asia
- India
- Thailand
- Indonesia
- Malaysia
- Rest of South Asia
- Oceania
- Australia
- New Zealand
- Middle East and Africa
- GCC Countries
- South Africa
- Turkey
- Rest of Middle East and Africa
Research Sources and Bibliography
- USA Tire Manufacturers Association. (2025, November). USTMA November 2025 forecast predicts slightly higher 2025 tire shipments for USA tire market. USA Tire Manufacturers Association.
- International Organization of Motor Vehicle Manufacturers. (2026, April). Auto industry growth shifted east in 2025 amid global repositioning. International Organization of Motor Vehicle Manufacturers.
- Ministry of Heavy Industries. (2026, February). Status of heavy industries sector. Press Information Bureau.
- Verband der Automobilindustrie. (2025, August). Electric car production at record levels in first half of the year. VDA.
- Society of Motor Manufacturers and Traders. (2026, June). Vehicle production up but pressures persist. SMMT.
- Japan Automobile Manufacturers Association. (2025, September). The motor industry of Japan 2025. Japan Automobile Manufacturers Association.
- Ministry of Trade, Industry and Resources. (2026, January). Automobile exports hit record high of $72 billion in 2025. Ministry of Trade, Industry and Resources.
- International Energy Agency. (2026, June). Global EV Outlook 2026: Manufacturing and trade. International Energy Agency.
- European Commission. (2026, March). REACH Regulation. European Commission.
- ExxonMobil. (2026, May). Advancing Climate Solutions 2026 progress report. ExxonMobil.
- ExxonMobil Product Solutions. (2026, June). Butyl rubber and halobutyl rubber product information. ExxonMobil Product Solutions.
- ARLANXEO. (2026, June). Regular butyl and halogenated butyl rubber. ARLANXEO.
- Reliance Industries Limited. (2026, June). Elastomers: polybutadiene rubber, styrene butadiene rubber, butyl rubber. Reliance Industries Limited.
- Reliance Industries Limited. (2025, July). Reliance Sibur Elastomers Private Limited financial statements for the year ended 31 March 2025. Reliance Industries Limited.
- SIBUR. (2026, May). SIBUR presents its integrated annual report: 30 years, 20 regions, one team. SIBUR.
- Sinopec. (2026, March). Sinopec releases 2025 annual report. Sinopec.
- Reliance Sibur Elastomers Private Limited. (2025, May 23). Half yearly compliance report 2025: Manufacturing of Butyl Rubber and Halo Butyl Rubber plant at Jamnagar. Ministry of Environment, Forest and Climate Change filing.
- Directorate General of Trade Remedies. (2024, December 28). Final findings: Anti-dumping investigation concerning imports of Halobutyl-Rubber originating in or exported from Japan, Russia, Singapore, the United Kingdom and the United States of America. Government of India, Ministry of Commerce & Industry.
- Zhejiang Cenway Materials Co., Ltd. (2026, February). Safety data sheet: Chlorobutyl rubber CIIR 1301. Zhejiang Cenway Materials Co., Ltd.
This bibliography is provided for reader reference and uses primary government, standards-body, official trade body, and company sources.
This Report Answers
- What value is the halobutyl rubber market estimated at in 2026 and by 2036?
- What CAGR is the halobutyl rubber market projected to record from 2026 to 2036?
- Which product type and application segments shape demand across end use, sales channel and grade categories?
- Which tire pressure, closure sealing and compounding pressures are expected to support purchase activity?
- How are country CAGRs estimated to differ across the United States and China compared with India and Germany?
- Which companies compete across polymer focus and tire qualification fit beside closure use and service reach?
- How does FMI validate halobutyl rubber forecasts through bottom-up checks and market-wide tire indicators?
- What should tire manufacturers and compounders address before broader account expansion or sourcing commitment?
- How are chemical files, plant documentation and regulatory review expected to affect vendor selection?
Frequently Asked Questions
What is driving growth in the Halobutyl Rubber Market?
Demand is expected to be driven by tire innerliner validation and pharmaceutical closure cleanliness. EV tire programs are projected to add specification pressure.
Who are the key players in the Halobutyl Rubber Market?
Key players include ExxonMobil and ARLANXEO with Reliance Industries and SIBUR. Competition is projected to include Sinopec and Japan Butyl beside JSR and Zhejiang Cenway around grade reliability.
What is a significant restraint in the Halobutyl Rubber Market?
A significant restraint is raw material volatility and long qualification work inside tire plants. Adoption is anticipated to slow when batch evidence remains incomplete.
Why should executives track the Halobutyl Rubber Market?
Executives should track this market because halobutyl rubber is essential for tire innerliners where air retention directly affects fuel efficiency, EV driving range, and product performance. Growing vehicle production, EV adoption, and pharmaceutical closure demand are expanding opportunities for high-performance halobutyl grades.
What business problem does the Halobutyl Rubber Market address?
The market addresses the need for low-permeability rubber materials that help retain air, improve sealing performance, and enhance durability in demanding applications. It supports tire manufacturers and healthcare suppliers by providing reliable performance under strict quality requirements.
What should procurement leaders evaluate before selecting suppliers?
Procurement leaders should evaluate polymer consistency, permeability performance, cure characteristics, and regulatory documentation. They should also assess technical service capabilities, supply reliability, batch traceability, and support during product qualification processes.
What can limit return on investment for buyers?
Return on investment can be limited by raw material price volatility, lengthy qualification cycles, and inconsistent batch performance. Delays in approval, inadequate technical documentation, or supply disruptions can also increase operational costs and sourcing risks.
How can suppliers build executive confidence?
Suppliers can build confidence by providing consistent product quality, validated performance data, and comprehensive technical documentation. Strong local support, responsive troubleshooting, and proven success in tire and pharmaceutical applications can further strengthen long-term customer trust.
Preview the report firsthand - request a free sample
Get SampleGet the brochure for pricing and purchase details.
Get PDFTable of Content
- Key Takeaways
- Market Size and CAGR
- Top Growth Driver
- Fastest Growing Segment
- Leading Region
- Key Companies
- Emerging Opportunities
- Executive Summary
- Global Market Outlook
- Demand-side Trends
- Supply-side Trends
- Technology Roadmap Analysis
- Analysis and Recommendations
- Analyst Perspective (What is happening? Why now? What should investors know?)
- Key Questions Answered
- How large is the market?
- What is the CAGR?
- What are key trends?
- Which region dominates?
- Who are the leaders?
- Market Overview
- Market Coverage / Taxonomy
- Market Definition / Scope / Limitations
- Research Methodology
- Chapter Orientation
- Analytical Lens and Working Hypotheses
- Market Structure, Signals, and Trend Drivers
- Benchmarking and Cross-market Comparability
- Market Sizing, Forecasting, and Opportunity Mapping
- Research Design and Evidence Framework
- Desk Research Programme (Secondary Evidence)
- Expert Input and Fieldwork (Primary Evidence)
- Tooling, Models, and Reference Databases
- Data Engineering and Model Build
- Quality Assurance and Audit Trail
- Market Background
- Market Dynamics (Drivers, Restraints, Opportunity, Trends)
- Scenario Forecast (Optimistic, Likely, Conservative)
- Impact Analysis
- AI Impact
- Sustainability Impact
- Regulatory Impact
- Technology Impact
- Consumer / Buyer Analysis
- Purchase Drivers
- Adoption Barriers
- Buyer Journey
- Opportunity Map Analysis
- Product Life Cycle Analysis
- Supply Chain Analysis
- Investment Feasibility Matrix
- Value Chain Analysis
- PESTLE and Porter's Analysis
- Regulatory Landscape
- Regional Parent Market Outlook
- Production and Consumption Statistics
- Import and Export Statistics
- Global Market Analysis and Forecast, 2021 to 2036
- Historical Market Size Value (USD Million) Analysis, 2021 to 2025
- Current and Future Market Size Value (USD Million) Projections, 2026 to 2036
- Y-o-Y Growth Trend Analysis
- Absolute $ Opportunity Analysis
- Global Market Pricing Analysis, 2021 to 2036
- Global Market Analysis and Forecast, By Sales Channel, 2021 to 2036
- Introduction / Key Findings
- Historical Market Size Value (USD Million) Analysis By Sales Channel, 2021 to 2025
- Current and Future Market Size Value (USD Million) Analysis and Forecast By Sales Channel, 2026 to 2036
- Direct Polymer Supply
- Distributors
- Compounders
- Direct Polymer Supply
- Y-o-Y Growth Trend Analysis By Sales Channel, 2021 to 2025
- Absolute $ Opportunity Analysis By Sales Channel, 2026 to 2036
- Global Market Analysis and Forecast, By Product Type, 2021 to 2036
- Introduction / Key Findings
- Historical Market Size Value (USD Million) Analysis By Product Type, 2021 to 2025
- Current and Future Market Size Value (USD Million) Analysis and Forecast By Product Type, 2026 to 2036
- Chlorobutyl Rubber
- Bromobutyl Rubber
- Specialty Halobutyl Grades
- Recycled - Modified Grades
- Chlorobutyl Rubber
- Y-o-Y Growth Trend Analysis By Product Type, 2021 to 2025
- Absolute $ Opportunity Analysis By Product Type, 2026 to 2036
- Global Market Analysis and Forecast, By Application, 2021 to 2036
- Introduction / Key Findings
- Historical Market Size Value (USD Million) Analysis By Application, 2021 to 2025
- Current and Future Market Size Value (USD Million) Analysis and Forecast By Application, 2026 to 2036
- Tire Innerliners
- Pharmaceutical Stoppers
- Hoses - Seals
- Adhesives - Other
- Tire Innerliners
- Y-o-Y Growth Trend Analysis By Application, 2021 to 2025
- Absolute $ Opportunity Analysis By Application, 2026 to 2036
- Global Market Analysis and Forecast, By End Use, 2021 to 2036
- Introduction / Key Findings
- Historical Market Size Value (USD Million) Analysis By End Use, 2021 to 2025
- Current and Future Market Size Value (USD Million) Analysis and Forecast By End Use, 2026 to 2036
- Tire Manufacturing
- Healthcare - Pharma
- Automotive Rubber Goods
- Industrial Rubber
- Tire Manufacturing
- Y-o-Y Growth Trend Analysis By End Use, 2021 to 2025
- Absolute $ Opportunity Analysis By End Use, 2026 to 2036
- Global Market Analysis and Forecast, By Grade, 2021 to 2036
- Introduction / Key Findings
- Historical Market Size Value (USD Million) Analysis By Grade, 2021 to 2025
- Current and Future Market Size Value (USD Million) Analysis and Forecast By Grade, 2026 to 2036
- Standard Grade
- Low Permeability Grade
- High Cure Reactivity Grade
- Clean - Pharma Grade
- Standard Grade
- Y-o-Y Growth Trend Analysis By Grade, 2021 to 2025
- Absolute $ Opportunity Analysis By Grade, 2026 to 2036
- Global Market Analysis and Forecast, By Region, 2021 to 2036
- Introduction
- Historical Market Size Value (USD Million) Analysis By Region, 2021 to 2025
- Current Market Size Value (USD Million) Analysis and Forecast By Region, 2026 to 2036
- North America
- Latin America
- Western Europe
- Eastern Europe
- East Asia
- South Asia and Pacific
- Middle East & Africa
- Market Attractiveness Analysis By Region
- North America Market Analysis and Forecast, By Country, 2021 to 2036
- Historical Market Size Value (USD Million) Trend Analysis By Market Taxonomy, 2021 to 2025
- Market Size Value (USD Million) Forecast By Market Taxonomy, 2026 to 2036
- By Country
- USA
- Canada
- By Sales Channel
- By Product Type
- By Application
- By End Use
- By Grade
- By Country
- Market Attractiveness Analysis
- By Country
- By Sales Channel
- By Product Type
- By Application
- By End Use
- By Grade
- Key Takeaways
- Latin America Market Analysis and Forecast, By Country
- Historical Market Size Value (USD Million) Trend Analysis By Market Taxonomy, 2021 to 2025
- Market Size Value (USD Million) Forecast By Market Taxonomy, 2026 to 2036
- By Country
- Brazil
- Mexico
- Chile
- Rest of Latin America
- By Sales Channel
- By Product Type
- By Application
- By End Use
- By Grade
- By Country
- Market Attractiveness Analysis
- By Country
- By Sales Channel
- By Product Type
- By Application
- By End Use
- By Grade
- Key Takeaways
- Western Europe Market Analysis and Forecast, By Country
- Historical Market Size Value (USD Million) Trend Analysis By Market Taxonomy, 2021 to 2025
- Market Size Value (USD Million) Forecast By Market Taxonomy, 2026 to 2036
- By Country
- Germany
- UK
- Italy
- Spain
- France
- Nordic
- BENELUX
- Rest of Western Europe
- By Sales Channel
- By Product Type
- By Application
- By End Use
- By Grade
- By Country
- Market Attractiveness Analysis
- By Country
- By Sales Channel
- By Product Type
- By Application
- By End Use
- By Grade
- Key Takeaways
- Eastern Europe Market Analysis and Forecast, By Country
- Historical Market Size Value (USD Million) Trend Analysis By Market Taxonomy, 2021 to 2025
- Market Size Value (USD Million) Forecast By Market Taxonomy, 2026 to 2036
- By Country
- Russia
- Poland
- Hungary
- Balkan & Baltic
- Rest of Eastern Europe
- By Sales Channel
- By Product Type
- By Application
- By End Use
- By Grade
- By Country
- Market Attractiveness Analysis
- By Country
- By Sales Channel
- By Product Type
- By Application
- By End Use
- By Grade
- Key Takeaways
- East Asia Market Analysis and Forecast, By Country
- Historical Market Size Value (USD Million) Trend Analysis By Market Taxonomy, 2021 to 2025
- Market Size Value (USD Million) Forecast By Market Taxonomy, 2026 to 2036
- By Country
- China
- Japan
- South Korea
- By Sales Channel
- By Product Type
- By Application
- By End Use
- By Grade
- By Country
- Market Attractiveness Analysis
- By Country
- By Sales Channel
- By Product Type
- By Application
- By End Use
- By Grade
- Key Takeaways
- South Asia and Pacific Market Analysis and Forecast, By Country
- Historical Market Size Value (USD Million) Trend Analysis By Market Taxonomy, 2021 to 2025
- Market Size Value (USD Million) Forecast By Market Taxonomy, 2026 to 2036
- By Country
- India
- ASEAN
- Australia & New Zealand
- Rest of South Asia and Pacific
- By Sales Channel
- By Product Type
- By Application
- By End Use
- By Grade
- By Country
- Market Attractiveness Analysis
- By Country
- By Sales Channel
- By Product Type
- By Application
- By End Use
- By Grade
- Key Takeaways
- Middle East & Africa Market Analysis and Forecast, By Country
- Historical Market Size Value (USD Million) Trend Analysis By Market Taxonomy, 2021 to 2025
- Market Size Value (USD Million) Forecast By Market Taxonomy, 2026 to 2036
- By Country
- Kingdom of Saudi Arabia
- Other GCC Countries
- Türkiye
- South Africa
- Other African Union
- Rest of Middle East & Africa
- By Sales Channel
- By Product Type
- By Application
- By End Use
- By Grade
- By Country
- Market Attractiveness Analysis
- By Country
- By Sales Channel
- By Product Type
- By Application
- By End Use
- By Grade
- Key Takeaways
- Key Countries Market Analysis
- USA
- Pricing Analysis
- Market Share Analysis, 2025
- By Sales Channel
- By Product Type
- By Application
- By End Use
- By Grade
- Canada
- Pricing Analysis
- Market Share Analysis, 2025
- By Sales Channel
- By Product Type
- By Application
- By End Use
- By Grade
- Mexico
- Pricing Analysis
- Market Share Analysis, 2025
- By Sales Channel
- By Product Type
- By Application
- By End Use
- By Grade
- Brazil
- Pricing Analysis
- Market Share Analysis, 2025
- By Sales Channel
- By Product Type
- By Application
- By End Use
- By Grade
- Chile
- Pricing Analysis
- Market Share Analysis, 2025
- By Sales Channel
- By Product Type
- By Application
- By End Use
- By Grade
- Germany
- Pricing Analysis
- Market Share Analysis, 2025
- By Sales Channel
- By Product Type
- By Application
- By End Use
- By Grade
- UK
- Pricing Analysis
- Market Share Analysis, 2025
- By Sales Channel
- By Product Type
- By Application
- By End Use
- By Grade
- Italy
- Pricing Analysis
- Market Share Analysis, 2025
- By Sales Channel
- By Product Type
- By Application
- By End Use
- By Grade
- Spain
- Pricing Analysis
- Market Share Analysis, 2025
- By Sales Channel
- By Product Type
- By Application
- By End Use
- By Grade
- France
- Pricing Analysis
- Market Share Analysis, 2025
- By Sales Channel
- By Product Type
- By Application
- By End Use
- By Grade
- India
- Pricing Analysis
- Market Share Analysis, 2025
- By Sales Channel
- By Product Type
- By Application
- By End Use
- By Grade
- ASEAN
- Pricing Analysis
- Market Share Analysis, 2025
- By Sales Channel
- By Product Type
- By Application
- By End Use
- By Grade
- Australia & New Zealand
- Pricing Analysis
- Market Share Analysis, 2025
- By Sales Channel
- By Product Type
- By Application
- By End Use
- By Grade
- China
- Pricing Analysis
- Market Share Analysis, 2025
- By Sales Channel
- By Product Type
- By Application
- By End Use
- By Grade
- Japan
- Pricing Analysis
- Market Share Analysis, 2025
- By Sales Channel
- By Product Type
- By Application
- By End Use
- By Grade
- South Korea
- Pricing Analysis
- Market Share Analysis, 2025
- By Sales Channel
- By Product Type
- By Application
- By End Use
- By Grade
- Russia
- Pricing Analysis
- Market Share Analysis, 2025
- By Sales Channel
- By Product Type
- By Application
- By End Use
- By Grade
- Poland
- Pricing Analysis
- Market Share Analysis, 2025
- By Sales Channel
- By Product Type
- By Application
- By End Use
- By Grade
- Hungary
- Pricing Analysis
- Market Share Analysis, 2025
- By Sales Channel
- By Product Type
- By Application
- By End Use
- By Grade
- Kingdom of Saudi Arabia
- Pricing Analysis
- Market Share Analysis, 2025
- By Sales Channel
- By Product Type
- By Application
- By End Use
- By Grade
- Türkiye
- Pricing Analysis
- Market Share Analysis, 2025
- By Sales Channel
- By Product Type
- By Application
- By End Use
- By Grade
- South Africa
- Pricing Analysis
- Market Share Analysis, 2025
- By Sales Channel
- By Product Type
- By Application
- By End Use
- By Grade
- USA
- Market Structure Analysis
- Competition Dashboard
- Competition Benchmarking
- Market Share Analysis of Top Players
- By Regional
- By Sales Channel
- By Product Type
- By Application
- By End Use
- By Grade
- Emerging Startups
- Innovation Benchmarking
- Competition Analysis
- Competition Deep Dive
- ExxonMobil
- Overview
- Product Portfolio
- Profitability by Market Segments
- Sales Footprint
- Strategy Overview
- Marketing Strategy
- Product Strategy
- Channel Strategy
- ARLANXEO
- Reliance Industries
- Reliance Sibur Elastomers
- SIBUR
- Sinopec
- Japan Butyl
- ExxonMobil
- Case Studies
- Success Stories
- Recent Developments
- Competition Deep Dive
- Assumptions & Acronyms Used


