
- Market Size (2026)
- USD 984.0 Bn
- Forecast (2036)
- USD 2483.5 Bn
- CAGR (2026 to 2036)
- 9.7%
How big is Healthy Food Market in 2026?
Sales in the healthy food market are projected to grow at 9.7% CAGR, with the market size rising from USD 897.0 billion in 2025 to USD 984.0 billion in 2026 and reaching USD 2,483.5 billion by 2036.
Shifting dietary habits among urban households have surged the scrutiny of nutrition labels during routine grocery visits, burdening food manufacturers with an added responsibility of reformulating processed staples to lower added sugars, sodium, and saturated fats without degrading shelf stability. Managing household nutrition is a critical task, as balancing daily caloric requirements with clean-label transparency directly influences purchasing decisions across mainstream supermarkets. This generates a continuous need for certified healthy food products, which can balance dietary health benefits with familiar culinary taste profiles and affordable portion formats.
According to Future Market Insights analysis, the global healthy food market stands at USD 897.0 billion in 2025 and rises to USD 984.0 billion in 2026. Industry valuation is projected to reach USD 2,483.5 billion by 2036, expanding at a 9.7% CAGR and generating USD 1,499.5 billion in added revenue over the forecast period. Organic foods lead product consumption with a 38.0% share in 2026, while hypermarkets and supermarkets hold 48.0% of distribution channel revenue, owing to verified third-party seals and routine grocery footfall. In February 2025, official market monitoring disclosures from the Organic Trade Association documented that total certified organic sales grew by 5.2% to reach USD 71.6 billion, expanding at more than twice the pace of the total food marketplace.
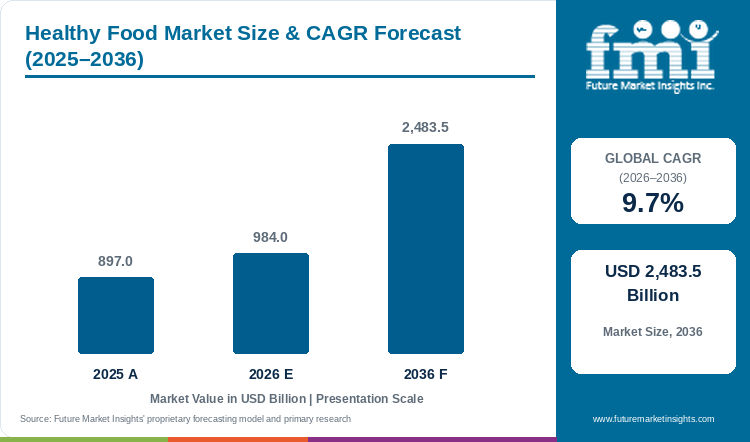
Key Market Trends & Insights
- By product type: Organic foods are projected to account for 38.0% in 2026, driven by certification-led trust and demand for simpler ingredient profiles.
- By distribution channel: Hypermarkets and supermarkets are estimated to hold 48.0% in 2026, supported by broad assortment and routine grocery traffic.
- Functional foods are gaining use as buyers seek products linked to digestive health, protein intake, immunity, and daily energy.
- Plant-based formats continue to widen category participation among vegan, vegetarian, and flexitarian households.
Regional Highlights
- Fastest-growing evaluated country: Japan, at 10.6% CAGR from 2026 to 2036.
- South Korea at 10.3%, Australia at 10.0%, and the USA at 9.8% follow, while France records 8.7%.
Market Size & Forecast
Table 1: Market Size and Forecast for the Healthy Food Market (USD billion and CAGR percentage), 2025 to 2036
| Metric | Value |
|---|---|
| 2025 Market Size | USD 897.0 billion |
| Estimated Market Size in 2026 | USD 984.0 billion |
| Projected Market Size by 2036 | USD 2,483.5 billion |
| CAGR, 2026 to 2036 | 9.7% |
| Added Revenue, 2026 to 2036 | USD 1,499.5 billion |
Commercial conditions differ across the profiled countries owing to statutory nutritional labeling mandates and enforcement standards. Changing the word healthy on a package is not sufficient when the product continues to carry higher added sugar, saturated fat or sodium. The United States Food and Drug Administration finalized its updated healthy nutrient-content claim regulations in February 2025, establishing an effective compliance date of April 28, 2025. This regulatory enforcement compels substantial product reformulation and packaging redesign, because losing the statutory claim directly eliminates the premium front-of-pack merchandising advantage that supports higher retail price points.
Organic Demand and Retail Conversion Sizing
Table 2: Organic Demand and Retail Conversion Sizing for the Healthy Food Market (USD billion and percentages), 2025 to 2036
| Metric | 2025 | 2026 | 2036 |
|---|---|---|---|
| Market size (USD billion) | 897.0 | 984.0 | 2,483.5 |
| Organic foods share | 38.0% | 38.0% | 38.0% |
| Organic foods revenue (USD billion) | 340.9 | 373.9 | 943.7 |
| Non-organic healthy foods revenue | 556.1 | 610.1 | 1,539.8 |
Per Capita and Retail Channel Sizing
Healthy food purchases are moving into monthly and weekly grocery planning as supermarkets are giving organic, functional and plant-based products space beside conventional foods. This placement matters because the consumer can compare price, pack size and nutrition in a single visit. Online ordering can support replenishment for shelf-stable products; however, stores will remain important for fresh food where appearance, expiry and cold handling influence the final purchase. Demand from adjacent online grocery ordering is also widening the number of products competing for the same household budget.
Table 3: Per Capita Spending Indicators for the Healthy Food Market (USD), 2025 to 2036
| Metric | 2025 | 2026 | 2036 |
|---|---|---|---|
| World population (billion) | 8.23 | 8.30 | 8.95 |
| Spend per capita (USD) | 108.99 | 118.55 | 277.49 |
| Spend per 1,000 people (USD) | 108,991 | 118,554 | 277,486 |
Table 4: Retail Channel Spending Indicators for the Healthy Food Market (USD billion and percentages), 2026
| Metric | Value | Basis |
|---|---|---|
| Market size, 2026 | USD 984.0 billion | Report-derived value |
| Hypermarket and supermarket share | 48.0% | Reported leading channel share |
| Channel revenue, 2026 | USD 472.3 billion | Calculated from 48.0% share |
| Other channels revenue, 2026 | USD 511.7 billion | Calculated balance |
Analyst Perspective
“Healthy food demand is shifting from specialist wellness aisles into regular household baskets. Brands pairing credible claims with affordable formats will secure repeat purchases across mainstream retail.”
- Nandini Roy Choudhury, Principal Consultant, Future Market Insights.
How is the Healthy Food Market segmented?
The healthy food market is segmented by product type and distribution channel.
By product type: Organic Foods, Functional Foods, Better-for-You Foods, and Others.
By distribution channel: Hypermarkets / Supermarkets, Convenience Stores, Specialty Stores, Online Retailers, and Others.
Why do Organic Foods lead the product type category?
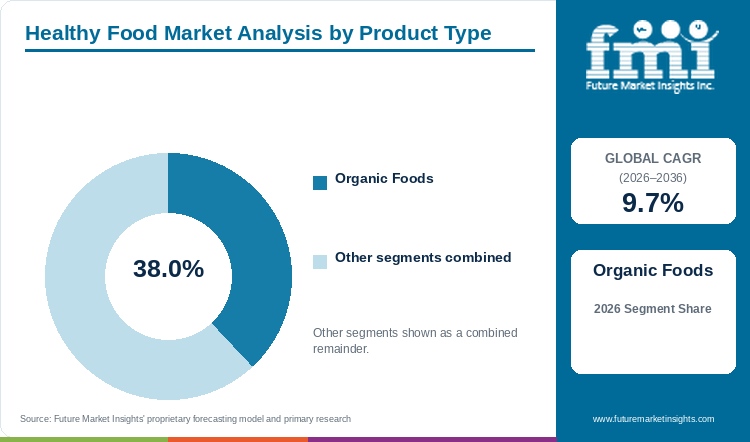
Organic foods represent 38.0% of product type in 2026, pairing certification-led trust with recognizable ingredient expectations.
Table 5: Product Type Share for the Healthy Food Market (percentage share), 2026
| Product Type | Share (2026) |
|---|---|
| Organic Foods | 38.0% |
| Other Segments Combined | 62.0%* |
| Total | 100.0% |
Table 6: Product Type Leadership and Market Growth for the Healthy Food Market, 2026 to 2036
| Metric | Value |
|---|---|
| Global CAGR (2026 to 2036) | 9.7% |
| Leading Segment | Organic Foods |
Certification is supporting the lead of organic foods because it gives the consumer a visible basis for separating the product from loosely used natural claims. The 38.0% share in 2026 indicates that this assurance is strong enough to cross produce, dairy and packaged food, while private labels are helping to reduce the price gap. Growth can still slow where certification cost and segregated handling are passed fully into retail price.
- Based on product type, organic foods are projected to account for 38.0% in 2026, supported by certification and cleaner labels.
- The 2025 Organic Market Report recorded USD 71.6 billion in United States organic sales for 2024.
What gives Hypermarkets and Supermarkets the leading distribution position?
Hypermarkets and supermarkets account for 48.0% of distribution in 2026, supported by assortment depth and routine grocery visits.
Hypermarkets and supermarkets are holding 48.0% of distribution in 2026 because healthy food is increasingly purchased with the normal household basket rather than through a separate wellness trip. Wide refrigeration and shelf capacity allows fresh produce, dairy alternatives and functional beverages to remain together, while retailer-owned brands can offer a lower entry price. The channel may lose some repeat orders to online retail, but fresh selection and immediate comparison will continue to protect its leading position.
- By distribution channel, hypermarkets and supermarkets are estimated to hold 48.0% in 2026, underpinned by broad availability.
- Retailers increasingly organize healthy food around claim clarity, convenience, and accessible pack sizes.
What are the drivers, restraints, and opportunities in the Healthy Food Market?
Health awareness lifts routine demand, while premium pricing restricts access, and credible functional formats create wider household value.
- Driver: Consumers increasingly connect daily diet quality with weight management, digestive health, cardiovascular wellness, and healthy aging.
- Restraint: Organic certification, premium ingredients, cold-chain needs, and shorter shelf life create higher retail prices and waste exposure.
- Opportunity: Affordable private labels, functional nutrition, personalized formats, and online replenishment can widen household participation.
Growth Analysis and Future Potential: Qualitative Demand Catalysts
Increasing health awareness is supporting the market, but awareness converts into revenue only where the product fits an eating habit already followed by households. The 5.2% rise in United States organic sales during 2024, which was two times the growth of the total food marketplace, indicates that certification and wider retail access are producing actual purchase and not only interest. Protein breakfasts, lower-sugar snacks and probiotic dairy can therefore grow faster when taste remains familiar and the buyer is not required to change the complete diet. Demand from adjacent probiotic food products is also widening the number of products competing for the same household budget.
Risk Assessment of the Healthy Food Market: Pricing and Claim Friction
Premium pricing is the principal hurdle because organic certification, segregated sourcing, testing and a shorter selling window can raise cost before the product reaches the shelf. Claim compliance adds another expense as food-group requirements and nutrient limits can require reformulation or removal of a package claim. Smaller companies can face more pressure, as one recipe change may also require testing, packaging and shelf-life work across a limited sales base.
Commercial Opportunity Analysis: Functional Nutrition and Accessible Formats
Commercial opportunity is likely to remain stronger in products that improve a meal already eaten by the consumer. Protein breakfast products, probiotic dairy, fiber snacks and portion-controlled meals require less behaviour change than an unfamiliar wellness format. Smaller packs can support trial and family packs can lower unit cost; however, repeated purchase will depend on taste and price after the first health-led purchase. Online replenishment will work better for products having predictable use, while fresh formats will require dependable cold handling and local availability. Demand from adjacent functional food demand is also widening the number of products competing for the same household budget.
Healthy Food Market by Country (2026 to 2036)
Country growth is not expected to follow one common pattern. Japan leads the evaluated countries at 10.6% CAGR due to familiarity with functional foods and an ageing consumer base, while France records 8.7% as taste and preference for less processed food can slow highly formulated products. South Korea and Australia remain above the global rate for different reasons, the first through digital convenience and the second through established health-oriented retail. This difference indicates that local eating habits and route to market will decide adoption more than a common global health message.
Table 7: Country CAGR and Primary Growth Levers for the Healthy Food Market, 2026 to 2036
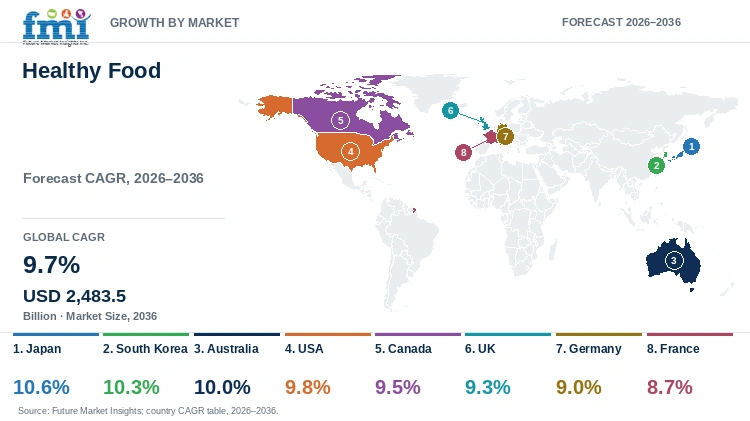
| Country | CAGR (2026 to 2036) | Primary Growth Lever |
|---|---|---|
| Japan | 10.6% | Healthy aging demand and functional food familiarity |
| South Korea | 10.3% | Convenience formats and strong online grocery adoption |
| Australia | 10.0% | Organic access and active health-oriented retail |
| USA | 9.8% | Label reformulation and broad functional-food assortment |
| Canada | 9.5% | Clean-label demand and mainstream natural-food distribution |
| UK | 9.3% | Retailer private labels and nutrition-led product reformulation |
| Germany | 9.0% | Large organic retail base and certification awareness |
| France | 8.7% | Nutrition policy and preference for minimally processed foods |
Japan Healthy Food Market Outlook (2026 to 2036)
Japan can remain the fastest-growing evaluated country at 10.6% CAGR because functional foods are already familiar to consumers and healthy ageing gives the product a continuing use occasion rather than a short trend. Dense convenience retail supports smaller packs and frequent purchase, which is different from markets depending mainly on large weekly baskets. Imported organic food may remain expensive after freight and currency movement; therefore, locally made formats with familiar taste and carefully supported benefit claims are more likely to widen adoption. Demand from adjacent fortified food products is also widening the number of products competing for the same household budget.
- Key takeaway: In Japan, healthy aging demographics and established functional food standards create a dependable commercial framework for certified nutritional products.
South Korea Healthy Food Market Outlook (2026 to 2036)
South Korea is anticipated to rise at 10.3% CAGR as online grocery and convenience-led eating allow a new healthy format to reach consumers quickly. Portable protein, lower-sugar snacks and ready meals can be tested in small packs, and sales data can show early whether the flavour is working. The hurdle is not product discovery but strong domestic competition and rapid replacement of weak listings. Brands that localize taste and maintain delivery availability can gain, while imported premium products may struggle when the price difference is not supported by a clear benefit. Demand from adjacent healthy snacks is also widening the number of products competing for the same household budget.
- Key takeaway: In South Korea, high-density digital grocery fulfillment and convenience-led eating occasions drive rapid retail adoption of single-serve healthy meal solutions.
Australia Healthy Food Market Outlook (2026 to 2036)
Australia is forecast to expand at 10.0% CAGR as health-oriented supermarkets and established organic awareness provide a ready shelf for certified products. The difficulty is distance, because cold-chain movement outside major cities can add cost and make fresh formats less reliable. Shelf-stable products and regional distribution can reduce this pressure, while private labels can bring organic and better-for-you food closer to normal grocery pricing. Demand is therefore expected to improve where sourcing remains visible but availability does not break between urban and regional markets.
- Key takeaway: In Australia, high organic certification awareness and dedicated health retail chains expand market access despite inland cold-chain logistics friction.
USA Healthy Food Market Outlook (2026 to 2036)
The United States market is estimated to rise at 9.8% CAGR, but the route to growth will be shaped by reformulation more than simple product launch. Consumers already compare added sugar, sodium, protein and ingredient lists, while changing claim requirements raise the standard for front-of-pack positioning. Large companies can divide testing and label cost across broad portfolios; smaller brands may need fewer claims and fewer stock-keeping units. Products able to improve nutrition without losing taste or shelf life can gain stronger mainstream retail support.
- Key takeaway: In the USA, strict FDA nutrient-content claim updates compel nationwide brand reformulation across mainstream grocery categories.
Canada Healthy Food Market Outlook (2026 to 2036)
Canada is projected to record 9.5% CAGR as clean-label demand is moving through mainstream grocers and not only natural-food stores. Bilingual packaging and long distribution routes make entry more costly for a small supplier, particularly when a fresh product must serve several regions. Concentrated assortments and partnerships with established distributors can reduce this burden. Plant-based and organic private labels may also support adoption by narrowing price gaps, while products built around familiar meals are likely to retain demand better than narrow wellness trends. Demand from adjacent natural food products is also widening the number of products competing for the same household budget.
- Key takeaway: In Canada, mainstream supermarket expansion of private-label organic lines narrows price differentials for health-conscious households.
UK Healthy Food Market Outlook (2026 to 2036)
The United Kingdom is predicted to advance at 9.3% CAGR, with retailers having greater control over price and claim presentation through private labels. Household budget pressure can hold back products carrying a large organic or functional premium, even when the health benefit is understood. Tiered ranges and smaller packs may keep the entry price manageable, while reformulating a familiar food can work better than asking households to adopt a new category. Suppliers meeting retailer cost targets without weakening taste are likely to gain wider volume. Demand from adjacent better-for-you foods is also widening the number of products competing for the same household budget.
- Key takeaway: In the UK, strong retailer private-label dominance and tiered value pricing facilitate healthy reformulation amid household budgetary pressures.
Germany Healthy Food Market Outlook (2026 to 2036)
Germany is estimated to post 9.0% CAGR as organic certification already has strong recognition and discount as well as specialist channels provide a wide route to market. This maturity also raises the standard expected from suppliers, since sourcing evidence, accurate packaging and audit continuity are closely considered. Price competition can limit the premium available to a new brand. Certified private-label supply and products connected with everyday meals may therefore grow more steadily than highly priced specialist formats.
- Key takeaway: In Germany, established Bio-Siegel organic certification standards and extensive discount retail networks provide steady category turnover.
France Healthy Food Market Outlook (2026 to 2036)
France is forecast to expand at 8.7% CAGR, the lowest among the evaluated countries, because a health claim alone may not compensate for a product that appears heavily processed or weak on taste. Short ingredient lists, recognizable recipes and origin-led positioning fit the local purchase decision better than broad wellness language. Reformulation also needs care, as reducing sugar, salt or saturated fat can affect a familiar flavour. Growth can improve where nutrition is added without making the product look separate from normal eating habits.
- Key takeaway: In France, strict culinary preference for minimally processed ingredients requires processors to balance clean nutritional profiles with authentic taste.
Full report country CAGRs cover: North America; Latin America; Western Europe; Eastern Europe; East Asia; South Asia and Pacific; Middle East and Africa.
Who are the notable companies in the Healthy Food Market?
Nestlé S.A., Danone S.A., PepsiCo, Inc., General Mills, Inc., Unilever PLC, Kellanova, Beyond Meat, Inc., and Impossible Foods are significant market players in this market.
Competition is divided between large food companies that can place healthier versions inside existing brands and specialists that depend on one clear proposition. Large manufacturers have an advantage in testing, reformulation and supermarket access, whereas focused businesses can move faster around organic or plant-based demand. Buyers will still judge both groups on taste, price and supply continuity, because a strong claim cannot retain shelf space when rotation remains weak.
- Diversified Nutrition Platforms: Nestlé, Danone, PepsiCo, General Mills, and Unilever compete across multiple food and beverage occasions.
- Breakfast and Snacking Platforms: Kellanova and General Mills use familiar brands to introduce protein, fiber, and lower-sugar formats.
- Plant-Based Specialists: Beyond Meat and Impossible Foods focus on alternatives designed for mainstream meal occasions.
Competitive Benchmarking: Healthy Food Market
Table 8: Competitive Benchmarking for the Healthy Food Market (qualitative capability ratings), 2026
| Company | Portfolio Breadth | Functional Nutrition | Retail Access | Geographic Reach |
|---|---|---|---|---|
| Nestlé S.A. | High | High | High | High |
| Danone S.A. | High | High | High | High |
| PepsiCo, Inc. | High | High | High | High |
| General Mills, Inc. | High | High | High | High |
| Unilever PLC | High | Medium | High | High |
| Kellanova | Medium | High | High | High |
| Beyond Meat, Inc. | Medium | High | Medium | High |
| Impossible Foods | Medium | High | Medium | Medium |
Key Developments in the Healthy Food Market
- In July 2025, Nestlé launched Milo Pro with three times more protein than traditional Milo drinks, initially in Indonesia and with a wider Southeast Asia rollout planned.
- In January 2025, PepsiCo completed the USD 1.2 billion acquisition of Siete Foods, expanding its portfolio of products made with simple ingredients.
- In January 2025, General Mills introduced Cheerios Protein with 8 grams of protein per serving as part of its new breakfast lineup.
Key Players in the Healthy Food Market
Diversified Food and Nutrition Platforms
- Nestlé S.A.
- Danone S.A.
- PepsiCo, Inc.
- General Mills, Inc.
- Unilever PLC
Breakfast and Snacking Platforms
- Kellanova
Plant-Based Specialists
- Beyond Meat, Inc.
- Impossible Foods
Healthy Food Market - Report Scope
Table 9: Report Scope for the Healthy Food Market, 2026 to 2036
| Coverage field | Report scope |
|---|---|
| Market breakdown | Product Type; Distribution Channel |
| Quantitative Units | USD Billion |
| Market Definition | Supplier revenue from organic, functional, better-for-you, and related health-oriented foods sold through listed channels. |
| Regions Covered | North America; Latin America; Western Europe; Eastern Europe; East Asia; South Asia and Pacific; Middle East and Africa |
| Countries Covered | Japan, South Korea, Australia, USA, Canada, UK, Germany, France, and additional countries |
| Key Companies Covered | Nestlé, Danone, PepsiCo, General Mills, Unilever, Kellanova, Beyond Meat, Impossible Foods |
| Forecast Period | 2026 to 2036 |
| Approach | Primary and secondary research with data triangulation. |
Healthy Food Market - Research Methodology
Table 10: Research Methodology for the Healthy Food Market, 2026 edition
| Method | Approach |
|---|---|
| Primary Research | Primary interviews were conducted with manufacturers, suppliers, distributors, healthcare professionals, industry experts, and key opinion leaders across the value chain to validate market trends, texture standardization protocols, demand dynamics, and purchasing decisions. |
| Secondary Research | Secondary research included company annual reports, investor presentations, regulatory publications, industry associations, technical papers, trade journals, company websites, product literature, and other publicly available sources relevant to the market. |
| Market Sizing and Forecasting | Market sizing and forecasting for the 2026 to 2036 forecast period were developed using top-down and bottom-up approaches to assess volume demand, price points, and institutional adoption trends. |
| Data Triangulation and Validation | Data is validated against macro-economic indicators, disease prevalence or relevant market drivers, regulatory landscape, and historical trend analysis to ensure high accuracy without double counting adjacent categories. |
Healthy Food Market by Segments
Healthy Food Market segmented by Product Type:
- Organic Foods
- Functional Foods
- Better-for-You Foods
- Others
Healthy Food Market segmented by Distribution Channel:
- Hypermarkets / Supermarkets
- Convenience Stores
- Specialty Stores
- Online Retailers
- Others
Healthy Food Market by Region
- North America
- United States
- Canada
- Latin America
- Brazil
- Mexico
- Argentina
- Chile
- Western Europe
- Germany
- France
- United Kingdom
- Italy
- Spain
- Benelux
- Nordics
- Eastern Europe
- Poland
- Czech Republic
- Romania
- Hungary
- East Asia
- Japan
- South Korea
- South Asia and Pacific
- India
- ASEAN
- Australia and New Zealand
- Middle East and Africa
- GCC Countries
- South Africa
- Türkiye
- Israel
Research Sources and Bibliography
- [1] Organic Trade Association. (2025). 2025 Organic Market Report: Growth, sector performance and retail sales indicators..
- [2] U.S. Food and Drug Administration. (2025, February 24). FDA finalizes updated 'healthy' nutrient content claim for food labeling..
- [3] Danone India. (2025, March 20). Protinex introduces convenient sachets to make daily protein intake accessible in India..
- [4] Future Market Insights. (2025, January 22). Healthy Food Market Growth, Wellness Trends & Industry Insights..
- [5] U.S. Department of Agriculture, Economic Research Service. (2025, February 5). Organic Situation Report, 2025 Edition: Production, markets, and consumer trends..
- [6] Research Institute of Organic Agriculture (FiBL) & IFOAM Organics International. (2025). The World of Organic Agriculture: Statistics and emerging trends 2025..
- [7] Statistics Bureau of Japan. (2025). Population estimates and demographic indicators of Japan..
- [8] Statistics Korea. (2025). Population and household indicators: Senior consumption and grocery retail report..
- [9] Australian Bureau of Statistics. (2025). National population and household statistics: Food expenditure analysis..
- [10] United States Department of Agriculture. (2025). Organic agriculture and market information summary..
- [11] Statistics Canada. (2025). Population estimates and household indicators: Annual demographic report..
- [12] Office for National Statistics. (2025). Population estimates for the United Kingdom: Family spending and nutrition..
- [13] Federal Statistical Office of Germany. (2025). Population and household statistics: Retail grocery trends..
- [14] National Institute of Statistics and Economic Studies. (2025). Demographic and household indicators for France: Food consumption survey..
- [15] Nestlé S.A. (2025, July 22). Nestlé launches high-protein Milo Pro to energize active teens and young adults..
- [16] Nestlé S.A. (2025, June 2). Nestlé’s groundbreaking Sinergity early-life nutrition platform goes global..
- [17] PepsiCo, Inc. (2025, January 17). PepsiCo completes acquisition of Siete Foods to broaden clean-label Mexican-American food portfolio..
- [18] General Mills, Inc. (2025, January 15). Kickstart your mornings with an exciting new high-protein breakfast lineup for 2025..
- [19] PepsiCo, Inc. (2025, May 19). PepsiCo completes acquisition of poppi, accelerating strategic prebiotic beverage transformation..
- [20] Kellanova. (2025). Annual report and better-for-you snack portfolio disclosures..
- [21] Beyond Meat, Inc. (2025). Annual report, heart-healthy certification, and plant-based product disclosures..
This bibliography is provided for reader reference and is not exhaustive. The full report contains detailed sources and citations.
This Report Answers
- How large is the healthy food market in 2026 and what is forecast for 2036?
- Which health and retail pressures support market demand?
- Why do organic foods lead product demand?
- Why do hypermarkets and supermarkets lead distribution?
- How do country growth rates differ across evaluated economies?
- Which companies compete across healthy food categories?
- What limits household adoption and supplier switching?
- What should buyers evaluate before selecting healthy food products?
Table of Content
- Key Takeaways
- Market Size and CAGR
- Top Growth Driver
- Fastest Growing Segment
- Leading Region
- Key Companies
- Emerging Opportunities
- Executive Summary
- Global Market Outlook
- Demand-side Trends
- Supply-side Trends
- Technology Roadmap Analysis
- Analysis and Recommendations
- Analyst Perspective (What is happening? Why now? What should investors know?)
- Key Questions Answered
- How large is the market?
- What is the CAGR?
- What are key trends?
- Which region dominates?
- Who are the leaders?
Read More...
- Market Overview
- Market Coverage / Taxonomy
- Market Definition / Scope / Limitations
- Research Methodology
- Chapter Orientation
- Analytical Lens and Working Hypotheses
- Market Structure, Signals, and Trend Drivers
- Benchmarking and Cross-market Comparability
- Market Sizing, Forecasting, and Opportunity Mapping
- Research Design and Evidence Framework
- Desk Research Programme (Secondary Evidence)
- Expert Input and Fieldwork (Primary Evidence)
- Tooling, Models, and Reference Databases
- Data Engineering and Model Build
- Quality Assurance and Audit Trail
- Market Background
- Market Dynamics (Drivers, Restraints, Opportunity, Trends)
- Scenario Forecast (Optimistic, Likely, Conservative)
- Impact Analysis
- AI Impact
- Sustainability Impact
- Regulatory Impact
- Technology Impact
- Consumer / Buyer Analysis
- Purchase Drivers
- Adoption Barriers
- Buyer Journey
- Opportunity Map Analysis
- Product Life Cycle Analysis
- Supply Chain Analysis
- Investment Feasibility Matrix
- Value Chain Analysis
- PESTLE and Porter's Analysis
- Regulatory Landscape
- Regional Parent Market Outlook
- Production and Consumption Statistics
- Import and Export Statistics
- Global Market Analysis and Forecast, 2021 to 2036
- Historical Market Size Value (USD Billion) Analysis, 2021 to 2025
- Current and Future Market Size Value (USD Billion) Projections, 2026 to 2036
- Y-o-Y Growth Trend Analysis
- Absolute $ Opportunity Analysis
- Global Market Pricing Analysis, 2021 to 2036
- Global Market Analysis and Forecast, By Product Type, 2021 to 2036
- Introduction / Key Findings
- Historical Market Size Value (USD Billion) Analysis By Product Type, 2021 to 2025
- Current and Future Market Size Value (USD Billion) Analysis and Forecast By Product Type, 2026 to 2036
- Organic Foods
- Functional Foods
- Better-for-You Foods
- Others
- Y-o-Y Growth Trend Analysis By Product Type, 2021 to 2025
- Absolute $ Opportunity Analysis By Product Type, 2026 to 2036
- Global Market Analysis and Forecast, By Distribution Channel, 2021 to 2036
- Introduction / Key Findings
- Historical Market Size Value (USD Billion) Analysis By Distribution Channel, 2021 to 2025
- Current and Future Market Size Value (USD Billion) Analysis and Forecast By Distribution Channel, 2026 to 2036
- Hypermarkets / Supermarkets
- Convenience Stores
- Specialty Stores
- Online Retailers
- Others
- Y-o-Y Growth Trend Analysis By Distribution Channel, 2021 to 2025
- Absolute $ Opportunity Analysis By Distribution Channel, 2026 to 2036
- Global Market Analysis and Forecast, By Region, 2021 to 2036
- Introduction
- Historical Market Size Value (USD Billion) Analysis By Region, 2021 to 2025
- Current Market Size Value (USD Billion) Analysis and Forecast By Region, 2026 to 2036
- North America
- Latin America
- Western Europe
- Eastern Europe
- East Asia
- South Asia and Pacific
- Middle East and Africa
- Market Attractiveness Analysis By Region
- North America Market Analysis and Forecast, By Country, 2021 to 2036
- Historical Market Size Value (USD Billion) Trend Analysis By Market Taxonomy, 2021 to 2025
- Market Size Value (USD Billion) Forecast By Market Taxonomy, 2026 to 2036
- By Country
- United States
- Canada
- By Product Type
- By Distribution Channel
- By Country
- Market Attractiveness Analysis
- By Country
- By Product Type
- By Distribution Channel
- Key Takeaways
- Latin America Market Analysis and Forecast, By Country
- Historical Market Size Value (USD Billion) Trend Analysis By Market Taxonomy, 2021 to 2025
- Market Size Value (USD Billion) Forecast By Market Taxonomy, 2026 to 2036
- By Country
- Brazil
- Mexico
- Argentina
- Chile
- By Product Type
- By Distribution Channel
- By Country
- Market Attractiveness Analysis
- By Country
- By Product Type
- By Distribution Channel
- Key Takeaways
- Western Europe Market Analysis and Forecast, By Country
- Historical Market Size Value (USD Billion) Trend Analysis By Market Taxonomy, 2021 to 2025
- Market Size Value (USD Billion) Forecast By Market Taxonomy, 2026 to 2036
- By Country
- Germany
- France
- United Kingdom
- Italy
- Spain
- Benelux
- Nordics
- By Product Type
- By Distribution Channel
- By Country
- Market Attractiveness Analysis
- By Country
- By Product Type
- By Distribution Channel
- Key Takeaways
- Eastern Europe Market Analysis and Forecast, By Country
- Historical Market Size Value (USD Billion) Trend Analysis By Market Taxonomy, 2021 to 2025
- Market Size Value (USD Billion) Forecast By Market Taxonomy, 2026 to 2036
- By Country
- Poland
- Czech Republic
- Romania
- Hungary
- By Product Type
- By Distribution Channel
- By Country
- Market Attractiveness Analysis
- By Country
- By Product Type
- By Distribution Channel
- Key Takeaways
- East Asia Market Analysis and Forecast, By Country
- Historical Market Size Value (USD Billion) Trend Analysis By Market Taxonomy, 2021 to 2025
- Market Size Value (USD Billion) Forecast By Market Taxonomy, 2026 to 2036
- By Country
- Japan
- South Korea
- By Product Type
- By Distribution Channel
- By Country
- Market Attractiveness Analysis
- By Country
- By Product Type
- By Distribution Channel
- Key Takeaways
- South Asia and Pacific Market Analysis and Forecast, By Country
- Historical Market Size Value (USD Billion) Trend Analysis By Market Taxonomy, 2021 to 2025
- Market Size Value (USD Billion) Forecast By Market Taxonomy, 2026 to 2036
- By Country
- India
- ASEAN
- Australia and New Zealand
- By Product Type
- By Distribution Channel
- By Country
- Market Attractiveness Analysis
- By Country
- By Product Type
- By Distribution Channel
- Key Takeaways
- Middle East and Africa Market Analysis and Forecast, By Country
- Historical Market Size Value (USD Billion) Trend Analysis By Market Taxonomy, 2021 to 2025
- Market Size Value (USD Billion) Forecast By Market Taxonomy, 2026 to 2036
- By Country
- GCC Countries
- South Africa
- Türkiye
- Israel
- By Product Type
- By Distribution Channel
- By Country
- Market Attractiveness Analysis
- By Country
- By Product Type
- By Distribution Channel
- Key Takeaways
- Key Countries Market Analysis
- United States
- Pricing Analysis
- Market Share Analysis, 2025
- By Product Type
- By Distribution Channel
- Canada
- Pricing Analysis
- Market Share Analysis, 2025
- By Product Type
- By Distribution Channel
- Mexico
- Pricing Analysis
- Market Share Analysis, 2025
- By Product Type
- By Distribution Channel
- Brazil
- Pricing Analysis
- Market Share Analysis, 2025
- By Product Type
- By Distribution Channel
- Chile
- Pricing Analysis
- Market Share Analysis, 2025
- By Product Type
- By Distribution Channel
- Germany
- Pricing Analysis
- Market Share Analysis, 2025
- By Product Type
- By Distribution Channel
- United Kingdom
- Pricing Analysis
- Market Share Analysis, 2025
- By Product Type
- By Distribution Channel
- Italy
- Pricing Analysis
- Market Share Analysis, 2025
- By Product Type
- By Distribution Channel
- Spain
- Pricing Analysis
- Market Share Analysis, 2025
- By Product Type
- By Distribution Channel
- France
- Pricing Analysis
- Market Share Analysis, 2025
- By Product Type
- By Distribution Channel
- India
- Pricing Analysis
- Market Share Analysis, 2025
- By Product Type
- By Distribution Channel
- ASEAN
- Pricing Analysis
- Market Share Analysis, 2025
- By Product Type
- By Distribution Channel
- Australia and New Zealand
- Pricing Analysis
- Market Share Analysis, 2025
- By Product Type
- By Distribution Channel
- Japan
- Pricing Analysis
- Market Share Analysis, 2025
- By Product Type
- By Distribution Channel
- South Korea
- Pricing Analysis
- Market Share Analysis, 2025
- By Product Type
- By Distribution Channel
- Poland
- Pricing Analysis
- Market Share Analysis, 2025
- By Product Type
- By Distribution Channel
- Hungary
- Pricing Analysis
- Market Share Analysis, 2025
- By Product Type
- By Distribution Channel
- Türkiye
- Pricing Analysis
- Market Share Analysis, 2025
- By Product Type
- By Distribution Channel
- South Africa
- Pricing Analysis
- Market Share Analysis, 2025
- By Product Type
- By Distribution Channel
- Australia
- Pricing Analysis
- Market Share Analysis, 2025
- By Product Type
- By Distribution Channel
- United States
- Market Structure Analysis
- Competition Dashboard
- Competition Benchmarking
- Market Share Analysis of Top Players
- By Regional
- By Product Type
- By Distribution Channel
- Emerging Startups
- Innovation Benchmarking
- Competition Analysis
- Competition Deep Dive
- Nestlé S.A.
- Overview
- Product Portfolio
- Profitability by Market Segments
- Sales Footprint
- Strategy Overview
- Marketing Strategy
- Product Strategy
- Channel Strategy
- Danone S.A.
- PepsiCo, Inc.
- General Mills, Inc.
- Unilever PLC
- Kellanova
- Beyond Meat, Inc.
- Impossible Foods
- Nestlé S.A.
- Case Studies
- Success Stories
- Recent Developments
- Competition Deep Dive
- Assumptions & Acronyms Used
List of Tables
- Table 1: Global Market Value (USD Billion) Forecast by Region, 2021 to 2036
- Table 2: Global Market Value (USD Billion) Forecast by Product Type, 2021 to 2036
- Table 3: Global Market Value (USD Billion) Forecast by Distribution Channel, 2021 to 2036
- Table 4: North America Market Value (USD Billion) Forecast by Country, 2021 to 2036
- Table 5: North America Market Value (USD Billion) Forecast by Product Type, 2021 to 2036
- Table 6: North America Market Value (USD Billion) Forecast by Distribution Channel, 2021 to 2036
- Table 7: Latin America Market Value (USD Billion) Forecast by Country, 2021 to 2036
- Table 8: Latin America Market Value (USD Billion) Forecast by Product Type, 2021 to 2036
- Table 9: Latin America Market Value (USD Billion) Forecast by Distribution Channel, 2021 to 2036
- Table 10: Western Europe Market Value (USD Billion) Forecast by Country, 2021 to 2036
- Table 11: Western Europe Market Value (USD Billion) Forecast by Product Type, 2021 to 2036
- Table 12: Western Europe Market Value (USD Billion) Forecast by Distribution Channel, 2021 to 2036
- Table 13: Eastern Europe Market Value (USD Billion) Forecast by Country, 2021 to 2036
- Table 14: Eastern Europe Market Value (USD Billion) Forecast by Product Type, 2021 to 2036
- Table 15: Eastern Europe Market Value (USD Billion) Forecast by Distribution Channel, 2021 to 2036
- Table 16: East Asia Market Value (USD Billion) Forecast by Country, 2021 to 2036
- Table 17: East Asia Market Value (USD Billion) Forecast by Product Type, 2021 to 2036
- Table 18: East Asia Market Value (USD Billion) Forecast by Distribution Channel, 2021 to 2036
- Table 19: South Asia and Pacific Market Value (USD Billion) Forecast by Country, 2021 to 2036
- Table 20: South Asia and Pacific Market Value (USD Billion) Forecast by Product Type, 2021 to 2036
- Table 21: South Asia and Pacific Market Value (USD Billion) Forecast by Distribution Channel, 2021 to 2036
- Table 22: Middle East and Africa Market Value (USD Billion) Forecast by Country, 2021 to 2036
- Table 23: Middle East and Africa Market Value (USD Billion) Forecast by Product Type, 2021 to 2036
- Table 24: Middle East and Africa Market Value (USD Billion) Forecast by Distribution Channel, 2021 to 2036
List of Figures
- Figure 1: Global Market Pricing Analysis
- Figure 2: Global Market Value (USD Billion) Forecast 2021-2036
- Figure 3: Global Market Value Share and BPS Analysis by Product Type, 2026 and 2036
- Figure 4: Global Market Y-o-Y Growth Comparison by Product Type, 2026-2036
- Figure 5: Global Market Attractiveness Analysis by Product Type
- Figure 6: Global Market Value Share and BPS Analysis by Distribution Channel, 2026 and 2036
- Figure 7: Global Market Y-o-Y Growth Comparison by Distribution Channel, 2026-2036
- Figure 8: Global Market Attractiveness Analysis by Distribution Channel
- Figure 9: Global Market Value (USD Billion) Share and BPS Analysis by Region, 2026 and 2036
- Figure 10: Global Market Y-o-Y Growth Comparison by Region, 2026-2036
- Figure 11: Global Market Attractiveness Analysis by Region
- Figure 12: North America Market Incremental Dollar Opportunity, 2026-2036
- Figure 13: Latin America Market Incremental Dollar Opportunity, 2026-2036
- Figure 14: Western Europe Market Incremental Dollar Opportunity, 2026-2036
- Figure 15: Eastern Europe Market Incremental Dollar Opportunity, 2026-2036
- Figure 16: East Asia Market Incremental Dollar Opportunity, 2026-2036
- Figure 17: South Asia and Pacific Market Incremental Dollar Opportunity, 2026-2036
- Figure 18: Middle East and Africa Market Incremental Dollar Opportunity, 2026-2036
- Figure 19: North America Market Value Share and BPS Analysis by Country, 2026 and 2036
- Figure 20: North America Market Value Share and BPS Analysis by Product Type, 2026 and 2036
- Figure 21: North America Market Y-o-Y Growth Comparison by Product Type, 2026-2036
- Figure 22: North America Market Attractiveness Analysis by Product Type
- Figure 23: North America Market Value Share and BPS Analysis by Distribution Channel, 2026 and 2036
- Figure 24: North America Market Y-o-Y Growth Comparison by Distribution Channel, 2026-2036
- Figure 25: North America Market Attractiveness Analysis by Distribution Channel
- Figure 26: Latin America Market Value Share and BPS Analysis by Country, 2026 and 2036
- Figure 27: Latin America Market Value Share and BPS Analysis by Product Type, 2026 and 2036
- Figure 28: Latin America Market Y-o-Y Growth Comparison by Product Type, 2026-2036
- Figure 29: Latin America Market Attractiveness Analysis by Product Type
- Figure 30: Latin America Market Value Share and BPS Analysis by Distribution Channel, 2026 and 2036
- Figure 31: Latin America Market Y-o-Y Growth Comparison by Distribution Channel, 2026-2036
- Figure 32: Latin America Market Attractiveness Analysis by Distribution Channel
- Figure 33: Western Europe Market Value Share and BPS Analysis by Country, 2026 and 2036
- Figure 34: Western Europe Market Value Share and BPS Analysis by Product Type, 2026 and 2036
- Figure 35: Western Europe Market Y-o-Y Growth Comparison by Product Type, 2026-2036
- Figure 36: Western Europe Market Attractiveness Analysis by Product Type
- Figure 37: Western Europe Market Value Share and BPS Analysis by Distribution Channel, 2026 and 2036
- Figure 38: Western Europe Market Y-o-Y Growth Comparison by Distribution Channel, 2026-2036
- Figure 39: Western Europe Market Attractiveness Analysis by Distribution Channel
- Figure 40: Eastern Europe Market Value Share and BPS Analysis by Country, 2026 and 2036
- Figure 41: Eastern Europe Market Value Share and BPS Analysis by Product Type, 2026 and 2036
- Figure 42: Eastern Europe Market Y-o-Y Growth Comparison by Product Type, 2026-2036
- Figure 43: Eastern Europe Market Attractiveness Analysis by Product Type
- Figure 44: Eastern Europe Market Value Share and BPS Analysis by Distribution Channel, 2026 and 2036
- Figure 45: Eastern Europe Market Y-o-Y Growth Comparison by Distribution Channel, 2026-2036
- Figure 46: Eastern Europe Market Attractiveness Analysis by Distribution Channel
- Figure 47: East Asia Market Value Share and BPS Analysis by Country, 2026 and 2036
- Figure 48: East Asia Market Value Share and BPS Analysis by Product Type, 2026 and 2036
- Figure 49: East Asia Market Y-o-Y Growth Comparison by Product Type, 2026-2036
- Figure 50: East Asia Market Attractiveness Analysis by Product Type
- Figure 51: East Asia Market Value Share and BPS Analysis by Distribution Channel, 2026 and 2036
- Figure 52: East Asia Market Y-o-Y Growth Comparison by Distribution Channel, 2026-2036
- Figure 53: East Asia Market Attractiveness Analysis by Distribution Channel
- Figure 54: South Asia and Pacific Market Value Share and BPS Analysis by Country, 2026 and 2036
- Figure 55: South Asia and Pacific Market Value Share and BPS Analysis by Product Type, 2026 and 2036
- Figure 56: South Asia and Pacific Market Y-o-Y Growth Comparison by Product Type, 2026-2036
- Figure 57: South Asia and Pacific Market Attractiveness Analysis by Product Type
- Figure 58: South Asia and Pacific Market Value Share and BPS Analysis by Distribution Channel, 2026 and 2036
- Figure 59: South Asia and Pacific Market Y-o-Y Growth Comparison by Distribution Channel, 2026-2036
- Figure 60: South Asia and Pacific Market Attractiveness Analysis by Distribution Channel
- Figure 61: Middle East and Africa Market Value Share and BPS Analysis by Country, 2026 and 2036
- Figure 62: Middle East and Africa Market Value Share and BPS Analysis by Product Type, 2026 and 2036
- Figure 63: Middle East and Africa Market Y-o-Y Growth Comparison by Product Type, 2026-2036
- Figure 64: Middle East and Africa Market Attractiveness Analysis by Product Type
- Figure 65: Middle East and Africa Market Value Share and BPS Analysis by Distribution Channel, 2026 and 2036
- Figure 66: Middle East and Africa Market Y-o-Y Growth Comparison by Distribution Channel, 2026-2036
- Figure 67: Middle East and Africa Market Attractiveness Analysis by Distribution Channel
- Figure 68: Global Market - Tier Structure Analysis
- Figure 69: Global Market - Company Share Analysis
Frequently Asked Questions
How big is the healthy food market in 2026, and what is forecast for 2036?
Future Market Insights estimates that the market will reach USD 984.0 billion in 2026 and USD 2,483.5 billion by 2036.
What is the CAGR from 2026 to 2036?
Future Market Insights projects a 9.7% CAGR over the assessment period.
Which product type leads?
Increasing preference for foods having visible certification and ingredients that can be understood without technical reading is pushing healthy food into regular grocery purchase. Organic foods are projected to hold 38.0% of product demand in 2026, while hypermarkets and supermarkets account for 48.0% of distribution, as both the product and the channel reduce doubt at the time of purchase. Functional nutrition and plant-based formats are widening the market further; however, price difference against conventional food will decide how much of this demand converts into repeat sales.
Which distribution channel leads?
Hypermarkets and supermarkets are estimated to account for 48.0% in 2026.
Which country has a notable growth outlook?
Japan is projected to register a 10.6% CAGR from 2026 to 2036.
Who are the key players?
Key participants include Nestlé, Danone, PepsiCo, General Mills, Unilever, Kellanova, Beyond Meat, and Impossible Foods.
Preview the report firsthand - request a free sample
Get SampleGet the brochure for pricing and purchase details.
Get PDF
