High Density Polyethylene (HDPE) Bottles Market
FMI Uncovers how Stringent Rules Associated with the Production Influences Sales of High Density Polyethylene (HDPE) Bottles. Discover More!
High Density Polyethylene (HDPE) Bottles Market By End Users, Sales Channel & Region - Forecast 2022-2032
High Density Polyethylene (HDPE) Bottles Outlook (2022-2032)
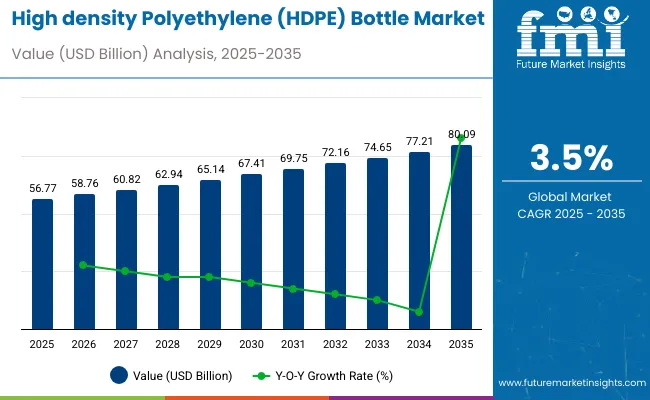
[309 Pages Report] The global high density polyethylene (HDPE) bottles hold a forecasted share of US$ 52533.5 million in 2022 and are likely to surpass US$ 73390.9 million by 2032, moving ahead with a CAGR of 3.4% during the forecast period.
High density polyethylene (HDPE) bottles are witnessing a rise in popularity for myriad reasons. Manufacturers are focusing on the pivotal trends that are expected to push the sales of HDPE bottles in the market. For instance, the trend of customized bottles is likely to greatly benefit the market. It assists end-users by designing and developing bottles that meet their specific criteria and requirements. It is further helpful to develop not only a custom-tailored bottle but also a supply program that optimizes packaging requirements through their supply chain.
Market players are offering several custom packaging options to their clients. These include:
- Screen Printing
- Shrink-Sleeve Labelling (Silkscreen Printing)
- In-Mould Labelling
- Decals
- Offset Printing
- Spray Coating & Frosting
- Hot Stamping (Roll Stamping)
- Acid Etching
- Barcodes
- Pad Printing
- Medallion & Wax Seal Application
Key market players are further benefiting from joint ventures to pool resources and reach a wider audience by increasing awareness regarding the virtues of the concerned product. HDPE bottles are preferred to be sold at an affordable price to reach the global audience. Moreover, as a large chunk of the working population seems to be travelling long distances for work, they require sturdy bottles. Hence, manufacturers are developing HDPE bottles that are super lightweight.
Report Attribute |
Details |
High Density Polyethylene (HDPE) Bottles Value (2022) |
US$ 52533.5 million |
High Density Polyethylene (HDPE) Bottles Anticipated Forecast Value (2032) |
US$ 73390.9 million |
High Density Polyethylene (HDPE) Bottles Projected Growth Rate (2022-2032) |
3.4% |
The addition of panelless technology to manufacturing HDPE bottles has been extremely valuable. Case in point, the ribs and panels in the sidewalls of traditional PET bottles have made it difficult for manufacturers to label in the past. Hence, panelless technology not only solves that issue but also allows bottles to withstand harsh temperatures, along with absorbing vacuum distortion, which enables the sidewalls to be moulded. This allows the manufacturers to achieve glass's performance, aesthetics, and feel.
According to research, the blow-moulding form segment was the largest in 2015. This particular type of HDPE bottle is highly desirable and offers excellent properties such as temperate resistance and tensile strength, which are estimated to expand their applications. Besides food and beverages, blow-moulding HDPE bottles are extensively used in lubricant packaging and pharmaceutical bottles.
Certain top providers are installing sprayers and dispensers, often with 300 microliters dosage in HDPE "Airless" Packaging or Bottles. By making them available in different volumes such as 50 ml, 100 ml, 200 ml, etc., these bottles come to be ideal for cosmetic products like creams and perfumes.
Let us know your requirement to get
100% FREE customization
What are the Key High Density Polyethylene (HDPE) Bottles Dynamics?
- Acceptance of Eco-friendly Bottles: The high density polyethylene (HDPE) bottle market continues to grow due to the increasing demand for eco-friendly packaging and the expanding use of high density polyethylene (HDPE) bottles in the domestic sector. Due to the easy recycling ability of HDPE plastic, this helps to keep non-biodegradable waste out of landfills, and the market for high density polyethylene (HDPE) bottles is expected to grow significantly in the future.
- Distinctive Properties: Unlike other materials, High-Density Polyethylene (HDPE) is highly resistant to mildew, mould, and rotting, which makes it the most suitable material for the production of bottles. In addition, HDPE bottles can be sterilized by boiling, so they are the perfect material for storing food and beverage products. Due to these properties, high-density polyethylene (HDPE) bottles are expected to increase in demand.
Manufacturing of Plastic Bottles is Subject to Strict Rules and Regulations:
It is also expected that the high density polyethylene (HDPE) bottle market will grow as a result of the strict rules and bans imposed by the government on the use of harmful plastic and the release of harmful chemicals and gases during the production process.
Additionally, the growing number of people travelling long distances for work and the need for easy-to-carry bottles that can handle their needs during the forecast period are likely to provide beneficial opportunities for the growth of the high density polyethylene (HDPE) bottles market.
Having many of the same properties as lightweight, tough against liquids and gases, highly transparent, available in different colours, and highly transparent have hindered HDPE bottles from being able to share the market. Moreover, PET bottles are comparatively cheaper than HDPE bottles and offer the same recycling rate. These are significant factors hindering the growth rate of the market.
Also, these bottles discharge estrogenic chemicals related to ordinary plastic and can harm human health. The high in human health due to the use of HDPE bottles may act as a market restraint for the growth of the high density polyethylene (HDPE) bottles market.
Find your sweet spots for generating winning opportunities in this market.
Talk to AnalystRegional Analysis
What is the Growth Outlook for the North America High Density Polyethylene (HDPE) Bottles Market?
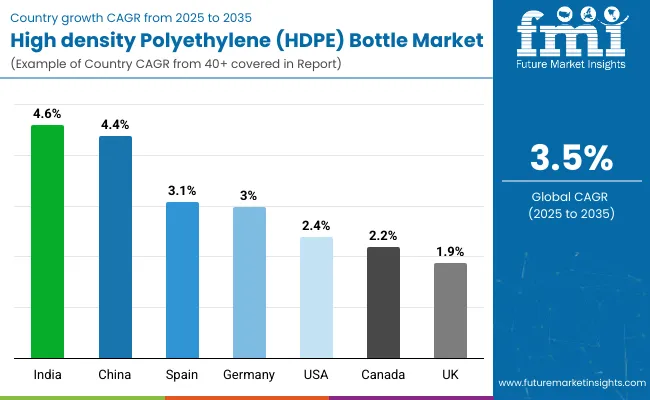
North America is estimated to capture a maximum share of the high density polyethylene (HDPE) bottles market, accounting for 27% of the overall market share. North America dominates the global market due to the stringent regulations and norms in using a particular grade of plastic bottles.
HDPE bottles have gained a substantial proportion due to their chemical composition, which poses the slightest threat to life and health. In the U.S., products such as fruit juices, milk, detergent, cleaners, etc. are now primarily packaged in HDPE bottles which the way are giving a massive boost to the HDPE bottles market. Europe is followed by North America market for HDPE bottles market following a similar trend as the U.S.
European High Density Polyethylene (HDPE) Bottles Market is a Promising One, but Why?
Europe is predicted to hold a market share of 23% of the global market for high density polyethylene (HDPE) bottles market. According to the Bottled Water Organization, the region prefers plastic containers for its drinking water. The growing demand for healthier food alternatives is also being met by fresh milk, considered more nutritious and beneficial than shelf-stable milk. Also, the fast-paced lifestyle encourages the region's working class to consume packaged drinks on the go. In the European region, many manufacturers of ready-to-drink beverages are using recycled HDPE bottles. According to PepsiCo Europe, which produces 7Up Free, Pepsi MAX, Tropicana, and other ready-to-drink beverages, its products will be made of 100% recycled plastic by 2022.
How is the Start-up Ecosystem in the High Density Polyethylene (HDPE) Bottles Market?
Recycled HDPE bottles are an emerging alternative that manufacturers are using to reduce dependence on raw material prices. The high raw material costs have been a significant factor hindering the wide adoption of HDPE bottles as packaging materials for many years, but manufacturers are gradually opting to use recycled HDPE material in the production of HDPE bottles to address this problem. Recently, Unilever launched a limited number of recycled HDPE bottles of a few Australian brands that are selling personal care products as well as home care products in the ANZ region. The brands involved in this project are Dove, Sunsilk, Surf, OMO, and TRESemmé.

A unified Market Research Subscription Platform, built for today's disparate research needs.
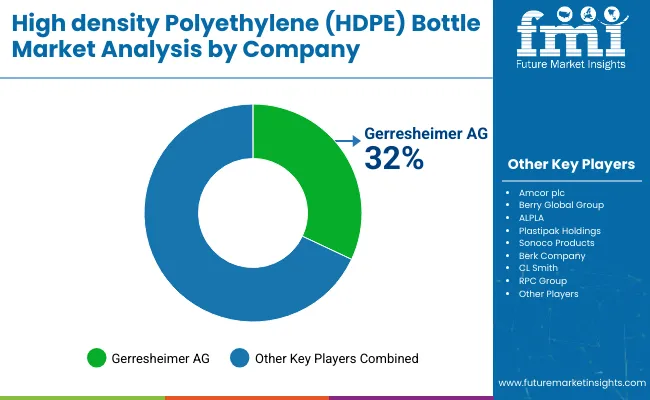
High Density Polyethylene (HDPE) Bottles Market: Competitive Landscape
High Density Polyethylene (HDPE) Bottles Market: Key Contracts/ Agreements/ Acquisitions/ Recent Developments
- A new line of Body Cleanser and Body Moisturizer bottles made from 100% recycled material is being launched by Berry Global Group in March 2022. Koa shares Berry Global's vision of creating a positive environmental impact through streamlined operations, continuously engaged partners, and optimized products.
- Greiner Packaging expanded its sanitiser bottle range in February 2022 to meet increased demand. There are 16 bottles in the updated product range, including sanitisers, with capacities ranging from 100 to 1000 millilitres. They have round bodies made of up to 100% r-PET and are manufactured using the ISBM process.
Who are the Key Players in the High-Density Polyethylene (HDPE) Bottles Market?
- Parker Plastics
- Graham Blowpack Pvt. Ltd.
- Vivek Polymer India
- Maynard & Harris Plastics
- CL Smith, All American Containers
- O.BERK COMPANY, LLC
- Alpha Packaging
- Kaufman Container
- Fisherbrand
Report Scope
Report Attribute |
Details |
Growth Rate |
CAGR of 3.4% from 2022 to 2032 |
Base Year for Estimation |
2022 |
Historical Data |
2016-2021 |
Forecast Period |
2022-2032 |
Quantitative Units |
Revenue in US$ Million and CAGR from 2022-2032 |
Report Coverage |
Revenue Forecast, Volume Forecast, Company Ranking, Competitive Landscape, Growth Factors, Trends and Pricing Analysis |
Segments Covered |
|
Regions Covered |
|
Key Countries Profiled |
|
Key Companies Profiled |
|
Customization |
Available Upon Request |
Key Segments Profiled in the High Density Polyethylene (HDPE) BottlesSurvey
By End Users:
- Domestic Use
- Chemical Industries
- Cosmetic Industries
- Pharmaceutical Industries
By Sales Channel:
- B2B
- B2C
By Region:
- North America
- Latin America
- The Asia Pacific
- MEA
- Europe
Frequently Asked Questions
The high density polyethylene (HDPE) bottles market’s growth potential can be valued at US$ 73390.9 Mn by 2032.
The market size of the global high density polyethylene (HDPE) bottles is projected to grow by US$ 52533.5 Mn in 2022.
The high density polyethylene (HDPE) bottles are expected to grow at a CAGR of 3.4% from 2022 to 2032.
North America is expected to hold the highest share in the global high density polyethylene (HDPE) bottles market.
Table of Content
1. Executive Summary
1.1. Global Market Outlook
1.2. Demand-side Trends
1.3. Supply-side Trends
1.4. Technology Roadmap Analysis
1.5. Analysis and Recommendations
2. Market Overview
2.1. Market Coverage / Taxonomy
2.2. Market Definition / Scope / Limitations
3. Market Background
3.1. Market Dynamics
3.1.1. Drivers
3.1.2. Restraints
3.1.3. Opportunity
3.1.4. Trends
3.2. Scenario Forecast
3.2.1. Demand in Optimistic Scenario
3.2.2. Demand in Likely Scenario
3.2.3. Demand in Conservative Scenario
3.3. Opportunity Map Analysis
3.4. Product Life Cycle Analysis
3.5. Supply Chain Analysis
3.5.1. Supply Side Participants and their Roles
3.5.1.1. Producers
3.5.1.2. Mid-Level Participants (Traders/ Agents/ Brokers)
3.5.1.3. Wholesalers and Distributors
3.5.2. Value Added and Value Created at Node in the Supply Chain
3.5.3. List of Raw Material Suppliers
3.5.4. List of Existing and Potential Buyer’s
3.6. Investment Feasibility Matrix
3.7. Value Chain Analysis
3.7.1. Profit Margin Analysis
3.7.2. Wholesalers and Distributors
3.7.3. Retailers
3.8. PESTLE and Porter’s Analysis
3.9. Regulatory Landscape
3.9.1. By Key Regions
3.9.2. By Key Countries
3.10. Regional Parent Market Outlook
3.11. Production and Consumption Statistics
3.12. Import and Export Statistics
4. Global Market Analysis 2017-2021 and Forecast, 2022-2032
4.1. Historical Market Size Value (US$ Mn) & Volume (Unit) Analysis, 2017-2021
4.2. Current and Future Market Size Value (US$ Mn) & Volume (Unit) Projections, 2022-2032
4.2.1. Y-o-Y Growth Trend Analysis
4.2.2. Absolute $ Opportunity Analysis
5. Global Market Analysis 2017-2021 and Forecast 2022-2032, By Cap Type
5.1. Introduction / Key Findings
5.2. Historical Market Size Value (US$ Mn) & Volume (Unit) Analysis By Cap Type, 2017-2021
5.3. Current and Future Market Size Value (US$ Mn) & Volume (Unit) Analysis and Forecast By Cap Type, 2022-2032
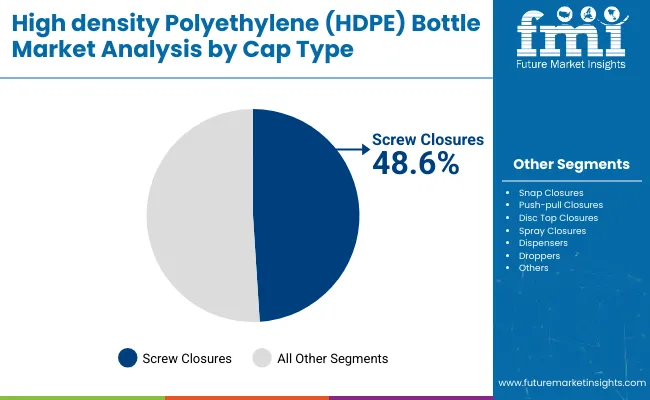
5.3.1. Screw Closures
5.3.2. Snap Closures
5.3.3. Push-Pull Closures
5.3.4. Disc Top closures
5.3.5. Spray Closures
5.3.6. Dispensers
5.3.7. Dropper
5.4. Y-o-Y Growth Trend Analysis By Cap Type, 2017-2021
5.5. Absolute $ Opportunity Analysis By Cap Type, 2022-2032
6. Global Market Analysis 2017-2021 and Forecast 2022-2032, By Bottle Capacity
6.1. Introduction / Key Findings
6.2. Historical Market Size Value (US$ Mn) & Volume (Unit) Analysis By Bottle Capacity, 2017-2021
6.3. Current and Future Market Size Value (US$ Mn) & Volume (Unit) Analysis and Forecast By Bottle Capacity, 2022-2032
6.3.1. Less than 30 ml
6.3.2. 31 ml – 100 ml
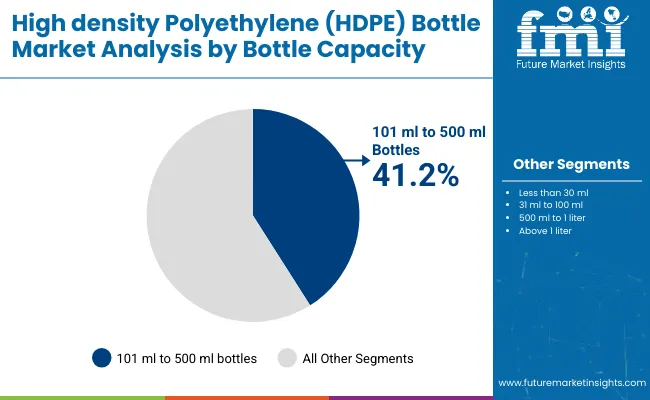
6.3.3. 101 ml – 500 ml
6.3.4. 501 ml – 1Lt
6.3.5. Above 1Lt
6.4. Y-o-Y Growth Trend Analysis By Bottle Capacity, 2017-2021
6.5. Absolute $ Opportunity Analysis By Bottle Capacity, 2022-2032
7. Global Market Analysis 2017-2021 and Forecast 2022-2032, By Visibility
7.1. Introduction / Key Findings
7.2. Historical Market Size Value (US$ Mn) & Volume (Unit) Analysis By Visibility, 2017-2021
7.3. Current and Future Market Size Value (US$ Mn) & Volume (Unit) Analysis and Forecast By Visibility, 2022-2032
7.3.1. Translucent
7.3.2. Opaque
7.4. Y-o-Y Growth Trend Analysis By Visibility, 2017-2021
7.5. Absolute $ Opportunity Analysis By Visibility, 2022-2032
8. Global Market Analysis 2017-2021 and Forecast 2022-2032, By Neck Type
8.1. Introduction / Key Findings
8.2. Historical Market Size Value (US$ Mn) & Volume (Unit) Analysis By Neck Type, 2017-2021
8.3. Current and Future Market Size Value (US$ Mn) & Volume (Unit) Analysis and Forecast By Neck Type, 2022-2032
8.3.1. Narrow Mouth Bottles
8.3.2. Wide Mouth Bottles
8.4. Y-o-Y Growth Trend Analysis By Neck Type, 2017-2021
8.5. Absolute $ Opportunity Analysis By Neck Type, 2022-2032
9. Global Market Analysis 2017-2021 and Forecast 2022-2032, By End-user Industry
9.1. Introduction / Key Findings
9.2. Historical Market Size Value (US$ Mn) & Volume (Unit) Analysis By End-user Industry, 2017-2021
9.3. Current and Future Market Size Value (US$ Mn) & Volume (Unit) Analysis and Forecast By End-user Industry, 2022-2032
9.3.1. Food & Beverages
9.3.1.1. Dairy Products
9.3.1.2. Juices
9.3.1.3. Others
9.3.2. Chemical
9.3.2.1. Agro Chemicals
9.3.2.2. Industrial Chemicals
9.3.2.3. Lubricants & Petrochemicals
9.3.3. Specialty Chemicals
9.3.4. Pharmaceuticals
9.3.5. Personal Care & Cosmetics
9.3.6. Homecare & Toiletries
9.4. Y-o-Y Growth Trend Analysis By End-user Industry, 2017-2021
9.5. Absolute $ Opportunity Analysis By End-user Industry, 2022-2032
10. Global Market Analysis 2017-2021 and Forecast 2022-2032, By Barrier Type
10.1. Introduction / Key Findings
10.2. Historical Market Size Value (US$ Mn) & Volume (Unit) Analysis By Barrier Type, 2017-2021
10.3. Current and Future Market Size Value (US$ Mn) & Volume (Unit) Analysis and Forecast By Barrier Type, 2022-2032
10.3.1. Low-barrier Bottles
10.3.2. High-barrier Bottles
10.3.2.1. Fluorinated Bottles
10.3.2.2. Polyamide (PA) Layer Bottles
10.3.2.3. Ethylene Vinyl Alcohol (EVOH) Layer Bottles
10.4. Y-o-Y Growth Trend Analysis By Barrier Type, 2017-2021
10.5. Absolute $ Opportunity Analysis By Barrier Type, 2022-2032
11. Global Market Analysis 2017-2021 and Forecast 2022-2032, By Region
11.1. Introduction
11.2. Historical Market Size Value (US$ Mn) & Volume (Unit) Analysis By Region, 2017-2021
11.3. Current Market Size Value (US$ Mn) & Volume (Unit) Analysis and Forecast By Region, 2022-2032
11.3.1. North America
11.3.2. Latin America
11.3.3. Europe
11.3.4. Asia Pacific
11.3.5. MEA
11.4. Market Attractiveness Analysis By Region
12. North America Market Analysis 2017-2021 and Forecast 2022-2032, By Country
12.1. Historical Market Size Value (US$ Mn) & Volume (Unit) Trend Analysis By Market Taxonomy, 2017-2021
12.2. Market Size Value (US$ Mn) & Volume (Unit) Forecast By Market Taxonomy, 2022-2032
12.2.1. By Country
12.2.1.1. U.S.
12.2.1.2. Canada
12.2.2. By Cap Type
12.2.3. By Bottle Capacity
12.2.4. By Visibility
12.2.5. By Neck Type
12.2.6. By End-user Industry
12.2.7. By Barrier Type
12.3. Market Attractiveness Analysis
12.3.1. By Country
12.3.2. By Cap Type
12.3.3. By Bottle Capacity
12.3.4. By Visibility
12.3.5. By Neck Type
12.3.6. By End-user Industry
12.3.7. By Barrier Type
12.4. Key Takeaways
13. Latin America Market Analysis 2017-2021 and Forecast 2022-2032, By Country
13.1. Historical Market Size Value (US$ Mn) & Volume (Unit) Trend Analysis By Market Taxonomy, 2017-2021
13.2. Market Size Value (US$ Mn) & Volume (Unit) Forecast By Market Taxonomy, 2022-2032
13.2.1. By Country
13.2.1.1. Brazil
13.2.1.2. Mexico
13.2.1.3. Rest of Latin America
13.2.2. By Cap Type
13.2.3. By Bottle Capacity
13.2.4. By Visibility
13.2.5. By Neck Type
13.2.6. By End-user Industry
13.2.7. By Barrier Type
13.3. Market Attractiveness Analysis
13.3.1. By Country
13.3.2. By Cap Type
13.3.3. By Bottle Capacity
13.3.4. By Visibility
13.3.5. By Neck Type
13.3.6. By End-user Industry
13.3.7. By Barrier Type
13.4. Key Takeaways
14. Europe Market Analysis 2017-2021 and Forecast 2022-2032, By Country
14.1. Historical Market Size Value (US$ Mn) & Volume (Unit) Trend Analysis By Market Taxonomy, 2017-2021
14.2. Market Size Value (US$ Mn) & Volume (Unit) Forecast By Market Taxonomy, 2022-2032
14.2.1. By Country
14.2.1.1. Germany
14.2.1.2. U.K.
14.2.1.3. France
14.2.1.4. Spain
14.2.1.5. Italy
14.2.1.6. Rest of Europe
14.2.2. By Cap Type
14.2.3. By Bottle Capacity
14.2.4. By Visibility
14.2.5. By Neck Type
14.2.6. By End-user Industry
14.2.7. By Barrier Type
14.3. Market Attractiveness Analysis
14.3.1. By Country
14.3.2. By Cap Type
14.3.3. By Bottle Capacity
14.3.4. By Visibility
14.3.5. By Neck Type
14.3.6. By End-user Industry
14.3.7. By Barrier Type
14.4. Key Takeaways
15. Asia Pacific Market Analysis 2017-2021 and Forecast 2022-2032, By Country
15.1. Historical Market Size Value (US$ Mn) & Volume (Unit) Trend Analysis By Market Taxonomy, 2017-2021
15.2. Market Size Value (US$ Mn) & Volume (Unit) Forecast By Market Taxonomy, 2022-2032
15.2.1. By Country
15.2.1.1. China
15.2.1.2. Japan
15.2.1.3. South Korea
15.2.1.4. Malaysia
15.2.1.5. Singapore
15.2.1.6. Australia
15.2.1.7. New Zealand
15.2.1.8. Rest of APAC
15.2.2. By Cap Type
15.2.3. By Bottle Capacity
15.2.4. By Visibility
15.2.5. By Neck Type
15.2.6. By End-user Industry
15.2.7. By Barrier Type
15.3. Market Attractiveness Analysis
15.3.1. By Country
15.3.2. By Cap Type
15.3.3. By Bottle Capacity
15.3.4. By Visibility
15.3.5. By Neck Type
15.3.6. By End-user Industry
15.3.7. By Barrier Type
15.4. Key Takeaways
16. MEA Market Analysis 2017-2021 and Forecast 2022-2032, By Country
16.1. Historical Market Size Value (US$ Mn) & Volume (Unit) Trend Analysis By Market Taxonomy, 2017-2021
16.2. Market Size Value (US$ Mn) & Volume (Unit) Forecast By Market Taxonomy, 2022-2032
16.2.1. By Country
16.2.1.1. GCC Countries
16.2.1.2. South Africa
16.2.1.3. Israel
16.2.1.4. Rest of MEA
16.2.2. By Cap Type
16.2.3. By Bottle Capacity
16.2.4. By Visibility
16.2.5. By Neck Type
16.2.6. By End-user Industry
16.2.7. By Barrier Type
16.3. Market Attractiveness Analysis
16.3.1. By Country
16.3.2. By Cap Type
16.3.3. By Bottle Capacity
16.3.4. By Visibility
16.3.5. By Neck Type
16.3.6. By End-user Industry
16.3.7. By Barrier Type
16.4. Key Takeaways
17. Key Countries Market Analysis
17.1. U.S.
17.1.1. Pricing Analysis
17.1.2. Market Share Analysis, 2021
17.1.2.1. By Cap Type
17.1.2.2. By Bottle Capacity
17.1.2.3. By Visibility
17.1.2.4. By Neck Type
17.1.2.5. By End-user Industry
17.1.2.6. By Barrier Type
17.2. Canada
17.2.1. Pricing Analysis
17.2.2. Market Share Analysis, 2021
17.2.2.1. By Cap Type
17.2.2.2. By Bottle Capacity
17.2.2.3. By Visibility
17.2.2.4. By Neck Type
17.2.2.5. By End-user Industry
17.2.2.6. By Barrier Type
17.3. Brazil
17.3.1. Pricing Analysis
17.3.2. Market Share Analysis, 2021
17.3.2.1. By Cap Type
17.3.2.2. By Bottle Capacity
17.3.2.3. By Visibility
17.3.2.4. By Neck Type
17.3.2.5. By End-user Industry
17.3.2.6. By Barrier Type
17.4. Mexico
17.4.1. Pricing Analysis
17.4.2. Market Share Analysis, 2021
17.4.2.1. By Cap Type
17.4.2.2. By Bottle Capacity
17.4.2.3. By Visibility
17.4.2.4. By Neck Type
17.4.2.5. By End-user Industry
17.4.2.6. By Barrier Type
17.5. Germany
17.5.1. Pricing Analysis
17.5.2. Market Share Analysis, 2021
17.5.2.1. By Cap Type
17.5.2.2. By Bottle Capacity
17.5.2.3. By Visibility
17.5.2.4. By Neck Type
17.5.2.5. By End-user Industry
17.5.2.6. By Barrier Type
17.6. U.K.
17.6.1. Pricing Analysis
17.6.2. Market Share Analysis, 2021
17.6.2.1. By Cap Type
17.6.2.2. By Bottle Capacity
17.6.2.3. By Visibility
17.6.2.4. By Neck Type
17.6.2.5. By End-user Industry
17.6.2.6. By Barrier Type
17.7. France
17.7.1. Pricing Analysis
17.7.2. Market Share Analysis, 2021
17.7.2.1. By Cap Type
17.7.2.2. By Bottle Capacity
17.7.2.3. By Visibility
17.7.2.4. By Neck Type
17.7.2.5. By End-user Industry
17.7.2.6. By Barrier Type
17.8. Spain
17.8.1. Pricing Analysis
17.8.2. Market Share Analysis, 2021
17.8.2.1. By Cap Type
17.8.2.2. By Bottle Capacity
17.8.2.3. By Visibility
17.8.2.4. By Neck Type
17.8.2.5. By End-user Industry
17.8.2.6. By Barrier Type
17.9. Italy
17.9.1. Pricing Analysis
17.9.2. Market Share Analysis, 2021
17.9.2.1. By Cap Type
17.9.2.2. By Bottle Capacity
17.9.2.3. By Visibility
17.9.2.4. By Neck Type
17.9.2.5. By End-user Industry
17.9.2.6. By Barrier Type
17.10. China
17.10.1. Pricing Analysis
17.10.2. Market Share Analysis, 2021
17.10.2.1. By Cap Type
17.10.2.2. By Bottle Capacity
17.10.2.3. By Visibility
17.10.2.4. By Neck Type
17.10.2.5. By End-user Industry
17.10.2.6. By Barrier Type
17.11. Japan
17.11.1. Pricing Analysis
17.11.2. Market Share Analysis, 2021
17.11.2.1. By Cap Type
17.11.2.2. By Bottle Capacity
17.11.2.3. By Visibility
17.11.2.4. By Neck Type
17.11.2.5. By End-user Industry
17.11.2.6. By Barrier Type
17.12. South Korea
17.12.1. Pricing Analysis
17.12.2. Market Share Analysis, 2021
17.12.2.1. By Cap Type
17.12.2.2. By Bottle Capacity
17.12.2.3. By Visibility
17.12.2.4. By Neck Type
17.12.2.5. By End-user Industry
17.12.2.6. By Barrier Type
17.13. Malaysia
17.13.1. Pricing Analysis
17.13.2. Market Share Analysis, 2021
17.13.2.1. By Cap Type
17.13.2.2. By Bottle Capacity
17.13.2.3. By Visibility
17.13.2.4. By Neck Type
17.13.2.5. By End-user Industry
17.13.2.6. By Barrier Type
17.14. Singapore
17.14.1. Pricing Analysis
17.14.2. Market Share Analysis, 2021
17.14.2.1. By Cap Type
17.14.2.2. By Bottle Capacity
17.14.2.3. By Visibility
17.14.2.4. By Neck Type
17.14.2.5. By End-user Industry
17.14.2.6. By Barrier Type
17.15. Australia
17.15.1. Pricing Analysis
17.15.2. Market Share Analysis, 2021
17.15.2.1. By Cap Type
17.15.2.2. By Bottle Capacity
17.15.2.3. By Visibility
17.15.2.4. By Neck Type
17.15.2.5. By End-user Industry
17.15.2.6. By Barrier Type
17.16. New Zealand
17.16.1. Pricing Analysis
17.16.2. Market Share Analysis, 2021
17.16.2.1. By Cap Type
17.16.2.2. By Bottle Capacity
17.16.2.3. By Visibility
17.16.2.4. By Neck Type
17.16.2.5. By End-user Industry
17.16.2.6. By Barrier Type
17.17. GCC Countries
17.17.1. Pricing Analysis
17.17.2. Market Share Analysis, 2021
17.17.2.1. By Cap Type
17.17.2.2. By Bottle Capacity
17.17.2.3. By Visibility
17.17.2.4. By Neck Type
17.17.2.5. By End-user Industry
17.17.2.6. By Barrier Type
17.18. South Africa
17.18.1. Pricing Analysis
17.18.2. Market Share Analysis, 2021
17.18.2.1. By Cap Type
17.18.2.2. By Bottle Capacity
17.18.2.3. By Visibility
17.18.2.4. By Neck Type
17.18.2.5. By End-user Industry
17.18.2.6. By Barrier Type
17.19. Israel
17.19.1. Pricing Analysis
17.19.2. Market Share Analysis, 2021
17.19.2.1. By Cap Type
17.19.2.2. By Bottle Capacity
17.19.2.3. By Visibility
17.19.2.4. By Neck Type
17.19.2.5. By End-user Industry
17.19.2.6. By Barrier Type
18. Market Structure Analysis
18.1. Competition Dashboard
18.2. Competition Benchmarking
18.3. Market Share Analysis of Top Players
18.3.1. By Regional
18.3.2. By Cap Type
18.3.3. By Bottle Capacity
18.3.4. By Visibility
18.3.5. By Neck Type
18.3.6. By End-user Industry
18.3.7. By Barrier Type
19. Competition Analysis
19.1. Competition Deep Dive
19.1.1. Gerreshemier AG
19.1.1.1. Overview
19.1.1.2. Product Portfolio
19.1.1.3. Profitability by Market Segments
19.1.1.4. Sales Footprint
19.1.1.5. Strategy Overview
19.1.1.5.1. Marketing Strategy
19.1.1.5.2. Product Strategy
19.1.1.5.3. Channel Strategy
19.1.2. Berry Global Group Inc.
19.1.2.1. Overview
19.1.2.2. Product Portfolio
19.1.2.3. Profitability by Market Segments
19.1.2.4. Sales Footprint
19.1.2.5. Strategy Overview
19.1.2.5.1. Marketing Strategy
19.1.2.5.2. Product Strategy
19.1.2.5.3. Channel Strategy
19.1.3. Silgan Plastics Closure Solutions
19.1.3.1. Overview
19.1.3.2. Product Portfolio
19.1.3.3. Profitability by Market Segments
19.1.3.4. Sales Footprint
19.1.3.5. Strategy Overview
19.1.3.5.1. Marketing Strategy
19.1.3.5.2. Product Strategy
19.1.3.5.3. Channel Strategy
19.1.4. O Berk Company LLC
19.1.4.1. Overview
19.1.4.2. Product Portfolio
19.1.4.3. Profitability by Market Segments
19.1.4.4. Sales Footprint
19.1.4.5. Strategy Overview
19.1.4.5.1. Marketing Strategy
19.1.4.5.2. Product Strategy
19.1.4.5.3. Channel Strategy
19.1.5. Amcor Ltd
19.1.5.1. Overview
19.1.5.2. Product Portfolio
19.1.5.3. Profitability by Market Segments
19.1.5.4. Sales Footprint
19.1.5.5. Strategy Overview
19.1.5.5.1. Marketing Strategy
19.1.5.5.2. Product Strategy
19.1.5.5.3. Channel Strategy
19.1.6. CL Smith
19.1.6.1. Overview
19.1.6.2. Product Portfolio
19.1.6.3. Profitability by Market Segments
19.1.6.4. Sales Footprint
19.1.6.5. Strategy Overview
19.1.6.5.1. Marketing Strategy
19.1.6.5.2. Product Strategy
19.1.6.5.3. Channel Strategy
19.1.7. RPC Group Plc
19.1.7.1. Overview
19.1.7.2. Product Portfolio
19.1.7.3. Profitability by Market Segments
19.1.7.4. Sales Footprint
19.1.7.5. Strategy Overview
19.1.7.5.1. Marketing Strategy
19.1.7.5.2. Product Strategy
19.1.7.5.3. Channel Strategy
19.1.8. Graham Packaging
19.1.8.1. Overview
19.1.8.2. Product Portfolio
19.1.8.3. Profitability by Market Segments
19.1.8.4. Sales Footprint
19.1.8.5. Strategy Overview
19.1.8.5.1. Marketing Strategy
19.1.8.5.2. Product Strategy
19.1.8.5.3. Channel Strategy
19.1.9. Nampac Limited
19.1.9.1. Overview
19.1.9.2. Product Portfolio
19.1.9.3. Profitability by Market Segments
19.1.9.4. Sales Footprint
19.1.9.5. Strategy Overview
19.1.9.5.1. Marketing Strategy
19.1.9.5.2. Product Strategy
19.1.9.5.3. Channel Strategy
19.1.10. ALPLA Werke Alwin Lehner GmbH & Co KG
19.1.10.1. Overview
19.1.10.2. Product Portfolio
19.1.10.3. Profitability by Market Segments
19.1.10.4. Sales Footprint
19.1.10.5. Strategy Overview
19.1.10.5.1. Marketing Strategy
19.1.10.5.2. Product Strategy
19.1.10.5.3. Channel Strategy
20. Assumptions & Acronyms Used
21. Research Methodology
Let us know your requirement to get
100% FREE customization
List of Tables
Table 1: Global Market Value (US$ Mn) Forecast by Region, 2017-2032
Table 2: Global Market Volume (Unit) Forecast by Region, 2017-2032
Table 3: Global Market Value (US$ Mn) Forecast by Cap Type, 2017-2032
Table 4: Global Market Volume (Unit) Forecast by Cap Type, 2017-2032
Table 5: Global Market Value (US$ Mn) Forecast by Bottle Capacity, 2017-2032
Table 6: Global Market Volume (Unit) Forecast by Bottle Capacity, 2017-2032
Table 7: Global Market Value (US$ Mn) Forecast by Visibility, 2017-2032
Table 8: Global Market Volume (Unit) Forecast by Visibility, 2017-2032
Table 9: Global Market Value (US$ Mn) Forecast by Neck Type, 2017-2032
Table 10: Global Market Volume (Unit) Forecast by Neck Type, 2017-2032
Table 11: Global Market Value (US$ Mn) Forecast by End-user Industry, 2017-2032
Table 12: Global Market Volume (Unit) Forecast by End-user Industry, 2017-2032
Table 13: Global Market Value (US$ Mn) Forecast by Barrier Type, 2017-2032
Table 14: Global Market Volume (Unit) Forecast by Barrier Type, 2017-2032
Table 15: North America Market Value (US$ Mn) Forecast by Country, 2017-2032
Table 16: North America Market Volume (Unit) Forecast by Country, 2017-2032
Table 17: North America Market Value (US$ Mn) Forecast by Cap Type, 2017-2032
Table 18: North America Market Volume (Unit) Forecast by Cap Type, 2017-2032
Table 19: North America Market Value (US$ Mn) Forecast by Bottle Capacity, 2017-2032
Table 20: North America Market Volume (Unit) Forecast by Bottle Capacity, 2017-2032
Table 21: North America Market Value (US$ Mn) Forecast by Visibility, 2017-2032
Table 22: North America Market Volume (Unit) Forecast by Visibility, 2017-2032
Table 23: North America Market Value (US$ Mn) Forecast by Neck Type, 2017-2032
Table 24: North America Market Volume (Unit) Forecast by Neck Type, 2017-2032
Table 25: North America Market Value (US$ Mn) Forecast by End-user Industry, 2017-2032
Table 26: North America Market Volume (Unit) Forecast by End-user Industry, 2017-2032
Table 27: North America Market Value (US$ Mn) Forecast by Barrier Type, 2017-2032
Table 28: North America Market Volume (Unit) Forecast by Barrier Type, 2017-2032
Table 29: Latin America Market Value (US$ Mn) Forecast by Country, 2017-2032
Table 30: Latin America Market Volume (Unit) Forecast by Country, 2017-2032
Table 31: Latin America Market Value (US$ Mn) Forecast by Cap Type, 2017-2032
Table 32: Latin America Market Volume (Unit) Forecast by Cap Type, 2017-2032
Table 33: Latin America Market Value (US$ Mn) Forecast by Bottle Capacity, 2017-2032
Table 34: Latin America Market Volume (Unit) Forecast by Bottle Capacity, 2017-2032
Table 35: Latin America Market Value (US$ Mn) Forecast by Visibility, 2017-2032
Table 36: Latin America Market Volume (Unit) Forecast by Visibility, 2017-2032
Table 37: Latin America Market Value (US$ Mn) Forecast by Neck Type, 2017-2032
Table 38: Latin America Market Volume (Unit) Forecast by Neck Type, 2017-2032
Table 39: Latin America Market Value (US$ Mn) Forecast by End-user Industry, 2017-2032
Table 40: Latin America Market Volume (Unit) Forecast by End-user Industry, 2017-2032
Table 41: Latin America Market Value (US$ Mn) Forecast by Barrier Type, 2017-2032
Table 42: Latin America Market Volume (Unit) Forecast by Barrier Type, 2017-2032
Table 43: Europe Market Value (US$ Mn) Forecast by Country, 2017-2032
Table 44: Europe Market Volume (Unit) Forecast by Country, 2017-2032
Table 45: Europe Market Value (US$ Mn) Forecast by Cap Type, 2017-2032
Table 46: Europe Market Volume (Unit) Forecast by Cap Type, 2017-2032
Table 47: Europe Market Value (US$ Mn) Forecast by Bottle Capacity, 2017-2032
Table 48: Europe Market Volume (Unit) Forecast by Bottle Capacity, 2017-2032
Table 49: Europe Market Value (US$ Mn) Forecast by Visibility, 2017-2032
Table 50: Europe Market Volume (Unit) Forecast by Visibility, 2017-2032
Table 51: Europe Market Value (US$ Mn) Forecast by Neck Type, 2017-2032
Table 52: Europe Market Volume (Unit) Forecast by Neck Type, 2017-2032
Table 53: Europe Market Value (US$ Mn) Forecast by End-user Industry, 2017-2032
Table 54: Europe Market Volume (Unit) Forecast by End-user Industry, 2017-2032
Table 55: Europe Market Value (US$ Mn) Forecast by Barrier Type, 2017-2032
Table 56: Europe Market Volume (Unit) Forecast by Barrier Type, 2017-2032
Table 57: Asia Pacific Market Value (US$ Mn) Forecast by Country, 2017-2032
Table 58: Asia Pacific Market Volume (Unit) Forecast by Country, 2017-2032
Table 59: Asia Pacific Market Value (US$ Mn) Forecast by Cap Type, 2017-2032
Table 60: Asia Pacific Market Volume (Unit) Forecast by Cap Type, 2017-2032
Table 61: Asia Pacific Market Value (US$ Mn) Forecast by Bottle Capacity, 2017-2032
Table 62: Asia Pacific Market Volume (Unit) Forecast by Bottle Capacity, 2017-2032
Table 63: Asia Pacific Market Value (US$ Mn) Forecast by Visibility, 2017-2032
Table 64: Asia Pacific Market Volume (Unit) Forecast by Visibility, 2017-2032
Table 65: Asia Pacific Market Value (US$ Mn) Forecast by Neck Type, 2017-2032
Table 66: Asia Pacific Market Volume (Unit) Forecast by Neck Type, 2017-2032
Table 67: Asia Pacific Market Value (US$ Mn) Forecast by End-user Industry, 2017-2032
Table 68: Asia Pacific Market Volume (Unit) Forecast by End-user Industry, 2017-2032
Table 69: Asia Pacific Market Value (US$ Mn) Forecast by Barrier Type, 2017-2032
Table 70: Asia Pacific Market Volume (Unit) Forecast by Barrier Type, 2017-2032
Table 71: MEA Market Value (US$ Mn) Forecast by Country, 2017-2032
Table 72: MEA Market Volume (Unit) Forecast by Country, 2017-2032
Table 73: MEA Market Value (US$ Mn) Forecast by Cap Type, 2017-2032
Table 74: MEA Market Volume (Unit) Forecast by Cap Type, 2017-2032
Table 75: MEA Market Value (US$ Mn) Forecast by Bottle Capacity, 2017-2032
Table 76: MEA Market Volume (Unit) Forecast by Bottle Capacity, 2017-2032
Table 77: MEA Market Value (US$ Mn) Forecast by Visibility, 2017-2032
Table 78: MEA Market Volume (Unit) Forecast by Visibility, 2017-2032
Table 79: MEA Market Value (US$ Mn) Forecast by Neck Type, 2017-2032
Table 80: MEA Market Volume (Unit) Forecast by Neck Type, 2017-2032
Table 81: MEA Market Value (US$ Mn) Forecast by End-user Industry, 2017-2032
Table 82: MEA Market Volume (Unit) Forecast by End-user Industry, 2017-2032
Table 83: MEA Market Value (US$ Mn) Forecast by Barrier Type, 2017-2032
Table 84: MEA Market Volume (Unit) Forecast by Barrier Type, 2017-2032
Find your sweet spots for generating winning opportunities in this market.
Talk to AnalystList of Charts
Figure 1: Global Market Value (US$ Mn) by Cap Type, 2022-2032
Figure 2: Global Market Value (US$ Mn) by Bottle Capacity, 2022-2032
Figure 3: Global Market Value (US$ Mn) by Visibility, 2022-2032
Figure 4: Global Market Value (US$ Mn) by Neck Type, 2022-2032
Figure 5: Global Market Value (US$ Mn) by End-user Industry, 2022-2032
Figure 6: Global Market Value (US$ Mn) by Barrier Type, 2022-2032
Figure 7: Global Market Value (US$ Mn) by Region, 2022-2032
Figure 8: Global Market Value (US$ Mn) Analysis by Region, 2017-2032
Figure 9: Global Market Volume (Unit) Analysis by Region, 2017-2032
Figure 10: Global Market Value Share (%) and BPS Analysis by Region, 2022-2032
Figure 11: Global Market Y-o-Y Growth (%) Projections by Region, 2022-2032
Figure 12: Global Market Value (US$ Mn) Analysis by Cap Type, 2017-2032
Figure 13: Global Market Volume (Unit) Analysis by Cap Type, 2017-2032
Figure 14: Global Market Value Share (%) and BPS Analysis by Cap Type, 2022-2032
Figure 15: Global Market Y-o-Y Growth (%) Projections by Cap Type, 2022-2032
Figure 16: Global Market Value (US$ Mn) Analysis by Bottle Capacity, 2017-2032
Figure 17: Global Market Volume (Unit) Analysis by Bottle Capacity, 2017-2032
Figure 18: Global Market Value Share (%) and BPS Analysis by Bottle Capacity, 2022-2032
Figure 19: Global Market Y-o-Y Growth (%) Projections by Bottle Capacity, 2022-2032
Figure 20: Global Market Value (US$ Mn) Analysis by Visibility, 2017-2032
Figure 21: Global Market Volume (Unit) Analysis by Visibility, 2017-2032
Figure 22: Global Market Value Share (%) and BPS Analysis by Visibility, 2022-2032
Figure 23: Global Market Y-o-Y Growth (%) Projections by Visibility, 2022-2032
Figure 24: Global Market Value (US$ Mn) Analysis by Neck Type, 2017-2032
Figure 25: Global Market Volume (Unit) Analysis by Neck Type, 2017-2032
Figure 26: Global Market Value Share (%) and BPS Analysis by Neck Type, 2022-2032
Figure 27: Global Market Y-o-Y Growth (%) Projections by Neck Type, 2022-2032
Figure 28: Global Market Value (US$ Mn) Analysis by End-user Industry, 2017-2032
Figure 29: Global Market Volume (Unit) Analysis by End-user Industry, 2017-2032
Figure 30: Global Market Value Share (%) and BPS Analysis by End-user Industry, 2022-2032
Figure 31: Global Market Y-o-Y Growth (%) Projections by End-user Industry, 2022-2032
Figure 32: Global Market Value (US$ Mn) Analysis by Barrier Type, 2017-2032
Figure 33: Global Market Volume (Unit) Analysis by Barrier Type, 2017-2032
Figure 34: Global Market Value Share (%) and BPS Analysis by Barrier Type, 2022-2032
Figure 35: Global Market Y-o-Y Growth (%) Projections by Barrier Type, 2022-2032
Figure 36: Global Market Attractiveness by Cap Type, 2022-2032
Figure 37: Global Market Attractiveness by Bottle Capacity, 2022-2032
Figure 38: Global Market Attractiveness by Visibility, 2022-2032
Figure 39: Global Market Attractiveness by Neck Type, 2022-2032
Figure 40: Global Market Attractiveness by End-user Industry, 2022-2032
Figure 41: Global Market Attractiveness by Barrier Type, 2022-2032
Figure 42: Global Market Attractiveness by Region, 2022-2032
Figure 43: North America Market Value (US$ Mn) by Cap Type, 2022-2032
Figure 44: North America Market Value (US$ Mn) by Bottle Capacity, 2022-2032
Figure 45: North America Market Value (US$ Mn) by Visibility, 2022-2032
Figure 46: North America Market Value (US$ Mn) by Neck Type, 2022-2032
Figure 47: North America Market Value (US$ Mn) by End-user Industry, 2022-2032
Figure 48: North America Market Value (US$ Mn) by Barrier Type, 2022-2032
Figure 49: North America Market Value (US$ Mn) by Country, 2022-2032
Figure 50: North America Market Value (US$ Mn) Analysis by Country, 2017-2032
Figure 51: North America Market Volume (Unit) Analysis by Country, 2017-2032
Figure 52: North America Market Value Share (%) and BPS Analysis by Country, 2022-2032
Figure 53: North America Market Y-o-Y Growth (%) Projections by Country, 2022-2032
Figure 54: North America Market Value (US$ Mn) Analysis by Cap Type, 2017-2032
Figure 55: North America Market Volume (Unit) Analysis by Cap Type, 2017-2032
Figure 56: North America Market Value Share (%) and BPS Analysis by Cap Type, 2022-2032
Figure 57: North America Market Y-o-Y Growth (%) Projections by Cap Type, 2022-2032
Figure 58: North America Market Value (US$ Mn) Analysis by Bottle Capacity, 2017-2032
Figure 59: North America Market Volume (Unit) Analysis by Bottle Capacity, 2017-2032
Figure 60: North America Market Value Share (%) and BPS Analysis by Bottle Capacity, 2022-2032
Figure 61: North America Market Y-o-Y Growth (%) Projections by Bottle Capacity, 2022-2032
Figure 62: North America Market Value (US$ Mn) Analysis by Visibility, 2017-2032
Figure 63: North America Market Volume (Unit) Analysis by Visibility, 2017-2032
Figure 64: North America Market Value Share (%) and BPS Analysis by Visibility, 2022-2032
Figure 65: North America Market Y-o-Y Growth (%) Projections by Visibility, 2022-2032
Figure 66: North America Market Value (US$ Mn) Analysis by Neck Type, 2017-2032
Figure 67: North America Market Volume (Unit) Analysis by Neck Type, 2017-2032
Figure 68: North America Market Value Share (%) and BPS Analysis by Neck Type, 2022-2032
Figure 69: North America Market Y-o-Y Growth (%) Projections by Neck Type, 2022-2032
Figure 70: North America Market Value (US$ Mn) Analysis by End-user Industry, 2017-2032
Figure 71: North America Market Volume (Unit) Analysis by End-user Industry, 2017-2032
Figure 72: North America Market Value Share (%) and BPS Analysis by End-user Industry, 2022-2032
Figure 73: North America Market Y-o-Y Growth (%) Projections by End-user Industry, 2022-2032
Figure 74: North America Market Value (US$ Mn) Analysis by Barrier Type, 2017-2032
Figure 75: North America Market Volume (Unit) Analysis by Barrier Type, 2017-2032
Figure 76: North America Market Value Share (%) and BPS Analysis by Barrier Type, 2022-2032
Figure 77: North America Market Y-o-Y Growth (%) Projections by Barrier Type, 2022-2032
Figure 78: North America Market Attractiveness by Cap Type, 2022-2032
Figure 79: North America Market Attractiveness by Bottle Capacity, 2022-2032
Figure 80: North America Market Attractiveness by Visibility, 2022-2032
Figure 81: North America Market Attractiveness by Neck Type, 2022-2032
Figure 82: North America Market Attractiveness by End-user Industry, 2022-2032
Figure 83: North America Market Attractiveness by Barrier Type, 2022-2032
Figure 84: North America Market Attractiveness by Country, 2022-2032
Figure 85: Latin America Market Value (US$ Mn) by Cap Type, 2022-2032
Figure 86: Latin America Market Value (US$ Mn) by Bottle Capacity, 2022-2032
Figure 87: Latin America Market Value (US$ Mn) by Visibility, 2022-2032
Figure 88: Latin America Market Value (US$ Mn) by Neck Type, 2022-2032
Figure 89: Latin America Market Value (US$ Mn) by End-user Industry, 2022-2032
Figure 90: Latin America Market Value (US$ Mn) by Barrier Type, 2022-2032
Figure 91: Latin America Market Value (US$ Mn) by Country, 2022-2032
Figure 92: Latin America Market Value (US$ Mn) Analysis by Country, 2017-2032
Figure 93: Latin America Market Volume (Unit) Analysis by Country, 2017-2032
Figure 94: Latin America Market Value Share (%) and BPS Analysis by Country, 2022-2032
Figure 95: Latin America Market Y-o-Y Growth (%) Projections by Country, 2022-2032
Figure 96: Latin America Market Value (US$ Mn) Analysis by Cap Type, 2017-2032
Figure 97: Latin America Market Volume (Unit) Analysis by Cap Type, 2017-2032
Figure 98: Latin America Market Value Share (%) and BPS Analysis by Cap Type, 2022-2032
Figure 99: Latin America Market Y-o-Y Growth (%) Projections by Cap Type, 2022-2032
Figure 100: Latin America Market Value (US$ Mn) Analysis by Bottle Capacity, 2017-2032
Figure 101: Latin America Market Volume (Unit) Analysis by Bottle Capacity, 2017-2032
Figure 102: Latin America Market Value Share (%) and BPS Analysis by Bottle Capacity, 2022-2032
Figure 103: Latin America Market Y-o-Y Growth (%) Projections by Bottle Capacity, 2022-2032
Figure 104: Latin America Market Value (US$ Mn) Analysis by Visibility, 2017-2032
Figure 105: Latin America Market Volume (Unit) Analysis by Visibility, 2017-2032
Figure 106: Latin America Market Value Share (%) and BPS Analysis by Visibility, 2022-2032
Figure 107: Latin America Market Y-o-Y Growth (%) Projections by Visibility, 2022-2032
Figure 108: Latin America Market Value (US$ Mn) Analysis by Neck Type, 2017-2032
Figure 109: Latin America Market Volume (Unit) Analysis by Neck Type, 2017-2032
Figure 110: Latin America Market Value Share (%) and BPS Analysis by Neck Type, 2022-2032
Figure 111: Latin America Market Y-o-Y Growth (%) Projections by Neck Type, 2022-2032
Figure 112: Latin America Market Value (US$ Mn) Analysis by End-user Industry, 2017-2032
Figure 113: Latin America Market Volume (Unit) Analysis by End-user Industry, 2017-2032
Figure 114: Latin America Market Value Share (%) and BPS Analysis by End-user Industry, 2022-2032
Figure 115: Latin America Market Y-o-Y Growth (%) Projections by End-user Industry, 2022-2032
Figure 116: Latin America Market Value (US$ Mn) Analysis by Barrier Type, 2017-2032
Figure 117: Latin America Market Volume (Unit) Analysis by Barrier Type, 2017-2032
Figure 118: Latin America Market Value Share (%) and BPS Analysis by Barrier Type, 2022-2032
Figure 119: Latin America Market Y-o-Y Growth (%) Projections by Barrier Type, 2022-2032
Figure 120: Latin America Market Attractiveness by Cap Type, 2022-2032
Figure 121: Latin America Market Attractiveness by Bottle Capacity, 2022-2032
Figure 122: Latin America Market Attractiveness by Visibility, 2022-2032
Figure 123: Latin America Market Attractiveness by Neck Type, 2022-2032
Figure 124: Latin America Market Attractiveness by End-user Industry, 2022-2032
Figure 125: Latin America Market Attractiveness by Barrier Type, 2022-2032
Figure 126: Latin America Market Attractiveness by Country, 2022-2032
Figure 127: Europe Market Value (US$ Mn) by Cap Type, 2022-2032
Figure 128: Europe Market Value (US$ Mn) by Bottle Capacity, 2022-2032
Figure 129: Europe Market Value (US$ Mn) by Visibility, 2022-2032
Figure 130: Europe Market Value (US$ Mn) by Neck Type, 2022-2032
Figure 131: Europe Market Value (US$ Mn) by End-user Industry, 2022-2032
Figure 132: Europe Market Value (US$ Mn) by Barrier Type, 2022-2032
Figure 133: Europe Market Value (US$ Mn) by Country, 2022-2032
Figure 134: Europe Market Value (US$ Mn) Analysis by Country, 2017-2032
Figure 135: Europe Market Volume (Unit) Analysis by Country, 2017-2032
Figure 136: Europe Market Value Share (%) and BPS Analysis by Country, 2022-2032
Figure 137: Europe Market Y-o-Y Growth (%) Projections by Country, 2022-2032
Figure 138: Europe Market Value (US$ Mn) Analysis by Cap Type, 2017-2032
Figure 139: Europe Market Volume (Unit) Analysis by Cap Type, 2017-2032
Figure 140: Europe Market Value Share (%) and BPS Analysis by Cap Type, 2022-2032
Figure 141: Europe Market Y-o-Y Growth (%) Projections by Cap Type, 2022-2032
Figure 142: Europe Market Value (US$ Mn) Analysis by Bottle Capacity, 2017-2032
Figure 143: Europe Market Volume (Unit) Analysis by Bottle Capacity, 2017-2032
Figure 144: Europe Market Value Share (%) and BPS Analysis by Bottle Capacity, 2022-2032
Figure 145: Europe Market Y-o-Y Growth (%) Projections by Bottle Capacity, 2022-2032
Figure 146: Europe Market Value (US$ Mn) Analysis by Visibility, 2017-2032
Figure 147: Europe Market Volume (Unit) Analysis by Visibility, 2017-2032
Figure 148: Europe Market Value Share (%) and BPS Analysis by Visibility, 2022-2032
Figure 149: Europe Market Y-o-Y Growth (%) Projections by Visibility, 2022-2032
Figure 150: Europe Market Value (US$ Mn) Analysis by Neck Type, 2017-2032
Figure 151: Europe Market Volume (Unit) Analysis by Neck Type, 2017-2032
Figure 152: Europe Market Value Share (%) and BPS Analysis by Neck Type, 2022-2032
Figure 153: Europe Market Y-o-Y Growth (%) Projections by Neck Type, 2022-2032
Figure 154: Europe Market Value (US$ Mn) Analysis by End-user Industry, 2017-2032
Figure 155: Europe Market Volume (Unit) Analysis by End-user Industry, 2017-2032
Figure 156: Europe Market Value Share (%) and BPS Analysis by End-user Industry, 2022-2032
Figure 157: Europe Market Y-o-Y Growth (%) Projections by End-user Industry, 2022-2032
Figure 158: Europe Market Value (US$ Mn) Analysis by Barrier Type, 2017-2032
Figure 159: Europe Market Volume (Unit) Analysis by Barrier Type, 2017-2032
Figure 160: Europe Market Value Share (%) and BPS Analysis by Barrier Type, 2022-2032
Figure 161: Europe Market Y-o-Y Growth (%) Projections by Barrier Type, 2022-2032
Figure 162: Europe Market Attractiveness by Cap Type, 2022-2032
Figure 163: Europe Market Attractiveness by Bottle Capacity, 2022-2032
Figure 164: Europe Market Attractiveness by Visibility, 2022-2032
Figure 165: Europe Market Attractiveness by Neck Type, 2022-2032
Figure 166: Europe Market Attractiveness by End-user Industry, 2022-2032
Figure 167: Europe Market Attractiveness by Barrier Type, 2022-2032
Figure 168: Europe Market Attractiveness by Country, 2022-2032
Figure 169: Asia Pacific Market Value (US$ Mn) by Cap Type, 2022-2032
Figure 170: Asia Pacific Market Value (US$ Mn) by Bottle Capacity, 2022-2032
Figure 171: Asia Pacific Market Value (US$ Mn) by Visibility, 2022-2032
Figure 172: Asia Pacific Market Value (US$ Mn) by Neck Type, 2022-2032
Figure 173: Asia Pacific Market Value (US$ Mn) by End-user Industry, 2022-2032
Figure 174: Asia Pacific Market Value (US$ Mn) by Barrier Type, 2022-2032
Figure 175: Asia Pacific Market Value (US$ Mn) by Country, 2022-2032
Figure 176: Asia Pacific Market Value (US$ Mn) Analysis by Country, 2017-2032
Figure 177: Asia Pacific Market Volume (Unit) Analysis by Country, 2017-2032
Figure 178: Asia Pacific Market Value Share (%) and BPS Analysis by Country, 2022-2032
Figure 179: Asia Pacific Market Y-o-Y Growth (%) Projections by Country, 2022-2032
Figure 180: Asia Pacific Market Value (US$ Mn) Analysis by Cap Type, 2017-2032
Figure 181: Asia Pacific Market Volume (Unit) Analysis by Cap Type, 2017-2032
Figure 182: Asia Pacific Market Value Share (%) and BPS Analysis by Cap Type, 2022-2032
Figure 183: Asia Pacific Market Y-o-Y Growth (%) Projections by Cap Type, 2022-2032
Figure 184: Asia Pacific Market Value (US$ Mn) Analysis by Bottle Capacity, 2017-2032
Figure 185: Asia Pacific Market Volume (Unit) Analysis by Bottle Capacity, 2017-2032
Figure 186: Asia Pacific Market Value Share (%) and BPS Analysis by Bottle Capacity, 2022-2032
Figure 187: Asia Pacific Market Y-o-Y Growth (%) Projections by Bottle Capacity, 2022-2032
Figure 188: Asia Pacific Market Value (US$ Mn) Analysis by Visibility, 2017-2032
Figure 189: Asia Pacific Market Volume (Unit) Analysis by Visibility, 2017-2032
Figure 190: Asia Pacific Market Value Share (%) and BPS Analysis by Visibility, 2022-2032
Figure 191: Asia Pacific Market Y-o-Y Growth (%) Projections by Visibility, 2022-2032
Figure 192: Asia Pacific Market Value (US$ Mn) Analysis by Neck Type, 2017-2032
Figure 193: Asia Pacific Market Volume (Unit) Analysis by Neck Type, 2017-2032
Figure 194: Asia Pacific Market Value Share (%) and BPS Analysis by Neck Type, 2022-2032
Figure 195: Asia Pacific Market Y-o-Y Growth (%) Projections by Neck Type, 2022-2032
Figure 196: Asia Pacific Market Value (US$ Mn) Analysis by End-user Industry, 2017-2032
Figure 197: Asia Pacific Market Volume (Unit) Analysis by End-user Industry, 2017-2032
Figure 198: Asia Pacific Market Value Share (%) and BPS Analysis by End-user Industry, 2022-2032
Figure 199: Asia Pacific Market Y-o-Y Growth (%) Projections by End-user Industry, 2022-2032
Figure 200: Asia Pacific Market Value (US$ Mn) Analysis by Barrier Type, 2017-2032
Figure 201: Asia Pacific Market Volume (Unit) Analysis by Barrier Type, 2017-2032
Figure 202: Asia Pacific Market Value Share (%) and BPS Analysis by Barrier Type, 2022-2032
Figure 203: Asia Pacific Market Y-o-Y Growth (%) Projections by Barrier Type, 2022-2032
Figure 204: Asia Pacific Market Attractiveness by Cap Type, 2022-2032
Figure 205: Asia Pacific Market Attractiveness by Bottle Capacity, 2022-2032
Figure 206: Asia Pacific Market Attractiveness by Visibility, 2022-2032
Figure 207: Asia Pacific Market Attractiveness by Neck Type, 2022-2032
Figure 208: Asia Pacific Market Attractiveness by End-user Industry, 2022-2032
Figure 209: Asia Pacific Market Attractiveness by Barrier Type, 2022-2032
Figure 210: Asia Pacific Market Attractiveness by Country, 2022-2032
Figure 211: MEA Market Value (US$ Mn) by Cap Type, 2022-2032
Figure 212: MEA Market Value (US$ Mn) by Bottle Capacity, 2022-2032
Figure 213: MEA Market Value (US$ Mn) by Visibility, 2022-2032
Figure 214: MEA Market Value (US$ Mn) by Neck Type, 2022-2032
Figure 215: MEA Market Value (US$ Mn) by End-user Industry, 2022-2032
Figure 216: MEA Market Value (US$ Mn) by Barrier Type, 2022-2032
Figure 217: MEA Market Value (US$ Mn) by Country, 2022-2032
Figure 218: MEA Market Value (US$ Mn) Analysis by Country, 2017-2032
Figure 219: MEA Market Volume (Unit) Analysis by Country, 2017-2032
Figure 220: MEA Market Value Share (%) and BPS Analysis by Country, 2022-2032
Figure 221: MEA Market Y-o-Y Growth (%) Projections by Country, 2022-2032
Figure 222: MEA Market Value (US$ Mn) Analysis by Cap Type, 2017-2032
Figure 223: MEA Market Volume (Unit) Analysis by Cap Type, 2017-2032
Figure 224: MEA Market Value Share (%) and BPS Analysis by Cap Type, 2022-2032
Figure 225: MEA Market Y-o-Y Growth (%) Projections by Cap Type, 2022-2032
Figure 226: MEA Market Value (US$ Mn) Analysis by Bottle Capacity, 2017-2032
Figure 227: MEA Market Volume (Unit) Analysis by Bottle Capacity, 2017-2032
Figure 228: MEA Market Value Share (%) and BPS Analysis by Bottle Capacity, 2022-2032
Figure 229: MEA Market Y-o-Y Growth (%) Projections by Bottle Capacity, 2022-2032
Figure 230: MEA Market Value (US$ Mn) Analysis by Visibility, 2017-2032
Figure 231: MEA Market Volume (Unit) Analysis by Visibility, 2017-2032
Figure 232: MEA Market Value Share (%) and BPS Analysis by Visibility, 2022-2032
Figure 233: MEA Market Y-o-Y Growth (%) Projections by Visibility, 2022-2032
Figure 234: MEA Market Value (US$ Mn) Analysis by Neck Type, 2017-2032
Figure 235: MEA Market Volume (Unit) Analysis by Neck Type, 2017-2032
Figure 236: MEA Market Value Share (%) and BPS Analysis by Neck Type, 2022-2032
Figure 237: MEA Market Y-o-Y Growth (%) Projections by Neck Type, 2022-2032
Figure 238: MEA Market Value (US$ Mn) Analysis by End-user Industry, 2017-2032
Figure 239: MEA Market Volume (Unit) Analysis by End-user Industry, 2017-2032
Figure 240: MEA Market Value Share (%) and BPS Analysis by End-user Industry, 2022-2032
Figure 241: MEA Market Y-o-Y Growth (%) Projections by End-user Industry, 2022-2032
Figure 242: MEA Market Value (US$ Mn) Analysis by Barrier Type, 2017-2032
Figure 243: MEA Market Volume (Unit) Analysis by Barrier Type, 2017-2032
Figure 244: MEA Market Value Share (%) and BPS Analysis by Barrier Type, 2022-2032
Figure 245: MEA Market Y-o-Y Growth (%) Projections by Barrier Type, 2022-2032
Figure 246: MEA Market Attractiveness by Cap Type, 2022-2032
Figure 247: MEA Market Attractiveness by Bottle Capacity, 2022-2032
Figure 248: MEA Market Attractiveness by Visibility, 2022-2032
Figure 249: MEA Market Attractiveness by Neck Type, 2022-2032
Figure 250: MEA Market Attractiveness by End-user Industry, 2022-2032
Figure 251: MEA Market Attractiveness by Barrier Type, 2022-2032
Figure 252: MEA Market Attractiveness by Country, 2022-2032
Need specific information?
Request CustomizationExplore Packaging Insights
View Reports