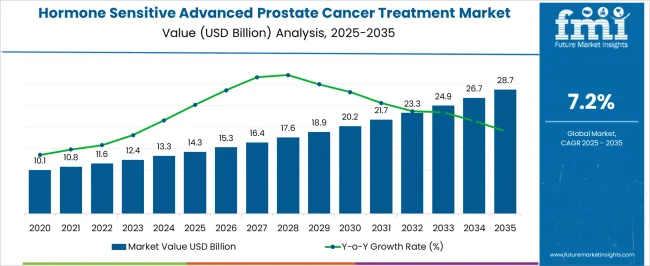
The Hormone Sensitive Advanced Prostate Cancer Treatment Market is estimated to be valued at USD 14.3 billion in 2025 and is projected to reach USD 28.7 billion by 2035, registering a compound annual growth rate (CAGR) of 7.2% over the forecast period.
| Metric | Value |
|---|---|
| Hormone Sensitive Advanced Prostate Cancer Treatment Market Estimated Value in (2025 E) | USD 14.3 billion |
| Hormone Sensitive Advanced Prostate Cancer Treatment Market Forecast Value in (2035 F) | USD 28.7 billion |
| Forecast CAGR (2025 to 2035) | 7.2% |
The hormone sensitive advanced prostate cancer treatment market is experiencing sustained growth as a result of rising prevalence of prostate cancer, advancements in hormone based therapies, and broader access to oncology care. Increasing patient awareness and early diagnosis initiatives have expanded the eligible treatment pool, while research into novel androgen suppression strategies has enhanced efficacy and patient survival outcomes.
Healthcare systems are prioritizing integrated cancer care, leading to greater availability of advanced hormonal treatment options in both developed and emerging markets. Favorable reimbursement structures and continuous clinical trial activity are further reinforcing adoption.
With strong emphasis on personalized medicine and improved quality of life for patients, the market outlook remains positive, offering opportunities for both established pharmaceutical players and new entrants.
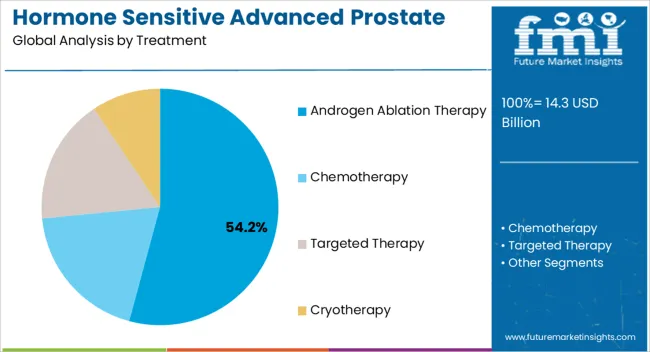
The androgen ablation therapy segment is projected to account for 54.20% of total revenue by 2025 within the treatment category, positioning it as the dominant therapeutic approach. This share is driven by its effectiveness in reducing androgen levels, which play a critical role in prostate cancer progression.
The therapy has been widely adopted due to its proven ability to slow disease advancement, extend survival, and improve patient quality of life. Clinical guidelines continue to prioritize androgen ablation as a first line option, and ongoing innovation in drug formulations has enhanced patient adherence and tolerability.
The strong clinical evidence base and widespread acceptance of this therapy have reinforced its leadership position within the treatment category.
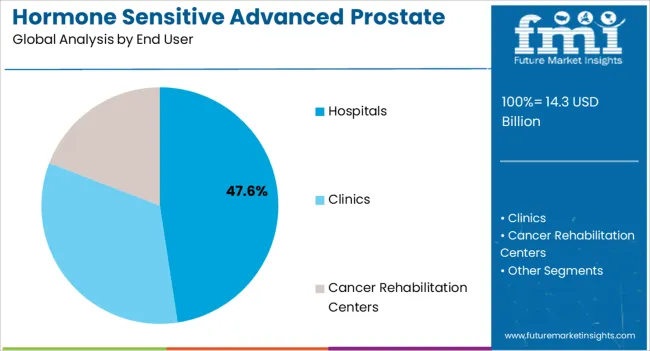
The hospitals segment is expected to hold 47.60% of the total market revenue by 2025 under the end user category, making it the leading segment. This dominance is attributed to the availability of advanced oncology infrastructure, multidisciplinary care teams, and access to specialized treatment regimens in hospital settings.
Hospitals serve as primary centers for prostate cancer diagnosis, treatment, and monitoring, which has bolstered their role in delivering hormone based therapies. Moreover, hospitals benefit from clinical trial participation, enabling access to the latest therapeutic innovations.
With growing patient preference for comprehensive cancer care delivered in hospital environments, this segment continues to lead, reflecting its central role in the treatment landscape.
The global hormone-sensitive advanced prostate cancer treatment market grew at a CAGR of 6.6% from 2020 to 2025, as per Future Market Insights, a provider of market research and competitive intelligence.
The treatment landscape for patients with hormone-sensitive prostate cancer (HSPC) has changed dramatically in the past five years, despite little change in the preceding 20 years. Such rapid change can make it difficult for clinicians to remain abreast of the current literature and synthesize the relevant data to inform evidence-based treatment decisions.
Although analyses encompassing men with low- and high-volume metastases failed to demonstrate a significant survival benefit for radiotherapy treatment to the prostate, new data demonstrate a benefit for men with low-volume metastatic disease.
Ongoing trials will assess whether this applies to local surgical treatment. Similarly, metastasis-directed therapy appears beneficial among carefully selected patients.
New agents are constantly being developed and evaluated in the HSPC space. As mentioned above, given the advent of more recent changes in therapy for the hormonal-sensitive cancer disease, it notably uses ADT plus docetaxel as the standard of care treatment and examines the addition of darolutamide to this regimen.
Given the favorable results with darolutamide in the castrate-resistant space, this may also have a role within the early HSPC realm.
The increasing male geriatric population
It acts as a major driver for the prostate cancer drugs market. Prostate cancer is one of the most common types of cancer in men aged above 60.
According to ACL (Administration for Community Living), a US-based government organization, the geriatric population is expected to increase by 21.6% by 2040. Among those populations, men are affected more by prostate cancer than women.
For example, in January 2025, according to the American Cancer Society, a US-based organization, prostate cancer develops in older men and non-Hispanic black men, and about 6 cases in 10 are diagnosed in men who are 65 or older (geriatric population). Therefore, the increasing men’s geriatric population drives the prostate cancer market.
Advancements in Cancer Detection Technology
The driving factor for the hormone-sensitive advanced prostate cancer treatment market is the advancement in technologies, personalized medicines, and cost-effective treatment procedures are some of the factors that are expected to provide a boost to the hormone-sensitive advanced prostate cancer treatment market.
Limited Availability of Drugs
Limited commercial availability of drugs and treatments for this cancer is the challenge restraining the growth of the global hormone-sensitive prostate cancer treatment market.
The high cost associated with the treatment will obstruct the growth rate of the market. As per the American Cancer Society, prostate cancer costs on average USD 4,300 upfront and USD 9,100 over five years, with surgery costing USD 15,000 upfront and USD 19,000 over five years.
Hormone therapy with radiation costs USD 17,500 upfront and USD 25,000 over five years. Costs for patients with advanced or metastatic prostate cancer might exceed USD 100,000.
On the other hand, the lack of healthcare infrastructure in developing economies and the dearth of skilled professionals will challenge the hormone-sensitive advanced prostate cancer treatment market. Additionally, lack of awareness among people and unfavorable healthcare policies will act as restraints and further impede the growth rate of the market during the forecast period.
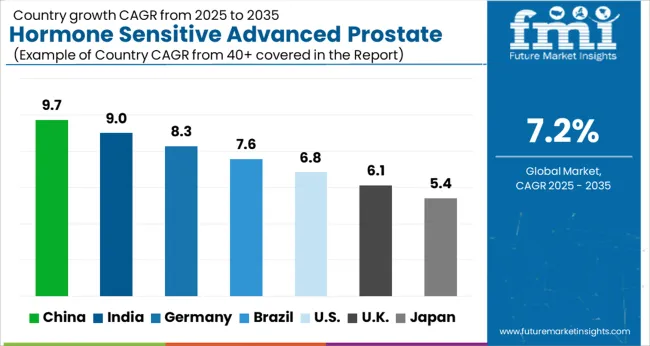
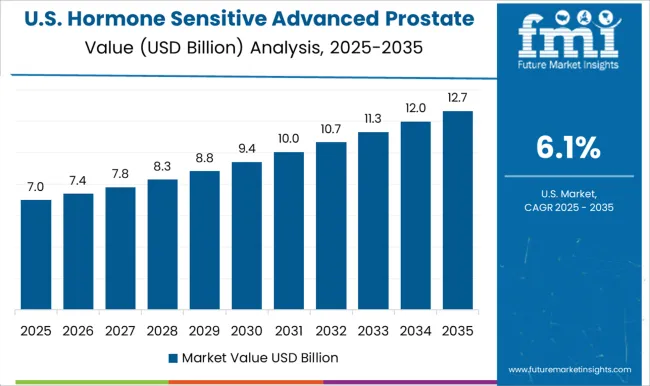
North America accounted for the largest revenue share in the hormone-sensitive advanced prostate cancer treatment market in 2025, and is expected to continue its dominance over the forecast period.
This growth is attributable to a high prevalence of the disease, the presence of regional players, and favorable reimbursement policies. Changing lifestyle is another factor adding to the prevalence of diseases.
The local presence of regulatory entities in North American countries is expected to boost the development of therapies shortly. This is mainly because these entities play a pivotal role in creating awareness among people about the potential of immunotherapy in cancer management.
In Europe, the market for hormone-sensitive advanced prostate cancer treatment is expected to grow at a significant rate during the forecast period due to the combined efforts of several governments & private institutes, such as the European Organization for Research and Treatment of Cancer (EORTC) and the European Medicines Agency (EMA), to develop unique programs focusing on multiple approaches in drug development.
In Asia Pacific, the market for hormone-sensitive advanced prostate cancer treatment is expected to grow at a lucrative rate during the forecast period due to the presence of leading oncology companies and an increase in R&D investments in countries such as China and Japan.
This, in turn, has led to an increase in the development of prostate cancer drugs. Moreover, the cost of clinical trials in developing countries is lesser than that in developed countries.
The demand for hospitals will be more during the forecast period.
According to a report by Future Market Insights, the hospital pharmacies would grow within the anticipated time frame. This market sector is expected to hold a greater share of the worldwide market from 2025 to 2035.
Due to the growing number of people visiting hospitals for advice on treatment related to hormonal cancer, the hospital pharmacy is anticipated to dominate the worldwide hormone-sensitive advanced prostate cancer treatment market.
As a result, individuals more pertain towards their health and well-being. Thus, the majority of consumers are expected to only buy medications from hospital pharmacies.
Androgen ablation therapy is said to hold a dominant share
The goal of this treatment is to reduce levels of male hormones, called androgens, in the body, or to stop them from fueling prostate cancer cell growth.
Androgens stimulate prostate cancer cells to grow. The main androgens in the body are testosterone and dihydrotestosterone (DHT). Most androgens are made by the testicles, but the adrenal glands (glands that sit above your kidneys) as well as the prostate cancer cells themselves, can also make androgens.
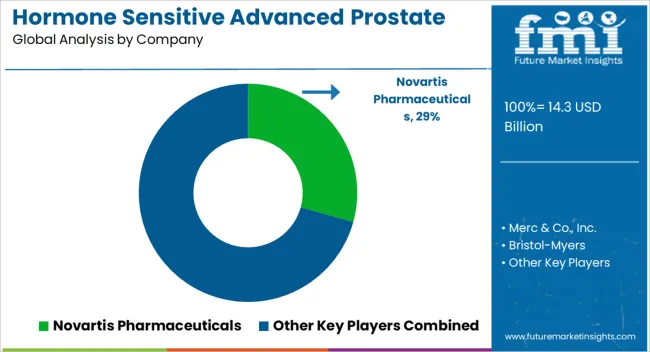
Some of the prominent players in the global market for Hormone Sensitive Advanced Prostate Cancer Market treatment are
Some of the important developments of the key players in the market are
| Report Attribute | Details |
|---|---|
| Growth Rate | CAGR of 7.2% from 2025 to 2035 |
| Market value in 2025 | USD 14.3 billion |
| Market value in 2035 | USD 28.7 billion |
| Base Year for Estimation | 2025 |
| Historical Data | 2020 to 2025 |
| Forecast Period | 2025 to 2035 |
| Quantitative Units | USD billion for Value and CAGR from 2025 to 2035 |
| Report Coverage | Revenue Forecast, Company Ranking, Competitive Landscape, Growth Factors, Trends, and Pricing Analysis |
| Segments Covered | Treatment, End-User, Region |
| Regions Covered | North America; Latin America; Europe; South Asia; East Asia; Oceania; Middle East & Africa |
| Key Countries Profiled | United States, Canada, Brazil, Mexico, Germany, United Kingdom, France, Spain, Italy, India, Malaysia, Singapore, Thailand, China, Japan, South Korea, Australia, New Zealand, GCC countries, South Africa, Israel |
| Key Companies Profiled | Novartis Pharmaceuticals; Merc & Co., Inc.; Bristol-Myers; Dendreon Corporation; GlaxoSmithKline plc.; Ferring International Center S.A.; Roche Group; Celgen Corporation; Amgen Inc.; Teva Pharmaceutical Industries Ltd. |
| Customization Scope | Available on Request |
The global hormone sensitive advanced prostate cancer treatment market is estimated to be valued at USD 14.3 billion in 2025.
The market size for the hormone sensitive advanced prostate cancer treatment market is projected to reach USD 28.7 billion by 2035.
The hormone sensitive advanced prostate cancer treatment market is expected to grow at a 7.2% CAGR between 2025 and 2035.
The key product types in hormone sensitive advanced prostate cancer treatment market are androgen ablation therapy, chemotherapy, targeted therapy and cryotherapy.
In terms of end user, hospitals segment to command 47.6% share in the hormone sensitive advanced prostate cancer treatment market in 2025.


Full Research Suite comprises of:
Market outlook & trends analysis
Interviews & case studies
Strategic recommendations
Vendor profiles & capabilities analysis
5-year forecasts
8 regions and 60+ country-level data splits
Market segment data splits
12 months of continuous data updates
DELIVERED AS:
PDF EXCEL ONLINE
Hormone Replacement Therapy Market Insights – Growth & Demand 2025–2035
Hormone Sensitive Prostate Cancer Market – Trends & Forecast 2025 to 2035
Growth Hormone Inhibiting Hormone Drugs Market Size and Share Forecast Outlook 2025 to 2035
Continuous Hormone Monitoring Market Analysis - Size, Share, and Forecast Outlook 2025 to 2035
Human Growth Hormone (HGH) Treatment and Drugs Market Trends - Growth & Forecast 2025 to 2035
Compounded Bioidentical Hormone Therapy Market
Sensitive Skin Solutions Market Size and Share Forecast Outlook 2025 to 2035
Sensitive Skin Body Lotion Market Analysis - Size and Share Forecast Outlook 2025 to 2035
Sensitive Stomach Cat Food Market
Photosensitive Alignment Film Market Size and Share Forecast Outlook 2025 to 2035
Photosensitive Semiconductor Market Size and Share Forecast Outlook 2025 to 2035
Time Sensitive Networking TSN Market Size and Share Forecast Outlook 2025 to 2035
Acid-Sensitive APIs Market Analysis - Size, Share, and Forecast Outlook 2025 to 2035
Heat-Sensitive Cups Market is segmented by material type, capacity, and end-use from 2025 to 2035
Pressure Sensitive Labeling Machine Market Size and Share Forecast Outlook 2025 to 2035
Pressure-Sensitive Adhesives Market Size and Share Forecast Outlook 2025 to 2035
Pressure Sensitive Tapes and Labels Market Size, Share & Forecast 2025 to 2035
UV and Light Sensitive Packaging Market Size and Share Forecast Outlook 2025 to 2035
Electronic Pressure Sensitive Tape Dispenser Market
Treatment-Resistant Hypertension Management Market Size and Share Forecast Outlook 2025 to 2035

Thank you!
You will receive an email from our Business Development Manager. Please be sure to check your SPAM/JUNK folder too.
Chat With
MaRIA