The Indonesia Faith-based Tourism Market is estimated to be valued at USD 402.6 million in 2025 and is projected to reach USD 1174.4 million by 2035, registering a compound annual growth rate (CAGR) of 11.3% over the forecast period.
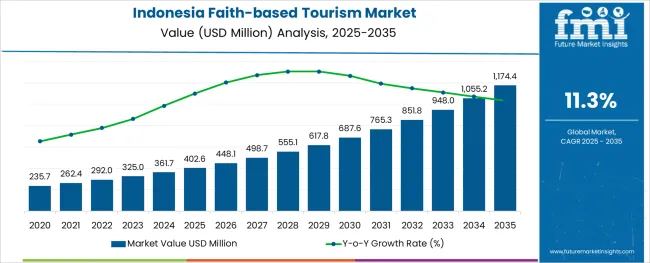
The Indonesia faith-based tourism market is witnessing steady growth, underpinned by a rise in spiritual awareness, cultural revival initiatives, and infrastructure development tailored to religious travel experiences. As the world's largest Muslim-majority country with significant religious and cultural diversity, Indonesia is leveraging its spiritual assets to attract both domestic and international faith-driven travelers.
Government-backed initiatives to promote religious heritage sites and community-led tourism programs have encouraged broader participation in pilgrimage routes and spiritual retreats. Increased accessibility to religious destinations, improvements in transportation, and integration of wellness with faith-centered experiences are further expanding the market’s reach.
Digital platforms are streamlining booking and itinerary management for faith-based trips, while tailored offerings for specific demographic groups are boosting repeat travel. Looking forward, the market is expected to benefit from strategic partnerships among travel agencies, religious institutions, and tourism boards focused on sustainable and inclusive tourism growth.
The market is segmented by Tourism Type, Consumer Orientation, Tour Type, Booking Channel, Tourist Type, and Age Group and region. By Tourism Type, the market is divided into Day Trips & Local Gateways, Museums, Pilgrimages, Religious and Heritage Tours, and Others. In terms of Consumer Orientation, the market is classified into Women, Children, and Men. Based on Tour Type, the market is segmented into Tour Groups, Package Travelers, and Independent Travelers. By Booking Channel, the market is divided into Online Booking, In Person Booking, and Phone Booking. By Tourist Type, the market is segmented into Domestic and International. By Age Group, the market is segmented into 36-45 Years, 46-55 Years, 66-75 Years, 15-25 Years, and 26-35 Years. Regionally, the market is classified into North America, Latin America, Western Europe, Eastern Europe, Balkan & Baltic Countries, Russia & Belarus, Central Asia, East Asia, South Asia & Pacific, and the Middle East & Africa.
The market is segmented by Tourism Type, Consumer Orientation, Tour Type, Booking Channel, Tourist Type, and Age Group and region. By Tourism Type, the market is divided into Day Trips & Local Gateways, Museums, Pilgrimages, Religious and Heritage Tours, and Others. In terms of Consumer Orientation, the market is classified into Women, Children, and Men. Based on Tour Type, the market is segmented into Tour Groups, Package Travelers, and Independent Travelers. By Booking Channel, the market is divided into Online Booking, In Person Booking, and Phone Booking. By Tourist Type, the market is segmented into Domestic and International. By Age Group, the market is segmented into 36-45 Years, 46-55 Years, 66-75 Years, 15-25 Years, and 26-35 Years. Regionally, the market is classified into North America, Latin America, Western Europe, Eastern Europe, Balkan & Baltic Countries, Russia & Belarus, Central Asia, East Asia, South Asia & Pacific, and the Middle East & Africa.
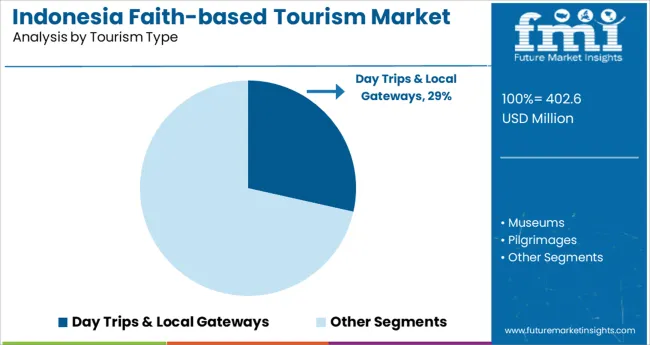
The day trips and local gateways segment is anticipated to account for 28.5% of the total market revenue in 2025, making it a key driver in the tourism type category. Its growth has been supported by the increasing preference for short-duration, accessible faith experiences that align with urban lifestyles and busy schedules.
The widespread presence of religious landmarks within city limits or near metropolitan areas has made day trips more feasible and affordable for a broader demographic. Additionally, community religious events, weekend spiritual programs, and local pilgrimage initiatives have been instrumental in driving this segment forward.
The convenience of same-day travel without overnight costs, combined with guided access to regional religious sites, has encouraged participation from both individual and group travelers seeking meaningful yet time-efficient experiences. The rising number of intercity transit links and mobile-based itinerary planning tools have further simplified day-trip logistics, consolidating its share within the faith-based tourism structure.
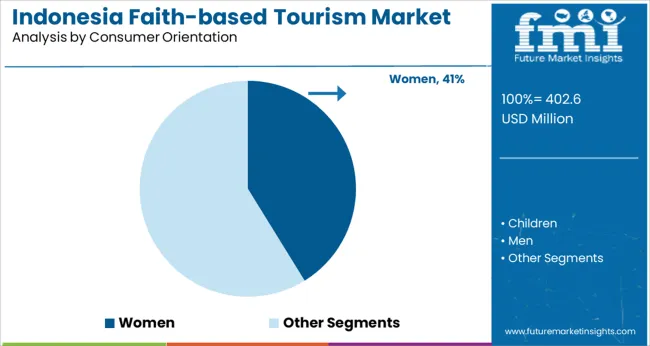
The women segment is projected to contribute 41.2% of the overall market revenue in 2025, ranking it as the leading consumer orientation in the Indonesia faith-based tourism market. This growth is being driven by an increase in women-centric travel communities, religious study groups, and spiritual wellness movements that prioritize female participation.
Enhanced safety protocols, gender-sensitive travel arrangements, and dedicated female guides have improved comfort and trust, encouraging higher engagement from women across age groups. Faith-based retreats focusing on mindfulness, moral development, and social bonding are increasingly curated to serve women-led groups.
Furthermore, the rise of social media networks and digital storytelling platforms has enabled the sharing of spiritual travel experiences, further inspiring women to seek out religious tourism as a means of personal growth and social connection. The continued alignment of travel services with the values and needs of female travelers is expected to uphold this segment’s lead in the coming years.
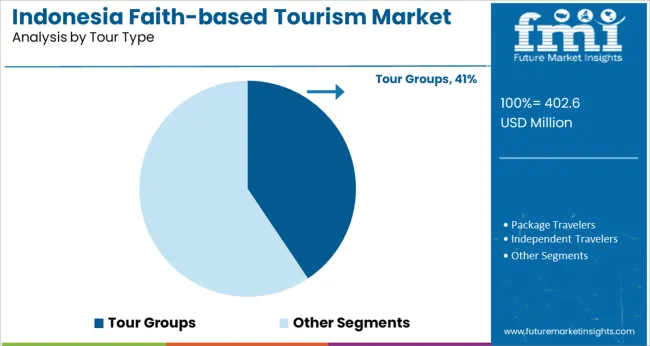
The tour groups segment is expected to represent 40.6% of total revenue in 2025, making it the dominant category under tour type. This leadership is attributed to the cultural and logistical preferences of Indonesian faith travelers, who often seek collective pilgrimage and guided spiritual learning experiences.
Group travel offers structured itineraries, religious guidance, and communal worship opportunities, which align with the social dimensions of faith-based journeys. The assurance of safety, affordability through shared costs, and coordination by experienced tour leaders have made group packages a preferred choice for both first-time and repeat travelers.
Religious institutions and community centers continue to play a key role in organizing group tours to local and international destinations, further supporting the segment’s expansion. Additionally, government and private tour operators are introducing standardized packages with inclusive services that cater to group needs, reinforcing the trust and convenience that define this segment’s strong market position.
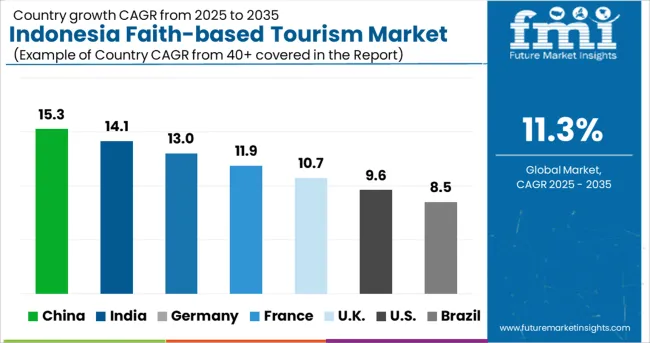
As per Future Market Insights (FMI), the demand in the faith-based tourism market in Indonesia is projected to gain traction at an 11.3% CAGR through 2035, in comparison to the 11.1% CAGR registered between 2020 to 2024.
Every year, over ten million international visitors visit Indonesia to experience the country's rich natural heritage, beaches, wildlife-filled tropical jungles, various cultural traditions, culinary delicacies, and vibrant cities. Indonesia is becoming a significant tourism destination in Southeast Asia, boasting the world's biggest tropical coastline and famous cultural heritage sites spread across more than 17,000 islands and 300 tribes.
Religious tourism in Indonesia has grown at an exponential rate in recent years. Indonesia is one of the most popular locations for both local and international religious tourists. Tourism allows international visitors to learn about and experience Indonesia’s cultural richness firsthand.
High Popularity of Religious Heritage Sites Are Fueling Sales
Religious individuals are seeking to connect with themselves by visiting holy sites. Data from the Central Bureau of Statistics Indonesia shows that 87.18% of the total population of Indonesia are Muslims. The form of religious tourism which is widely followed by Muslims and other tourists in Indonesia is to follow a pilgrimage to the tomb of the Wali (Guardian), both Wali limo and Wali Songo.
Travelers are Interested in Historic and Cultural Locations in Indonesia
In terms of total market revenue, the Indonesia faith-based market is expected to account for a dominant share of the global faith-based tourism market. Indonesia is a pilgrimage site for Islam, Hinduism, Buddhism, Confucianism, Catholicism, Christianity, and even a variety of indigenous beliefs totaling 245 faiths.
Prambanan temple in Bali, Borobudur temple, and wali songo/wali limo pilgrimage are some examples of religious tourism in Indonesia.
Rising Expenditure for Improving Public Infrastructure in Indonesia Will Boost Sales
The Indonesian government is actively taking steps toward the recovery of the tourism sector in the country. In 2025, The Ministry of Tourism And Creative Economy collaborated with a global travel agency (OTA) platform in order to help stimulate the recovery of tourism in Indonesia.
In recent years, Indonesia's Ministry of Tourism and Creative Economy established Muslim Guides, as well as a special committee to oversee the growth and marketing of halal tourism. Lombok, West Sumatra, and Aceh are some of the most competitive tourism zones in Indonesia.
Faith-based tourism is particularly popular among Middle-aged Travelers
The age group 46-55 has the greatest number of visitors when compared to the other age groups. This group is more likely to visit religious sites and they are more interested in visiting art, culture, customs, and architecture sites.
Tourists are Preferring Package Excursions in Indonesia
Tour packages include essential paperwork, transit expenses, food bills, and other important items to make it easier for international travelers to enjoy their visits. Tourists choose package travel because tour companies provide a variety of packages, including personalization of lodging, traveling, and food as well.
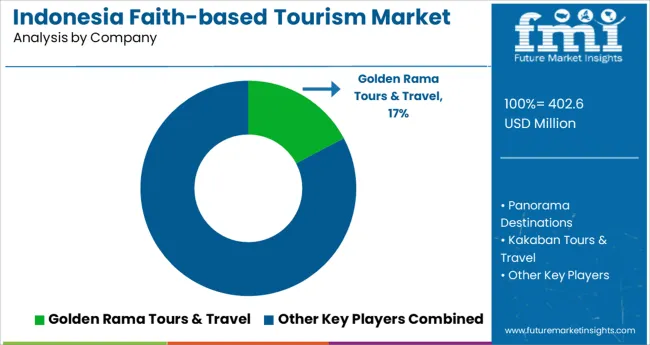
Leading players operating in Indonesia's faith-based tourism market are focusing on expansion and new products/ packages to improve sales in the market. They are also investing in promotional strategies to advertise their services on social media channels to gain a competitive edge in the market and to attract foreign visitors.
This, emerging start-ups in Indonesia are fueling the overall faith-based tourism sector in the country. From booking hotels to ride-hailing services, companies in Indonesia are striving to offer affordable and convenient services to gain prominence in the market. For instance:
| Attributes | Details |
|---|---|
| Estimated Market Size (2025) | USD 292 Million |
| Value-based CAGR (2025 to 2035) | 11.3% |
| Top 5 Players Share (2024) | 6% - 9% |
| Forecast Period | 2025 to 2035 |
| Historical Data Available for | 2020 to 2024 |
| Market Analysis | million for Value |
| Key Region Covered | South Asia |
| Key Countries Covered | Indonesia |
| Key Segments Covered | Tourism Type, Booking Channel, Tourist Type, Tour Type, Age Group, and Region. |
| Key Companies Profiled | Golden Rama Tours & Travel; Panorama Destinations; Kakaban Tours & Travel; Manta Dive; Flores Exotic Tour; The Seven Holiday; Gogonesia.com; H.I.S. Tours & Travel Jakarta; Chan Brothers Travel; Best Tour & Travel Indonesia; Avia Tour; Dwidaya Tour Mal Grand Indonesia; Smailing Tour; Wita Tour; Pan Travel; AntaVaya Group; Raptim Tours & Travel Indonesia;HOPE Travel |
| Report Coverage | Market Forecast, Company Share Analysis, Competition Intelligence, Drivers, Restraints, Opportunities and Threats Analysis, Market Dynamics and Challenges, and Strategic Growth Initiatives |
The global indonesia faith-based tourism market is estimated to be valued at USD 402.6 million in 2025.
It is projected to reach USD 1,174.4 million by 2035.
The market is expected to grow at a 11.3% CAGR between 2025 and 2035.
The key product types are day trips & local gateways, museums, pilgrimages, religious and heritage tours and others.
women segment is expected to dominate with a 41.2% industry share in 2025.


Full Research Suite comprises of:
Market outlook & trends analysis
Interviews & case studies
Strategic recommendations
Vendor profiles & capabilities analysis
5-year forecasts
8 regions and 60+ country-level data splits
Market segment data splits
12 months of continuous data updates
DELIVERED AS:
PDF EXCEL ONLINE
Indonesia Pet Care Market Size and Share Forecast Outlook 2025 to 2035
A Detailed Global Analysis of Brand Share for the Indonesia Pet Care Market
Industry Share & Competitive Positioning in Indonesia Baby Bottle Market
Indonesia Surfing Tourism Market Insights – Size, Growth & Forecast 2025–2035
Baby Bottle Industry Analysis In Indonesia Growth - Trends & Forecast 2025 to 2035
Indonesia Consumer Packaging Market Trends & Forecast 2024-2034
Indonesia Sustainable Tourism Market Growth – Forecast 2024-2034
Faith-Based Tourism Market Growth – Forecast 2024-2034
Japan Faith-based Tourism Market Size and Share Forecast Outlook 2025 to 2035
Egypt Faith-Based Tourism Market Trends - Growth & Forecast 2025 to 2035
Jordan Faith-Based Tourism Market Analysis – Trends & Forecast 2025 to 2035
South Africa Faith-Based Tourism Market Size and Share Forecast Outlook 2025 to 2035
Tourism Independent Contractor Model Market Size and Share Forecast Outlook 2025 to 2035
Tourism Industry Analysis in Japan - Size, Share, & Forecast Outlook 2025 to 2035
Tourism Market Trends – Growth & Forecast 2025 to 2035
Tourism Industry Big Data Analytics Market Analysis by Application, by End, by Region – Forecast for 2025 to 2035
Assessing Tourism Industry Loyalty Program Market Share & Industry Trends
Tourism Industry Loyalty Programs Sector Analysis by Program Type by Traveler Profile by Region - Forecast for 2025 to 2035
Market Share Insights of Tourism Security Service Providers
Tourism Security Market Analysis by Service Type, by End User, and by Region – Forecast for 2025 to 2035

Thank you!
You will receive an email from our Business Development Manager. Please be sure to check your SPAM/JUNK folder too.
Chat With
MaRIA