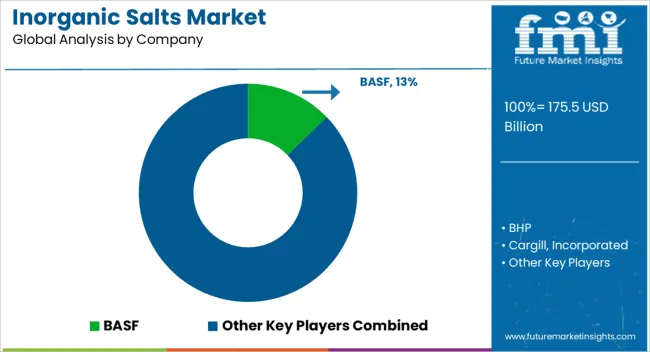
The Inorganic Salts Market is estimated to be valued at USD 175.5 billion in 2025 and is projected to reach USD 288.5 billion by 2035, registering a compound annual growth rate (CAGR) of 5.1% over the forecast period.
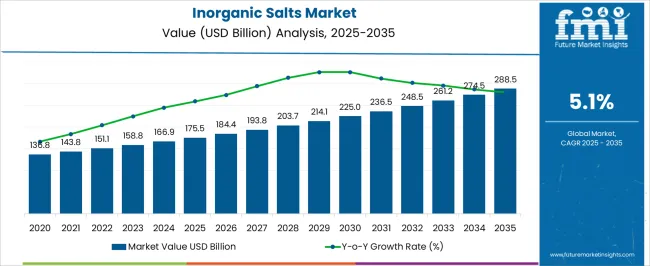
| Metric | Value |
|---|---|
| Inorganic Salts Market Estimated Value in (2025 E) | USD 175.5 billion |
| Inorganic Salts Market Forecast Value in (2035 F) | USD 288.5 billion |
| Forecast CAGR (2025 to 2035) | 5.1% |
The inorganic salts market is demonstrating steady growth, supported by their extensive use across industries ranging from agriculture and chemicals to food processing and pharmaceuticals. Their functional versatility, including roles as stabilizers, electrolytes, and reagents, has reinforced widespread adoption. Expanding agricultural activities are fueling higher consumption of fertilizers and soil conditioning agents, where inorganic salts are central to improving crop yields and supporting food security initiatives.
Additionally, rapid industrialization in emerging economies is driving demand for inorganic salts in manufacturing, textile processing, and water treatment applications. Growth in the pharmaceutical sector is further contributing, as certain inorganic salts are essential in formulations and diagnostic solutions. Regulatory support for sustainable farming and clean water initiatives is influencing production and adoption trends, ensuring market resilience.
As industries prioritize efficiency, cost optimization, and compliance with environmental standards, demand for high-quality inorganic salts is expected to expand Ongoing innovations in production methods and distribution networks are also reinforcing market opportunities, positioning inorganic salts as critical enablers across multiple value chains globally.
The inorganic salts market is segmented by product type, end-use industry, and geographic regions. By product type, inorganic salts market is divided into Sodium salts, Potassium salts, Calcium salts, Ammonium salts, Magnesium salts, and Others. In terms of end-use industry, inorganic salts market is classified into Agriculture, Pharmaceuticals, Food, Explosives, and Others. Regionally, the inorganic salts industry is classified into North America, Latin America, Western Europe, Eastern Europe, Balkan & Baltic Countries, Russia & Belarus, Central Asia, East Asia, South Asia & Pacific, and the Middle East & Africa.
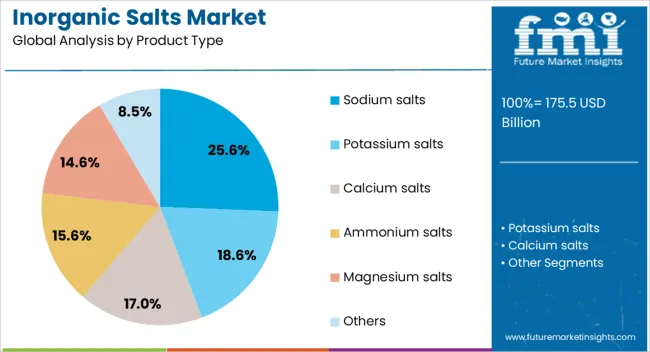
The sodium salts segment is expected to represent 25.6% of the inorganic salts market revenue share in 2025, establishing itself as the leading product type. This dominance is being attributed to the wide-ranging applications of sodium-based compounds across agriculture, water treatment, food preservation, and chemical processing industries. Their ability to act as effective stabilizers and electrolytes makes them highly adaptable for diverse use cases, driving sustained demand.
The agricultural sector, in particular, relies heavily on sodium salts in fertilizer formulations, enabling enhanced soil conditioning and improved crop productivity. In the water treatment sector, sodium-based salts are recognized for their role in neutralization and purification processes, supporting environmental and regulatory compliance.
Cost efficiency, abundant availability, and compatibility with large-scale industrial processes are further supporting the leadership of this product type As demand intensifies for materials that can balance performance with affordability, sodium salts are expected to maintain a strong presence in the market, with ongoing innovations in application-specific formulations strengthening their growth trajectory.
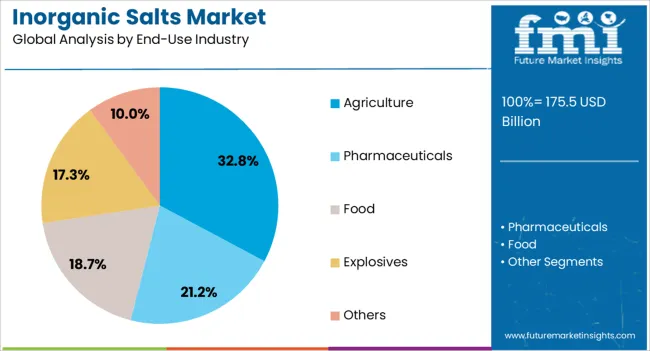
The agriculture segment is projected to account for 32.8% of the inorganic salts market revenue share in 2025, making it the leading end-use industry. Its dominance is being reinforced by the critical role of inorganic salts in enhancing soil fertility, improving plant health, and supporting higher agricultural productivity. Fertilizer formulations containing nitrogen, phosphorus, and potassium salts, along with specific sodium and calcium salts, are widely utilized to address nutrient deficiencies and improve crop yields.
The growing global population and the corresponding increase in food demand are driving agricultural intensification, thereby expanding the requirement for these essential compounds. Inorganic salts are also being adopted in animal feed supplements and aquaculture, further broadening their relevance in the agricultural value chain.
Government initiatives and subsidies promoting sustainable farming practices are encouraging the adoption of high-quality fertilizer inputs, accelerating market growth With agriculture continuing to form the backbone of emerging economies and playing a central role in food security strategies, the segment’s reliance on inorganic salts is expected to sustain its leadership position throughout the forecast period.
Inorganic salts are a broad category of numerous salts such as oxides, halides, carbonates, sulfates, acetates, chlorides, fluorides, hypochlorites, nitrates, phosphates, silicates and sulfides among others. The physical and chemical properties as well as uses of each of these classes of inorganic salts differ from each other.
Every class of these inorganic salts can be further differentiated on the basis of the attached functional group, for instance, carbonates can be attached with calcium, magnesium or potassium, to yield, calcium carbonate, magnesium carbonate or potassium carbonate respectively.
Inorganic salts are a part of the human body too. They are essential in maintaining several metabolic processes, conducting nerve impulses and are components of bones.
Inorganic salts find use across several industries. The growth of fertilizers and agrochemicals industry is one of the major drivers for the market of inorganic salts. The use of calcium salts, ammonium phosphate, nitrates, zinc salts and others to enhance the soil nutrient content are the primary factors propelling the growth of inorganic salts market.
In addition to this, the growing rubber industry is driving the growth of zinc oxide market which is a key ingredient for vulcanization of rubber. Magnesium oxide is an important inorganic salt. It finds application in pharmaceutical industry as an antacid, in cement production as Epsom salts and as an important component in paper manufacturing.
The growth of pharmaceutical industry and building & construction industry are other drivers for the market of inorganic salts. However, the toxic nature of some of the inorganic salts, for example, alkyl halides, such as chloroform and chloro flouro carbons are restraining the market of inorganic salts.
Research in biotechnology is opening new avenues for inorganic salts. Inorganic salts are used as reagents in modern biotechnological devices such as HPLC (High Pressure Liquid Chromatography). This is expected to open new areas of opportunity for the market of inorganic salts.
Inorganic salts have several end user industries. Zinc oxide is used in rubber processing, paints and chemicals, ceramics, agriculture and pharmaceutical industries. Additionally, it is used in small quantities in animal feed, as catalyst, as sulfur adsorbent and as fire retardant.
Phosphates find use in the fertilizer industry. Carbonates are used extensively in the construction industry. Silicates find use in glass manufacturing. Sulfides are used in healthcare industry and in optometry devices. Some forms of sulfides such as selenium sulfides are used in anti dandruff formulations too.
Countries such as Brazil, Argentina, China and the India are the major consumers of inorganic salts. The use of inorganic salts in fertilizers is wide spread in these countries. China consumes inorganic salts for the building & construction industry and for rubber processing industry.
Additionally, the Indian sub-continent is a major market for the production of generic drugs. The use of inorganic salts for medicines is widespread in these countries. China and some countries in EU make extensive use of acetate inorganic salts. They are used to produce fashion apparel, dress linings, home furnishings and upholstery.
Countries in the Middle East and USA make use of sulfates for chemical processing. Inorganic salts have numerous applications and are used extensively across the globe.
The report is a compilation of first-hand information, qualitative and quantitative assessment by industry analysts, inputs from industry experts, and industry participants across the value chain. The report provides an in-depth analysis of parent market trends, macroeconomic indicators and governing factors, along with market attractiveness within the segments. The report also maps the qualitative impact of various market factors on market segments and various geographies.
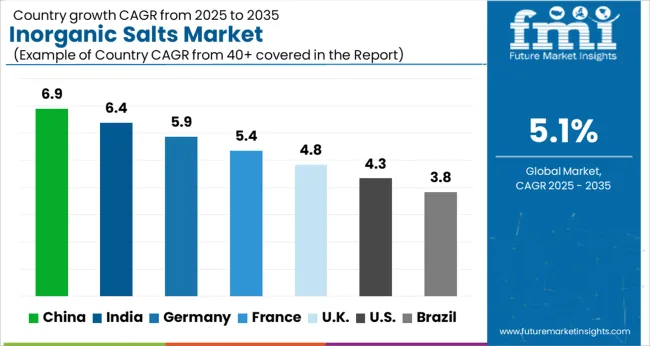
| Country | CAGR |
|---|---|
| China | 6.9% |
| India | 6.4% |
| Germany | 5.9% |
| France | 5.4% |
| UK | 4.8% |
| USA | 4.3% |
| Brazil | 3.8% |
The Inorganic Salts Market is expected to register a CAGR of 5.1% during the forecast period, exhibiting varied country level momentum. China leads with the highest CAGR of 6.9%, followed by India at 6.4%. Developed markets such as Germany, France, and the UK continue to expand steadily, while the USA is likely to grow at consistent rates. Brazil posts the lowest CAGR at 3.8%, yet still underscores a broadly positive trajectory for the global Inorganic Salts Market. In 2024, Germany held a dominant revenue in the Western Europe market and is expected to grow with a CAGR of 5.9%. The USA Inorganic Salts Market is estimated to be valued at USD 60.1 billion in 2025 and is anticipated to reach a valuation of USD 91.9 billion by 2035. Sales are projected to rise at a CAGR of 4.3% over the forecast period between 2025 and 2035. While Japan and South Korea markets are estimated to be valued at USD 9.4 billion and USD 5.5 billion respectively in 2025.
| Item | Value |
|---|---|
| Quantitative Units | USD 175.5 Billion |
| Product Type | Sodium salts, Potassium salts, Calcium salts, Ammonium salts, Magnesium salts, and Others |
| End-Use Industry | Agriculture, Pharmaceuticals, Food, Explosives, and Others |
| Regions Covered | North America, Europe, Asia-Pacific, Latin America, Middle East & Africa |
| Country Covered | United States, Canada, Germany, France, United Kingdom, China, Japan, India, Brazil, South Africa |
| Key Companies Profiled | BASF, BHP, Cargill, Incorporated, Compass Minerals, EuroChem Group, ICL, INEOS, Jordan Phosphate Mines Co. PLC, K+S Aktiengesellschaft, Lonza Group, Mosaic, Nutrien Ltd., Rio Tinto plc (Salt & Potash assets), Shandong Haihua Group, Solvay, Tata Chemicals, and Yara |
The global inorganic salts market is estimated to be valued at USD 175.5 billion in 2025.
The market size for the inorganic salts market is projected to reach USD 288.5 billion by 2035.
The inorganic salts market is expected to grow at a 5.1% CAGR between 2025 and 2035.
The key product types in inorganic salts market are sodium salts, potassium salts, calcium salts, ammonium salts, magnesium salts and others.
In terms of end-use industry, agriculture segment to command 32.8% share in the inorganic salts market in 2025.


Our Research Products

The "Full Research Suite" delivers actionable market intel, deep dives on markets or technologies, so clients act faster, cut risk, and unlock growth.

The Leaderboard benchmarks and ranks top vendors, classifying them as Established Leaders, Leading Challengers, or Disruptors & Challengers.

Locates where complements amplify value and substitutes erode it, forecasting net impact by horizon

We deliver granular, decision-grade intel: market sizing, 5-year forecasts, pricing, adoption, usage, revenue, and operational KPIs—plus competitor tracking, regulation, and value chains—across 60 countries broadly.

Spot the shifts before they hit your P&L. We track inflection points, adoption curves, pricing moves, and ecosystem plays to show where demand is heading, why it is changing, and what to do next across high-growth markets and disruptive tech

Real-time reads of user behavior. We track shifting priorities, perceptions of today’s and next-gen services, and provider experience, then pace how fast tech moves from trial to adoption, blending buyer, consumer, and channel inputs with social signals (#WhySwitch, #UX).

Partner with our analyst team to build a custom report designed around your business priorities. From analysing market trends to assessing competitors or crafting bespoke datasets, we tailor insights to your needs.
Supplier Intelligence
Discovery & Profiling
Capacity & Footprint
Performance & Risk
Compliance & Governance
Commercial Readiness
Who Supplies Whom
Scorecards & Shortlists
Playbooks & Docs
Category Intelligence
Definition & Scope
Demand & Use Cases
Cost Drivers
Market Structure
Supply Chain Map
Trade & Policy
Operating Norms
Deliverables
Buyer Intelligence
Account Basics
Spend & Scope
Procurement Model
Vendor Requirements
Terms & Policies
Entry Strategy
Pain Points & Triggers
Outputs
Pricing Analysis
Benchmarks
Trends
Should-Cost
Indexation
Landed Cost
Commercial Terms
Deliverables
Brand Analysis
Positioning & Value Prop
Share & Presence
Customer Evidence
Go-to-Market
Digital & Reputation
Compliance & Trust
KPIs & Gaps
Outputs
Full Research Suite comprises of:
Market outlook & trends analysis
Interviews & case studies
Strategic recommendations
Vendor profiles & capabilities analysis
5-year forecasts
8 regions and 60+ country-level data splits
Market segment data splits
12 months of continuous data updates
DELIVERED AS:
PDF EXCEL ONLINE
Inorganic Cobalt Blue Pigments Market Size and Share Forecast Outlook 2025 to 2035
Inorganic Scintillators Market Size and Share Forecast Outlook 2025 to 2035
Inorganic filler Market Size and Share Forecast Outlook 2025 to 2035
Inorganic Oxides Market Size and Share Forecast Outlook 2025 to 2035
Inorganic Zinc Coatings Market Size and Share Forecast Outlook 2025 to 2035
Inorganic Fungicide Market - Growth & Demand 2025 to 2035
Industry Share Analysis for Inorganic Scintillators Companies
Inorganic Flame Retardants Market
Inorganic Ion Exchange Materials Market
White Inorganic Pigment Market Size and Share Forecast Outlook 2025 to 2035
Soap Salts Market Size and Share Forecast Outlook 2025 to 2035
Bath Salts Market Analysis - Size, Share, and Forecast Outlook 2025 to 2035
Cesium Salts Market Size and Share Forecast Outlook 2025 to 2035
Gourmet Salts Market Analysis – Size, Share, and Forecast Outlook 2025 to 2035
Chromium Salts Market Trends - Growth, Demand & Forecast 2025 to 2035
Phosphate Salts Market Size and Share Forecast Outlook 2025 to 2035
Quenching Fluids & Salts Market Size and Share Forecast Outlook 2025 to 2035
Sodium, Potassium and Calcium Salts Market Analysis by Agriculture, Pharmaceuticals and Personal Care Through 2035

Thank you!
You will receive an email from our Business Development Manager. Please be sure to check your SPAM/JUNK folder too.
Chat With
MaRIA