The IR Corrected Lenses Market is valued at USD 73.4 million in 2025 and is forecasted to reach USD 137.8 million by 2035, growing at a CAGR of 6.5%. In the short term, the market exhibits steady growth, with the first three years showing a rise from USD 73.4 million in 2025 to USD 88.7 million in 2028. This trajectory highlights a consistent YoY increase of approximately 6.5%, indicating stable demand for infrared-corrected optical lenses across industrial, medical, and consumer electronics applications. Early-stage growth is primarily driven by increasing adoption in surveillance systems, medical imaging devices, and advanced optical instruments, setting the foundation for subsequent expansion in the decade ahead.
The global IR corrected lenses market is valued at USD 73.4 million in 2025 and is slated to reach USD 137.8 million by 2035, recording an absolute increase of USD 64.4 million over the forecast period. This translates into a total growth of 87.7%, with the market forecast to expand at a compound annual growth rate (CAGR) of 6.5% between 2025 and 2035. The overall market size is expected to grow by nearly 1.88X during the same period, supported by increasing demand for infrared imaging solutions, growing adoption of night vision technologies in security applications, and rising consumer preference for multi-spectral optical systems across diverse surveillance and automotive vision applications.
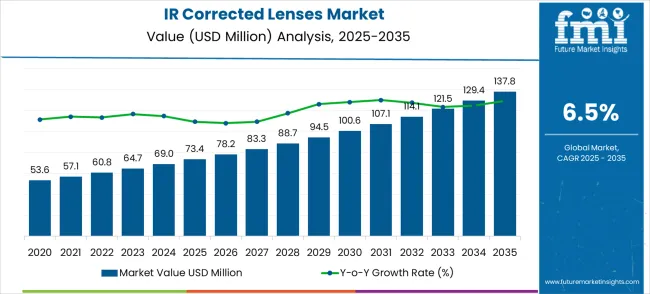
Long-term forecasting suggests that the market will maintain a stable upward trajectory, with value reaching USD 137.8 million by 2035. Mid-decade, the market progresses from USD 94.5 million in 2029 to USD 114.1 million in 2032, reflecting not only the CAGR but also a compounding effect from early adoption and scaling production capabilities. The lens technology continues to evolve, with manufacturers introducing improved coatings, enhanced IR correction, and higher durability, which collectively enhance market penetration.
Demand in industrial applications such as thermal imaging and night vision equipment is projected to accelerate the cumulative growth rate during this period. Between 2025 and 2030, the IR corrected lenses market is projected to expand from USD 73.4 million to USD 100.5 million, resulting in a value increase of USD 27.1 million, which represents 42.1% of the total forecast growth for the decade. This phase of development will be shaped by increasing demand for security surveillance, the rising adoption of infrared imaging systems, and the growing need for multi-spectral optical solutions in automotive night vision and industrial inspection applications. Manufacturers are expanding their IR corrected lenses capabilities to address the growing demand for day-night imaging solutions and enhanced optical performance.
| Metric | Value |
|---|---|
| Estimated Value in (2025E) | USD 73.4 million |
| Forecast Value in (2035F) | USD 137.8 million |
| Forecast CAGR (2025 to 2035) | 6.5% |
In an optimistic scenario, faster adoption in sectors like autonomous vehicles, defense optics, and high-end consumer electronics could push the market above USD 145 million by 2035, with slightly higher YoY growth rates averaging 7% annually. The base scenario aligns with the projected CAGR of 6.5%, resulting in the forecasted USD 137.8 million market size. Conversely, a pessimistic scenario accounting for slower industrial adoption, supply chain constraints, or technological substitution may limit market value to around USD 130 million by 2035, with YoY growth decelerating marginally in specific years.
The market demonstrates robust growth potential over the next decade, supported by technological innovation, expanding application areas, and global industrial demand. Early-stage adoption drives the base growth, while long-term projections suggest a stable and predictable expansion curve. The combination of short-term forecasting, long-term projections, and scenario analysis provides a comprehensive outlook, focusing the market’s resilience against volatility and reinforcing strategic opportunities for manufacturers and stakeholders in IR optics.From 2030 to 2035, the market is forecast to grow from USD 100.5 million to USD 137.8 million, adding another USD 37.3 million, which constitutes 57.9% of the overall ten-year expansion. This period is expected to be characterized by the expansion of zoom lens technologies and advanced optical coating systems, the integration of artificial intelligence and smart imaging capabilities, and the development of premium high-performance IR correction solutions. The growing adoption of autonomous vehicles and smart city infrastructure will drive demand for IR corrected lenses with enhanced image quality and superior environmental performance characteristics.
Between 2020 and 2025, the IR corrected lenses market experienced steady growth, driven by increasing demand for security surveillance systems and growing recognition of IR corrected lenses as essential components for day-night imaging applications with superior optical performance and infrared compatibility. The market developed as security system operators and automotive manufacturers recognized the potential for IR corrected lenses to improve imaging quality while maintaining optical precision across visible and infrared spectrums. Technological advancement in optical coatings and lens design began emphasizing the critical importance of maintaining image clarity and color accuracy in advanced multi-spectral imaging applications.
Market expansion is being supported by the increasing global demand for security surveillance solutions and the corresponding need for advanced optical systems that can provide superior day-night imaging performance and reliable infrared correction while maintaining optical clarity across various security monitoring and automotive vision applications. Modern surveillance system operators are increasingly focused on implementing optical solutions that can deliver consistent image quality across visible and infrared spectrums, minimize chromatic aberrations, and provide reliable performance in challenging lighting conditions. IR corrected lenses' proven ability to deliver superior multi-spectral performance, enhanced image quality, and versatile application compatibility make them essential components for contemporary security surveillance and automotive vision solutions.
The growing emphasis focus on autonomous vehicle development and smart city infrastructure is driving demand for IR corrected lenses that can support advanced driver assistance systems, enable night vision capabilities, and provide reliable performance in automotive and infrastructure monitoring applications with superior environmental durability. Optical system processors' preference for lenses that combine infrared correction with operational reliability and cost-effectiveness is creating opportunities for innovative IR corrected lens implementations. The rising influence of artificial intelligence and computer vision trends is also contributing to increased adoption of specialized optical lenses that can provide advanced imaging solutions without compromising optical quality or system performance.
The market is segmented by classification, application, and region. By classification, the market is divided into fixed focus lens and zoom lens. Based on application, the market is categorized into security monitoring, industrial visual inspection, automotive night vision system, traffic monitoring, and other. Regionally, the market is divided into North America, Europe, East Asia, South Asia & Pacific, Latin America, and the Middle East & Africa.
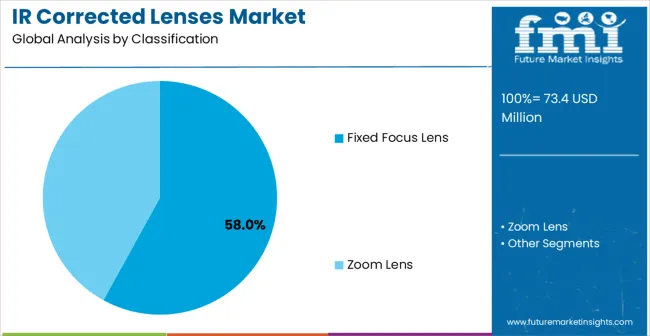
The fixed focus lens segment is projected to account for 58.0% of the IR corrected lenses market in 2025, reaffirming its position as the leading classification category. System integrators increasingly utilize fixed focus IR corrected lenses for their superior cost-effectiveness, proven optical stability, and convenience in standard surveillance applications across security monitoring, traffic surveillance, and industrial inspection systems. Fixed focus lens technology's established optical performance and consistent image output directly address the application requirements for reliable infrared correction and operational efficiency in cost-sensitive imaging environments.
This classification segment forms the foundation of modern surveillance system operations, as it represents the lens type with the greatest application versatility and established market demand across multiple security categories and monitoring requirements. System manufacturer investments in enhanced fixed focus lens technologies and optical coating systems continue to strengthen adoption among security professionals. With users prioritizing consistent optical performance and proven cost-effectiveness, fixed focus IR corrected lenses align with both performance objectives and budget requirements, making them the central component of comprehensive surveillance system strategies.
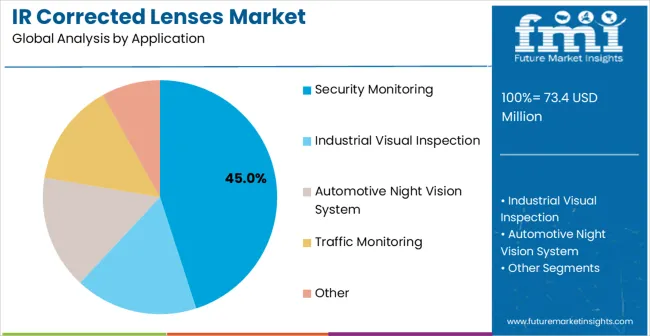
Security monitoring applications are projected to represent 45.0% of IR corrected lenses demand in 2025, underscoring highlighting their critical role as the primary application market for multi-spectral optical equipment in surveillance systems and security infrastructure applications. Security professionals prefer IR corrected lenses for their exceptional day-night performance, superior image consistency, and ability to deliver outstanding surveillance coverage while maintaining optical quality in demanding security environments. Positioned as essential components for modern security systems, IR corrected lenses offer both optical advantages and operational benefits.
The segment is supported by continuous growth in security infrastructure development and the growing availability of specialized optical technologies that enable premium surveillance with enhanced image quality and improved operational performance requirements. Additionally The , security system operators are investing in advanced optical systems to support comprehensive monitoring and threat detection for demanding security applications. As security requirements become more sophisticated and surveillance coverage increases, security monitoring will continue to dominate the end-user market while supporting advanced optical utilization and security innovation strategies.
The IR corrected lenses market is advancing steadily due to increasing demand for security surveillance systems and growing adoption of infrared imaging technologies that provide enhanced day-night performance and superior optical quality across diverse security monitoring and automotive vision applications. However T, the market faces challenges, including technical complexity requirements, price sensitivity considerations, and the need for specialized optical expertise investments. Innovation in smart coating technologies and automated manufacturing continues to influence product development and market expansion patterns.
The growing adoption of zoom lens configurations and enhanced coating systems is enabling optical manufacturers to produce premium IR corrected lenses with superior optical performance, enhanced infrared correction, and advanced image quality capabilities. Advanced optical systems provide improved imaging precision while allowing more versatile focal length options and consistent output across various infrared and visible spectrum applications. Manufacturers are increasingly recognizing the competitive advantages of advanced optical capabilities for product differentiation and premium market positioning in demanding surveillance segments.
Modern IR corrected lenses producers are incorporating AI-compatible optical designs and smart imaging features to enhance system integration, improve automated analysis, and ensure consistent performance delivery to surveillance operators and automotive engineers. These technologies improve system intelligence while enabling new applications, including automated threat detection and real-time image processing. Advanced AI integration also allows manufacturers to support premium positioning and operational excellence beyond traditional optical lens capabilities.
| Country | CAGR (2025-2035) |
|---|---|
| China | 8.8% |
| India | 8.1% |
| Germany | 7.5% |
| Brazil | 6.8% |
| USA | 6.2% |
| UK | 5.5% |
| Japan | 4.9% |
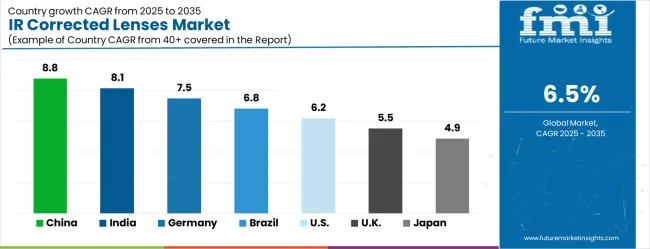
The global market is likely to grow at a CAGR of 6.5% between 2025 and 2035, driven by increasing demand in surveillance, military, and industrial imaging applications. China leads with 8.8% growth, supported by rapid adoption of advanced optical systems and expanding defense and security infrastructure. India follows at 8.1%, reflecting growing investments in imaging technologies and rising demand in industrial and research sectors. Germany records 7.5%, driven by high-precision optics manufacturing and adoption in automation and defense applications. Brazil is projected at 6.8%, supported by gradual expansion in industrial imaging and security systems. The United States grows at 6.2%, influenced by steady demand for advanced infrared optics, while the United Kingdom expands at 5.5% and Japan at 4.9%, reflecting consistent adoption in mature markets and specialized optical applications.The IR corrected lenses market is experiencing strong growth globally, with China leading at an 8.8% CAGR through 2035, driven by the expanding security surveillance industry, growing smart city development, and significant investment in infrared imaging infrastructure. India follows at 8.1%, supported by large-scale security system deployment, emerging surveillance facilities, and growing domestic demand for advanced optical technologies and monitoring systems. Germany shows growth at 7.5%, emphasizing technological innovation and premium optical component development. Brazil records 6.8%, focusing on security infrastructure expansion and surveillance system modernization. The USA demonstrates 6.2% growth, prioritizing advanced optical technologies and high-performance surveillance solutions. The UK exhibits 5.5% growth, emphasizing security capabilities and quality optical system adoption. Japan shows 4.9% growth, supported by precision optical manufacturing excellence and advanced imaging technology innovation.
The report covers an in-depth analysis of 40+ countries; seven top-performing countries are highlighted below.
China is forecasted to grow at a CAGR of 8.8% from 2025 to 2035, driven by increasing deployment of surveillance systems, machine vision, and autonomous driving technologies. IR corrected lenses are being widely adopted in smart city projects and AI-powered monitoring solutions. Local manufacturers are scaling production capacity with advanced coating technologies to reduce chromatic aberration and enhance clarity across multiple wavelengths. Collaboration with global optics firms is enhancing domestic expertise and accelerating innovation. High demand from electronics, automotive, and security sectors is reinforcing market expansion. Rising investments in facial recognition and biometric identification systems are further stimulating consumption of precision IR optics across both government and private sectors.
India is expected to grow at a CAGR of 8.1% during 2025–2035, supported by rising adoption in defense, industrial automation, and smart surveillance systems. IR corrected lenses are being increasingly integrated into security networks across urban regions and government facilities. Local optics manufacturers are focusing on precision molding and coating technologies to meet demand from consumer electronics and automotive industries. Defense applications such as drones and thermal imaging systems are generating robust opportunities. Growth is further reinforced by rising demand in machine vision solutions for manufacturing quality control. Partnerships with global optics firms are strengthening India’s technological capacity and export competitiveness in the segment.
Germany is anticipated to grow at a CAGR of 7.5% from 2025 to 2035, led by strong adoption in automotive, industrial automation, and healthcare imaging applications. German manufacturers are pioneers in high-precision lens coatings and advanced optical glass, positioning them as premium suppliers in global markets. Increasing demand for IR lenses in driver-assistance systems, robotics, and medical diagnostic tools is fueling consumption. The market benefits from Germany’s strong R&D ecosystem and partnerships with leading universities. Expansion of defense and aerospace applications also contributes to demand for long-wave and short-wave IR corrected lenses. Sustainability requirements in manufacturing processes are driving investment in advanced production lines using recyclable materials.
Brazil is projected to grow at a CAGR of 6.8% through 2035, supported by adoption in security, automotive, and energy sectors. The expansion of smart surveillance projects in urban centers has boosted demand for IR corrected lenses. Local manufacturers are focusing on cost-effective solutions for cameras and monitoring systems, while imports from Asia and Europe meet advanced technology needs. The automotive sector is adopting IR optics in driver-assistance and safety monitoring systems. Renewable energy installations, particularly solar plants, are increasingly deploying IR monitoring devices requiring specialized lenses. Market development is also being driven by government investments in public safety and industrial modernization.
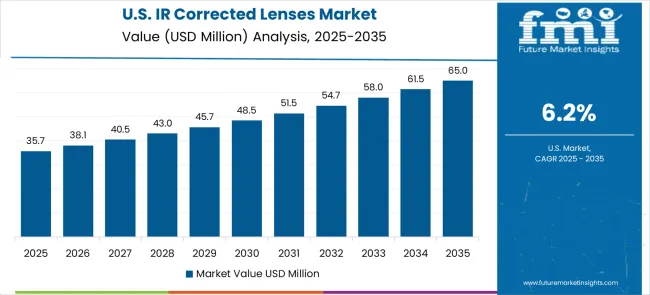
The United States is expected to grow at a CAGR of 6.2% between 2025 and 2035, influenced by adoption in defense, aerospace, medical imaging, and automotive industries. IR corrected lenses are increasingly used in drones, night vision devices, and AI-powered surveillance. Domestic manufacturers are integrating advanced coating technologies and precision engineering to maintain global competitiveness. Healthcare applications such as surgical imaging and diagnostic tools are creating strong opportunities. Automotive adoption is being driven by rapid deployment of ADAS and autonomous systems. Federal defense contracts are further reinforcing demand for high-performance IR optics, with strong focus on long-range imaging and thermal detection.
The United Kingdom is projected to grow at a CAGR of 5.5% during 2025–2035, supported by applications in defense, urban security, and healthcare imaging. IR corrected lenses are being integrated into nationwide surveillance upgrades and critical infrastructure monitoring systems. British optics firms are investing in precision design and coating processes to meet the requirements of medical diagnostics and industrial automation. Defense and aerospace projects remain key contributors, particularly in long-range thermal imaging devices. The healthcare sector is adopting IR optics in minimally invasive surgery and diagnostic imaging. Collaborations with European optics companies are enabling access to advanced raw materials and production expertise.
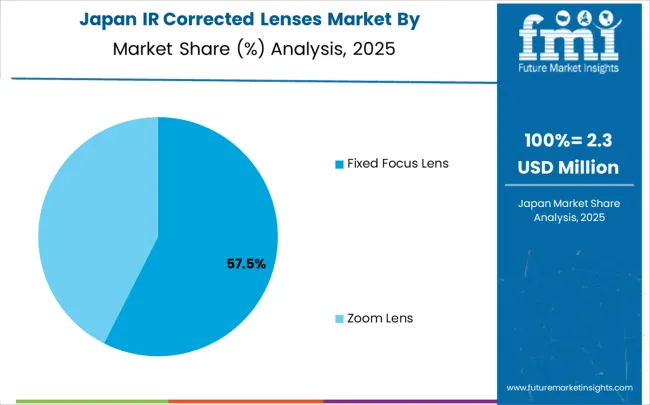
Japan is forecasted to grow at a CAGR of 4.9% through 2035, with demand shaped by robotics, automotive, and medical imaging industries. IR corrected lenses are being integrated into precision robotics for manufacturing and healthcare applications. Automotive manufacturers are expanding adoption in ADAS and autonomous driving systems, leveraging Japan’s strong R&D in optical materials. Medical diagnostics and surgical imaging are also contributing to consumption. Domestic optics firms are focusing on miniaturized and lightweight IR lens designs suited for compact devices. Collaborations with global electronics and defense firms are strengthening innovation pipelines. The market is further supported by investments in semiconductor inspection systems that rely heavily on IR optics.
Revenue from IR corrected lenses in China is projected to exhibit exceptional growth with a CAGR of 8.8% through 2035, driven by expanding security surveillance infrastructure development and rapidly growing smart city initiatives supported by government public safety modernization programs. The country's abundant surveillance system deployment capacity and increasing investment in infrared imaging technology are creating substantial demand for advanced optical solutions. Major security companies and optical equipment manufacturers are establishing comprehensive IR corrected lens capabilities to serve both domestic and international markets.
Government support for smart city development and security infrastructure expansion is driving demand for IR corrected lens technologies throughout major urban regions and surveillance centers. Strong security system sector growth and an expanding network of surveillance facilities are supporting the rapid adoption of infrared optical components among system integrators seeking enhanced surveillance performance and operational effectiveness.
Revenue from IR corrected lenses in India is expanding at a CAGR of 8.1%, supported by the country's growing security infrastructure capacity, emerging surveillance facilities, and increasing domestic demand for advanced optical technologies and monitoring solutions. The country's developing security supply chain and growing surveillance industry are driving demand for sophisticated optical capabilities. International technology providers and domestic manufacturers are establishing extensive production and distribution capabilities to address the growing demand for IR corrected lens products.
Rising security infrastructure development and expanding surveillance deployment patterns are creating opportunities for IR corrected lens adoption across security system integrators, surveillance operators, and optical equipment facilities in major urban areas. Growing government focus on public safety modernization and security technology advancement is driving adoption of advanced optical technologies among security enterprises seeking enhanced monitoring capability and system performance.
Revenue from IR corrected lenses in Germany is expanding at a CAGR of 7.5%, supported by the country's advanced optical industry, strong emphasis on technological innovation, and robust demand for high-performance imaging solutions among quality-focused manufacturers. The nation's mature optical manufacturing sector and high adoption of precision optical technologies are driving sophisticated imaging capabilities throughout the supply chain. Leading manufacturers and technology providers are investing extensively in premium optical development and advanced lens methods to serve both domestic and export markets.
Rising manufacturer preference for high-precision optics and advanced imaging quality is creating demand for sophisticated IR corrected lens systems among optical manufacturers seeking enhanced product performance and imaging optimization. Strong technological expertise and growing emphasis on optical excellence are supporting adoption of premium optical solutions across security surveillance and precision imaging applications in major technology centers.
Revenue from IR corrected lenses in Brazil is growing at a CAGR of 6.8%, driven by expanding security infrastructure development, increasing surveillance system modernization patterns, and growing investment in optical technology adoption. The country's developing security resources and modernization of monitoring facilities are supporting demand for advanced optical technologies across major urban regions. Security system operators and surveillance companies are establishing comprehensive capabilities to serve both domestic security centers and emerging monitoring markets.
Government initiatives promoting public safety development and security infrastructure expansion are driving adoption of modern surveillance systems including IR corrected lenses and advanced imaging methods. Rising demand for security monitoring solutions in urban areas is supporting market expansion, while robust security sector growth provides opportunities for optical component adoption throughout the country's surveillance facilities.
Revenue from IR corrected lenses in the USA is expanding at a CAGR of 6.2%, supported by the country's advanced optical industry, emphasis on high-performance optical supply, and strong demand for sophisticated surveillance solutions among security-focused organizations. The USA's established optical manufacturing sector and security expertise are supporting investment in advanced optical capabilities throughout major security centers. Industry leaders are establishing comprehensive quality management systems to serve both domestic and export markets with premium optical solutions.
Innovations in optical technologies including enhanced IR correction systems and advanced coating methods are creating demand for superior optical performance and advanced surveillance capability among quality-focused manufacturers. Growing technological advancement and rising demand for high-performance security systems are driving adoption of sophisticated IR corrected lenses across surveillance manufacturing and security system applications throughout the country.
Revenue from IR corrected lenses in the UK is growing at a CAGR of 5.5%, driven by the country's optical industry, emphasis on quality optical adoption, and strong demand for high-performance surveillance solutions among established security operators. The UK's mature optical sector and focus on technology excellence are supporting investment in advanced optical capabilities throughout major security centers. Optical companies are establishing comprehensive lens systems to serve both domestic and international markets with quality imaging solutions.
Advanced optical expertise and established surveillance capabilities are creating opportunities for premium optical adoption and enhanced security performance among quality-focused operators throughout major security regions. Growing emphasis on optical innovation and security advancement is driving adoption of IR corrected lens systems across surveillance and precision imaging applications throughout the country.
Revenue from IR corrected lenses in Japan is expanding at a CAGR of 4.9%, supported by the country's focus on precision manufacturing excellence, advanced optical applications, and strong preference for high-quality imaging solutions. Japan's sophisticated optical manufacturing industry and emphasis on lens precision are driving demand for advanced optical technologies including premium IR corrected lenses and high-performance coating methods. Leading manufacturers are investing in specialized capabilities to serve optical component production, imaging system manufacturing, and precision lens applications with premium optical offerings.
Regional specialization in precision manufacturing and advanced technology development is creating opportunities for premium optical positioning and distinctive product development throughout major manufacturing regions. Strong emphasis on manufacturing quality combined with advanced optical requirements is driving adoption of optical technologies that deliver exceptional image quality while meeting contemporary surveillance and imaging performance needs.
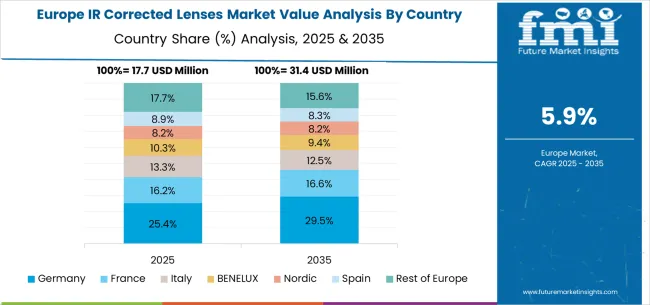
The IR corrected lenses market in Europe is projected to grow from USD 16.2 million in 2025 to USD 30.3 million by 2035, registering a CAGR of 6.5% over the forecast period. Germany is expected to maintain its leadership position with a 24.0% market share in 2025, declining slightly to 23.5% by 2035, supported by its strong optical manufacturing industry, advanced imaging facilities, and comprehensive surveillance system supply network serving major European markets.
France follows with an 18.5% share in 2025, projected to reach 18.8% by 2035, driven by robust demand for IR corrected lenses in security applications, automotive systems, and optical equipment manufacturing, combined with established technology traditions incorporating advanced optical components. The United Kingdom holds a 16.0% share in 2025, expected to decrease to 15.7% by 2035, supported by strong optical sector demand but facing challenges from competitive pressures and market restructuring. Italy commands a 14.0% share in 2025, projected to reach 14.2% by 2035, while Spain accounts for 12.5% in 2025, expected to reach 12.8% by 2035. The Netherlands maintains a 4.5% share in 2025, growing to 4.7% by 2035. The Rest of Europe region, including Nordic countries, Eastern Europe, Portugal, Belgium, Switzerland, and Austria, is anticipated to gain momentum, expanding its collective share from 10.5% to 10.3% by 2035, attributed to increasing adoption of advanced surveillance systems in Nordic countries and growing optical manufacturing activities across Eastern European markets implementing security modernization programs.
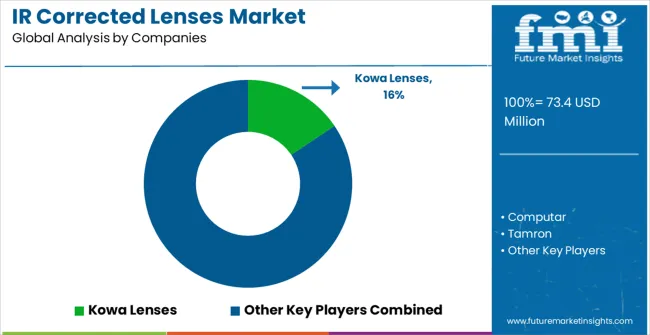
The market is highly competitive, driven by optical precision, infrared transmission efficiency, and application-specific customization. Kowa Lenses, Fujinon, and Schneider lead with high-performance lenses designed for industrial, scientific, and surveillance applications, focusing low distortion, wide spectral transmission, and superior thermal stability. Their competitive advantage comes from decades of optical engineering expertise, global distribution networks, and extensive product testing. Brochures highlight focal length options, IR correction range, and environmental durability, appealing to clients in imaging, machine vision, and security sectors.
Computar, Tamron, Edmund Optics, and VS Technology compete by offering versatile, mid-tier IR-corrected lenses suitable for both industrial and laboratory applications. Computar and Tamron emphasize precision assembly and anti-reflective coatings, while Edmund Optics focuses on modularity and compatibility with multiple imaging systems. VS Technology differentiates through cost-effective designs with fast delivery and customizable specifications for OEM clients.
Ricoh, Myutron Inc., Kenko Tokina, OPT, Theia Technologies, and FOCtek Photonics target niche applications such as thermal imaging, scientific research, and defense optics. These firms highlight low chromatic aberration, enhanced IR sensitivity, and ruggedized construction in their product brochures. Competition is defined by optical accuracy, IR correction range, and mechanical reliability. Leading players invest in advanced glass materials, multi-coating technologies, and precision assembly, while smaller and regional players leverage niche focus, affordability, and rapid customization. The market landscape remains technology-driven, with product innovation and application-specific performance central to maintaining a competitive edge.The IR corrected lenses market is characterized by competition among established optical manufacturers, specialized imaging component suppliers, and integrated surveillance system providers. Companies are investing in advanced optical technology research, infrared correction optimization, coating technology development, and comprehensive product portfolios to deliver consistent, high-quality, and cost-effective IR corrected lens solutions. Innovation in optical formulations, multi-spectral performance, and precision manufacturing is central to strengthening market position and competitive advantage.
Kowa Lenses leads the market with a strong market share, offering comprehensive optical solutions with a focus on security and industrial applications and advanced IR correction systems. Computar provides specialized optical capabilities with an emphasis on surveillance applications and imaging excellence. Tamron delivers innovative optical solutions with a focus on automotive and industrial markets and product versatility. Edmund Optics specializes in optical manufacturing and advanced lens solutions for scientific and industrial markets. VS Technology focuses on optical technology and integrated lens operations. Ricoh offers specialized optical components with emphasis on precision applications and technical markets.
| Items | Values |
|---|---|
| Quantitative Units (2025) | USD 73.4 mMillion |
| Classification | Fixed Focus Lens, Zoom Lens |
| Application | Security Monitoring, Industrial Visual Inspection, Automotive Night Vision System, Traffic Monitoring, Other |
| Regions Covered | North America, Europe, East Asia, South Asia & Pacific, Latin America, Middle East & Africa |
| Countries Covered | United States, Canada, United Kingdom, Germany, France, China, Japan, South Korea, India, Brazil, Australia and 40+ countries |
| Key Companies Profiled | Kowa Lenses, Computar, Tamron, Edmund Optics, VS Technology, and Ricoh, Myutron Inc., Kenko Tokina Co., Ltd., Schneider OPT, Fujinon, Theia Technologies, FOCtek Photonics Inc. |
| Additional Attributes | Dollar sales by classification and application category, regional demand trends, competitive landscape, technological advancements in optical systems, IR correction innovation, coating development, and manufacturing optimization |
The global IR corrected lenses market is estimated to be valued at USD 73.4 million in 2025.
The market size for the IR corrected lenses market is projected to reach USD 137.8 million by 2035.
The IR corrected lenses market is expected to grow at a 6.5% CAGR between 2025 and 2035.
The key product types in IR corrected lenses market are fixed focus lens and zoom lens.
In terms of application, security monitoring segment to command 45.0% share in the IR corrected lenses market in 2025.


Our Research Products

The "Full Research Suite" delivers actionable market intel, deep dives on markets or technologies, so clients act faster, cut risk, and unlock growth.

The Leaderboard benchmarks and ranks top vendors, classifying them as Established Leaders, Leading Challengers, or Disruptors & Challengers.

Locates where complements amplify value and substitutes erode it, forecasting net impact by horizon

We deliver granular, decision-grade intel: market sizing, 5-year forecasts, pricing, adoption, usage, revenue, and operational KPIs—plus competitor tracking, regulation, and value chains—across 60 countries broadly.

Spot the shifts before they hit your P&L. We track inflection points, adoption curves, pricing moves, and ecosystem plays to show where demand is heading, why it is changing, and what to do next across high-growth markets and disruptive tech

Real-time reads of user behavior. We track shifting priorities, perceptions of today’s and next-gen services, and provider experience, then pace how fast tech moves from trial to adoption, blending buyer, consumer, and channel inputs with social signals (#WhySwitch, #UX).

Partner with our analyst team to build a custom report designed around your business priorities. From analysing market trends to assessing competitors or crafting bespoke datasets, we tailor insights to your needs.
Supplier Intelligence
Discovery & Profiling
Capacity & Footprint
Performance & Risk
Compliance & Governance
Commercial Readiness
Who Supplies Whom
Scorecards & Shortlists
Playbooks & Docs
Category Intelligence
Definition & Scope
Demand & Use Cases
Cost Drivers
Market Structure
Supply Chain Map
Trade & Policy
Operating Norms
Deliverables
Buyer Intelligence
Account Basics
Spend & Scope
Procurement Model
Vendor Requirements
Terms & Policies
Entry Strategy
Pain Points & Triggers
Outputs
Pricing Analysis
Benchmarks
Trends
Should-Cost
Indexation
Landed Cost
Commercial Terms
Deliverables
Brand Analysis
Positioning & Value Prop
Share & Presence
Customer Evidence
Go-to-Market
Digital & Reputation
Compliance & Trust
KPIs & Gaps
Outputs
Full Research Suite comprises of:
Market outlook & trends analysis
Interviews & case studies
Strategic recommendations
Vendor profiles & capabilities analysis
5-year forecasts
8 regions and 60+ country-level data splits
Market segment data splits
12 months of continuous data updates
DELIVERED AS:
PDF EXCEL ONLINE
Iron and Steel Counterweight Market Size and Share Forecast Outlook 2025 to 2035
Iris Recognition Market Size and Share Forecast Outlook 2025 to 2035
Irrigation Syringe Market Size and Share Forecast Outlook 2025 to 2035
Iron and Steel Casting Market Size and Share Forecast Outlook 2025 to 2035
Iridium Spark Plug Market Size and Share Forecast Outlook 2025 to 2035
Iron Phosphate Market Size and Share Forecast Outlook 2025 to 2035
Ironing Table Market Size and Share Forecast Outlook 2025 to 2035
Iron Powder Market - Trends & Forecast 2025 to 2035
Iron Oxide Market Report - Growth, Demand & Forecast 2025 to 2035
IR Spectroscopy Market Analysis - Growth & Forecast 2025 to 2035
IR Emitters and Receivers Market Analysis by Type, End-use, and Region Through 2035
Iron Ore Pellets Market Growth - Trends & Forecast 2025 to 2035
Irradiation Apparatus Market Trends – Growth & Industry Outlook 2024-2034
Irrigation testing kit Market
Irrigation Liners Market
Fire Resistant Apron Market Size and Share Forecast Outlook 2025 to 2035
Air Fryer Paper Liners Market Size and Share Forecast Outlook 2025 to 2035
Direct Liquid Cooling IGBT Module Market Size and Share Forecast Outlook 2025 to 2035
Virtual Land NFT Market Size and Share Forecast Outlook 2025 to 2035
Air Struts Market Size and Share Forecast Outlook 2025 to 2035

Thank you!
You will receive an email from our Business Development Manager. Please be sure to check your SPAM/JUNK folder too.
Chat With
MaRIA