Direct Liquid Cooling IGBT Module Market Forecast and Outlook 2025 to 2035

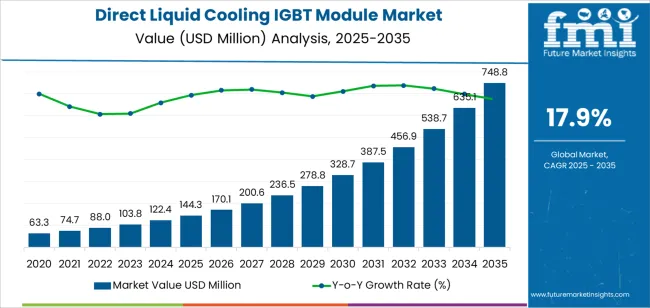
The direct liquid cooling IGBT module market is valued at USD 144.3 million in 2025 and is expected to reach USD 748.8 million by 2035, advancing at a CAGR of 17.9%. Market growth is driven by the increasing demand for high-efficiency power electronics in electric vehicles, renewable energy systems, and industrial automation. The adoption of liquid-cooled designs addresses the limitations of conventional air-cooled modules by improving thermal management, reliability, and power density under high-load conditions. Expanding applications in traction inverters, wind turbines, and high-performance drives continue to reinforce market momentum.

Modules in the 600V to 1200V range represent the leading segment due to their suitability for electric vehicle powertrains, motor drives, and grid-connected converters. Direct liquid cooling enhances heat dissipation through integrated channels or cold plates, reducing thermal resistance and extending component lifespan. Manufacturers are integrating advanced materials, such as copper baseplates and sintered interfaces, to optimize thermal conductivity and system efficiency.
Quick Stats for Direct Liquid Cooling IGBT Module Market

  • Direct Liquid Cooling IGBT Module Market Value (2025): USD 144.3 million
  • Direct Liquid Cooling IGBT Module Market Forecast Value (2035): USD 748.8 million
  • Direct Liquid Cooling IGBT Module Market Forecast CAGR: 17.9%
  • Leading Type in Direct Liquid Cooling IGBT Module Market: 600V to 1200V
  • Key Growth Regions in Direct Liquid Cooling IGBT Module Market: Asia Pacific, Europe, and North America
  • Top Players in Direct Liquid Cooling IGBT Module Market: Infineon, Mitsubishi Electric (Vincotech), Fuji Electric, Hitachi Power Semiconductor Device, Bosch, Onsemi, Toshiba, Microchip, STMicroelectronics, BYD, Denso, SanRex Corporation

Direct Liquid Cooling Igbt Module Market Market Value Analysis

Asia Pacific dominates global market growth, supported by electric vehicle manufacturing and renewable energy deployment in China, Japan, and South Korea. Europe and North America maintain strong demand through industrial electrification and adoption of energy-efficient power conversion systems. Key players include Infineon, Mitsubishi Electric (Vincotech), Fuji Electric, Hitachi Power Semiconductor Device, and Bosch, focusing on thermal design innovation, compact module architecture, and high-reliability power integration.

What is the Growth Forecast for the Direct Liquid Cooling IGBT Module Market through 2035?

Year-on-year (YoY) growth analysis indicates a strong upward trajectory supported by rising demand for high-efficiency power electronics in electric vehicles, renewable energy systems, and industrial automation. From 2025 to 2028, annual growth is expected to remain above 16% as liquid cooling technology gains adoption over traditional air-cooled systems due to superior thermal management and reliability advantages.

Between 2029 and 2032, YoY growth may briefly stabilize around 17% as production capacity expands and large-scale integration in electric mobility and wind power inverters reaches maturity. The later phase, from 2033 to 2035, will likely record renewed acceleration as next-generation IGBT modules designed for higher power density and compactness enter commercial use. Regional growth will be strongest in Asia-Pacific, driven by manufacturing expansion and EV infrastructure development. The YoY trend demonstrates consistent double-digit gains across the decade, underpinned by continuous technological improvements, demand for energy-efficient systems, and the scaling of advanced liquid-cooled power modules across high-performance applications.

Direct Liquid Cooling IGBT Module Market Key Takeaways

Metric Value
Market Value (2025) USD 144.3 million
Market Forecast Value (2035) USD 748.8 million
Forecast CAGR (2025-2035) 17.9%

Why is the Direct Liquid Cooling IGBT Module Market Growing?

The direct liquid cooling IGBT module market is growing as power electronics systems demand more efficient thermal management solutions for high-performance applications. Liquid cooling improves heat dissipation, enabling higher power density, longer device lifespan, and greater operational reliability. Industries such as electric vehicles, renewable energy, and industrial automation increasingly adopt liquid-cooled insulated gate bipolar transistor modules to support compact and efficient inverter and converter designs. Rising power conversion requirements in electric mobility, rail transport, and wind energy systems are strengthening adoption due to superior thermal control compared to air-cooled alternatives.

Technological advances in micro-channel structures, cold plate designs, and dielectric coolants enhance cooling efficiency and reduce thermal stress on semiconductor components. The transition toward high-voltage and high-frequency systems supports the use of liquid cooling for stable and continuous performance under heavy electrical loads. Constraints include high initial cost, complex system integration, and maintenance challenges associated with liquid-based systems, which limit adoption in smaller installations and cost-sensitive industries.

Which Classification and Application Segments Lead the Direct Liquid Cooling IGBT Module Market?

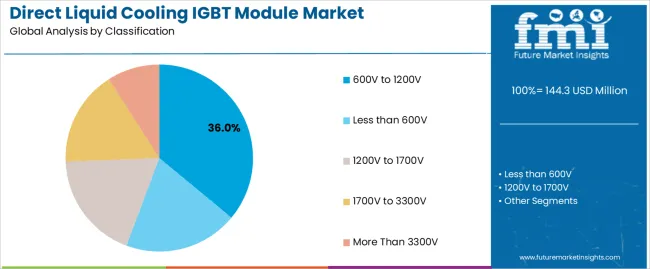
The direct liquid cooling IGBT module market is segmented by classification and application. By classification, the market is divided into less than 600V, 600V to 1200V, 1200V to 1700V, 1700V to 3300V, and more than 3300V modules. Based on application, it is categorized into automotive and EV/HEV, industrial control, consumer appliances, and others. Regionally, the market is divided into Asia Pacific, Europe, North America, and other key regions.
By Classification, the 600V to 1200V Segment Accounts for the Largest Market Share

Direct Liquid Cooling Igbt Module Market Analysis By Classification

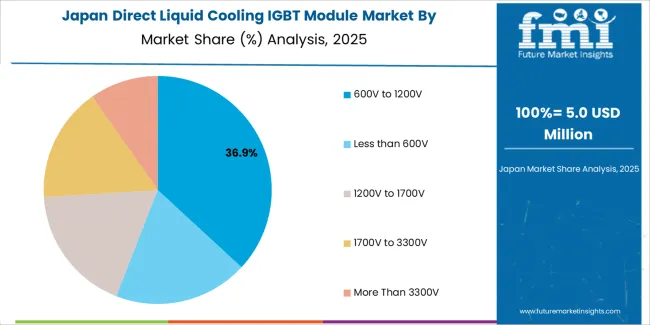
The 600V to 1200V segment holds the leading position in the direct liquid cooling IGBT module market, accounting for an estimated 36.0% of total market share in 2025. Modules in this voltage range are widely implemented across automotive, renewable energy, and industrial systems due to their balance between voltage handling capacity, efficiency, and cost. These modules deliver optimized switching performance and thermal control, making them suitable for electric traction inverters, motor drives, and power conversion units.

Their dominance is reinforced by the ongoing electrification of transportation and industrial automation expansion. Direct liquid cooling supports higher current density and prolonged operational reliability under elevated thermal loads, a critical requirement in compact, high-performance systems. Lower voltage modules (below 600V) are mainly applied in consumer and small-scale industrial electronics, while higher-voltage modules (above 1200V) are utilized in power grid, rail traction, and wind turbine systems.

Key factors supporting the 600V to 1200V segment include:
  • Broad adoption across electric mobility, industrial drives, and renewable applications.
  • Effective heat dissipation ensuring stable performance under high switching frequencies.
  • Compatibility with compact designs for automotive power systems and converters.
  • Rising production of EV traction inverters and industrial motor control systems.

By Application, the Automotive and EV/HEV Segment Represents the Dominant Market Category

Direct Liquid Cooling Igbt Module Market Analysis By Application

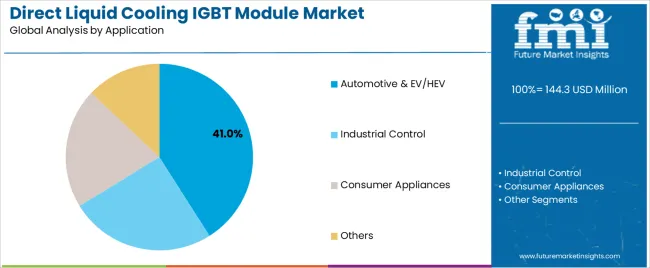
The automotive and EV/HEV segment represents the largest share of the direct liquid cooling IGBT module market, holding an estimated 41.0% of the total market in 2025. This dominance is driven by rapid electrification of passenger and commercial vehicles, necessitating efficient thermal management of power electronics components. Direct liquid cooling enables higher performance in vehicle traction inverters, onboard chargers, and DC–DC converters by maintaining optimal operating temperatures during peak load conditions.

The segment’s growth is supported by global initiatives toward decarbonization, expansion of EV infrastructure, and increasing investment in high-efficiency powertrain components. The industrial control segment follows, accounting for approximately 33.0% of the market, supported by applications in motor drives, automation equipment, and renewable energy systems. The consumer appliances and others segments collectively represent the remaining market share, focused on compact, high-efficiency systems in specialized and household applications.

Primary dynamics driving demand from the automotive and EV/HEV segment include:

  • Increasing adoption of liquid-cooled power modules in electric and hybrid vehicles.
  • Rising vehicle electrification targets driving advanced thermal management development.
  • Integration of compact, high-power IGBT modules into traction systems and converters.
  • Expansion of EV manufacturing and battery electric platforms requiring efficient energy control.

What are the Drivers, Restraints, and Key Trends of the Direct Liquid Cooling IGBT Module Market?

Rising demand for high-power density electronics, increasing EV and renewable energy adoption, and superior thermal performance requirements.

The market is driven by continuous growth in applications that require high-end power switching with minimal losses. Electric vehicles and renewable energy systems use IGBT modules at high voltages and currents, creating strong demand for cooling solutions that maintain reliability. Direct liquid cooling enables reduced thermal resistance and enhanced heat dissipation compared to traditional cooling, thereby supporting higher switching frequency and performance. The shift toward more compact and efficient power electronics further accelerates adoption of modules that incorporate advanced cooling technologies.

Higher manufacturing and maintenance complexity, strict fluid compatibility requirements, and limited standardisation across industries.

Direct liquid‐cooled IGBT modules tend to be more complex to design and produce than air-cooled or simpler alternatives, which raises cost barriers. The need for precision in coolant flow, sealing, and materials to avoid corrosion or contamination increases engineering and servicing demands. Some sectors or legacy systems may lack compatibility or standards for integrating liquid-cooling systems, reducing willingness to transition. Operational and cooling infrastructure costs can hinder uptake in regions with limited technical support or investment capacity.

Modular and scalable cooling integration, expansion into diverse industrial sectors, and evolution toward higher-voltage classes.

Manufacturers are offering more modular designs allowing scalable cooling solutions tailored to application needs. Adoption is spreading beyond automotive and renewables into sectors such as industrial motor drives and power conversion equipment. There is an increasing shift to higher-voltage IGBT classes, which necessitates more advanced cooling, promoting innovation in module and coolant interface designs. Developments in micro-channel fin structures and direct-immersion cooling are enhancing thermal efficiency and enabling future-proof module architectures.

Analysis of the Direct Liquid Cooling IGBT Module Market by Key Country

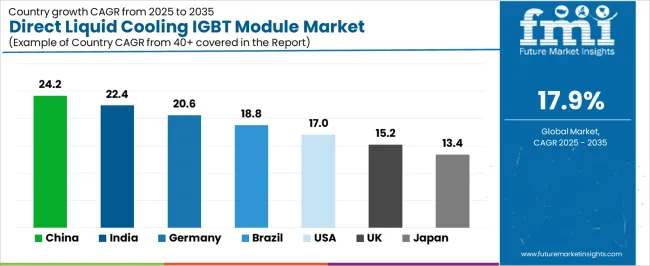
The global direct liquid cooling IGBT (Insulated Gate Bipolar Transistor) module market is growing rapidly through 2035, driven by increased adoption of high-power electronics in electric vehicles (EVs), renewable energy systems, and industrial automation. China leads with a 24.2% CAGR, followed by India at 22.4%, reflecting large-scale electrification and semiconductor manufacturing growth. Germany records 20.6%, supported by engineering innovation and EV supply chain expansion. Brazil grows at 18.8%, aided by renewable power generation and manufacturing development. The United States posts 17.0%, driven by defense and clean energy applications, while the United Kingdom (15.2%) and Japan (13.4%) maintain steady growth through precision power electronics and R&D-led system optimization.
Direct Liquid Cooling Igbt Module Market Cagr Analysis By Country

Country CAGR (%)
China 24.2
India 22.4
Germany 20.6
Brazil 18.8
USA 17.0
UK 15.2
Japan 13.4

How is China leading the Direct Liquid Cooling IGBT Module Market?

China’s market grows at 24.2% CAGR, supported by its dominance in EV manufacturing, industrial power electronics, and renewable energy integration. Domestic semiconductor firms are scaling up production of high-density IGBT modules equipped with direct liquid cooling for superior heat dissipation. The government’s Made in China 2025 policy promotes local production of advanced power components and cooling solutions. Collaborations between automotive OEMs and electronics manufacturers enhance module reliability for EV traction inverters. China’s expanding solar and wind power infrastructure increases the adoption of high-efficiency liquid-cooled IGBT systems in converters and inverters.

Key Market Factors:

  • Expansion of EV and renewable energy power electronics manufacturing
  • Integration of liquid-cooled IGBT modules in automotive traction systems
  • Policy support under Made in China 2025 for semiconductor self-reliance
  • Collaboration between automotive and electronics sectors for thermal optimization

How is India advancing the Direct Liquid Cooling IGBT Module Market?

India’s market grows at 22.4% CAGR, driven by industrial electrification, electric mobility, and domestic semiconductor ecosystem development. The National Electric Mobility Mission Plan and Production Linked Incentive (PLI) scheme are promoting localized manufacturing of power modules. Indian firms are adopting liquid cooling designs to enhance heat transfer efficiency in electric drivetrain applications. Research collaborations with global semiconductor companies are advancing high-voltage module design and cooling system integration. Growing demand from railways, renewable energy plants, and industrial automation further accelerates deployment. The market benefits from government initiatives supporting clean energy and self-reliant manufacturing ecosystems.

Market Development Factors:
  • Expansion of EV, solar, and industrial inverter manufacturing capacity
  • Government incentives under PLI and National Electric Mobility Mission
  • Collaboration with global firms for module design and cooling integration
  • Adoption of liquid-cooled IGBT systems in transport and renewable sectors

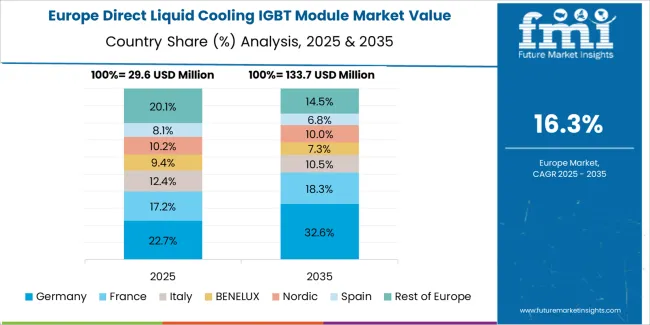
How is Germany enhancing the Direct Liquid Cooling IGBT Module Market?

Direct Liquid Cooling Igbt Module Market Europe Country Market Share Analysis, 2025 & 2035

Germany’s market grows at 20.6% CAGR, supported by precision engineering, EV innovation, and industrial efficiency programs. German power electronics manufacturers are producing high-performance IGBT modules with advanced thermal interface materials and liquid cooling plates. The country’s strong automotive and renewable energy industries drive large-scale adoption of power modules for e-mobility and grid systems. Research under Industrie 4.0 and Energiewende initiatives supports integration of thermal management systems with real-time digital monitoring. Manufacturers are also focusing on SiC (silicon carbide)-based IGBT technology for enhanced power density and reliability.

Key Market Characteristics:

  • Integration of liquid cooling in high-efficiency EV and renewable power modules
  • Research under Industrie 4.0 improving digital and thermal management systems
  • Innovation in SiC-based IGBT and hybrid power electronics
  • Expansion of automotive and grid-level inverter manufacturing

How is Brazil developing its Direct Liquid Cooling IGBT Module Market?

Brazil’s market grows at 18.8% CAGR, supported by renewable energy expansion, smart grid projects, and manufacturing investment. Local firms are adopting liquid-cooled IGBT modules for wind and solar inverters to improve energy conversion efficiency in tropical environments. The National Energy Expansion Plan promotes adoption of high-efficiency power electronics across distributed generation systems. Collaborations with global manufacturers are facilitating technology transfer in power module design and thermal management. Industrial automation and electrified transport networks are additional drivers of market expansion.

Market Development Factors:
  • Integration of IGBT modules in renewable and distributed energy systems
  • Government support under the National Energy Expansion Plan
  • Collaboration with global firms for high-performance module design
  • Adoption of liquid cooling to enhance reliability in high-temperature regions

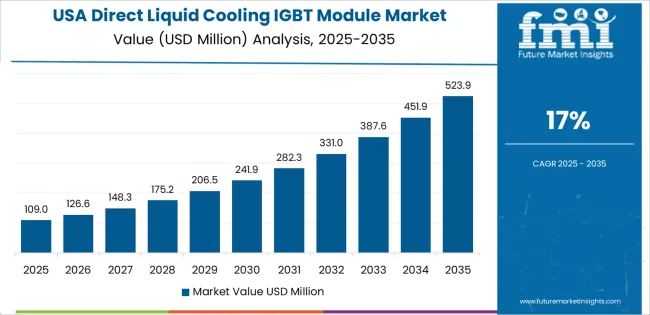
How is the United States progressing in the Direct Liquid Cooling IGBT Module Market?

Direct Liquid Cooling Igbt Module Market Country Value Analysis

The United States grows at 17.0% CAGR, supported by innovation in EV platforms, defense-grade electronics, and grid modernization. Manufacturers are investing in advanced packaging designs and liquid cooling structures for thermal stability in high-current environments. The Department of Energy (DOE) supports R&D in power semiconductors under the Advanced Manufacturing Office and Clean Energy Initiative. Growing demand from aerospace, defense, and industrial automation drives high-reliability module deployment. Integration of AI-based temperature monitoring and predictive maintenance systems strengthens performance across large-scale installations.

Key Market Factors:

  • Advanced R&D in power module packaging and cooling optimization
  • Government investment in semiconductor and energy innovation programs
  • High adoption across defense, EV, and grid modernization applications
  • Integration of AI-enabled predictive maintenance in thermal management

How is the United Kingdom developing its Direct Liquid Cooling IGBT Module Market?

The United Kingdom’s market grows at 15.2% CAGR, driven by power electronics innovation, EV infrastructure development, and renewable integration. Domestic companies are developing liquid-cooled IGBT modules optimized for electric drivetrains, aerospace systems, and power conversion equipment. R&D under Innovate UK and Faraday Battery Challenge supports energy-efficient and thermally stable electronic systems. Partnerships between universities and industry enhance module design and fluid dynamics analysis. Adoption in offshore wind projects and grid storage converters also supports steady demand.

Market Development Factors:
  • Development of EV-focused liquid-cooled power modules under national R&D programs
  • Collaboration between universities and power electronics manufacturers
  • Integration of IGBT systems in renewable and energy storage applications
  • Focus on advanced cooling technologies for high-efficiency system design

How is Japan sustaining its Direct Liquid Cooling IGBT Module Market?

Direct Liquid Cooling Igbt Module Market Japan Market Share Analysis By Classification

Japan’s market grows at 13.4% CAGR, reflecting strong R&D in power electronics and energy system reliability. Domestic firms are manufacturing high-efficiency IGBT modules with direct liquid cooling for EV, rail, and industrial automation applications. The Green Innovation Fund supports development of compact, energy-efficient semiconductor systems with advanced cooling channels. Research in SiC and GaN materials is improving thermal conductivity and switching performance. The country’s focus on reliability and miniaturization sustains continuous product improvement and export potential.

Key Market Characteristics:
  • Development of compact, high-efficiency IGBT modules for EV and rail applications
  • R&D in SiC and GaN materials for thermal and switching performance improvement
  • Innovation supported under the Green Innovation Fund
  • Strong focus on reliability, miniaturization, and long product lifespan

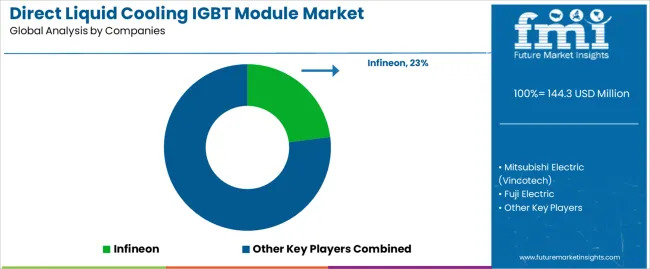
What is the competitive landscape of the Direct Liquid Cooling IGBT Module Market?

Direct Liquid Cooling Igbt Module Market Analysis By Company

The direct liquid cooling IGBT module market is moderately concentrated, with around a dozen semiconductor and power electronics manufacturers competing in high-efficiency thermal management applications. Infineon leads the market with an estimated 23.0% global share, supported by its advanced IGBT module portfolio, proprietary cooling interface technology, and strong partnerships across electric vehicle, renewable energy, and industrial automation sectors. Its dominance is reinforced by proven reliability, scalable production, and integration of liquid-cooled systems into high-power density architectures.

Mitsubishi Electric (Vincotech), Fuji Electric, and Hitachi Power Semiconductor Device follow as key competitors, focusing on high-voltage, low-loss IGBT modules with optimized thermal resistance and compact form factors. Their competitive strengths include vertically integrated manufacturing, automotive-grade qualification, and continuous improvement in silicon and packaging materials. Bosch, Onsemi, and Toshiba contribute through hybrid power solutions and thermal management innovations tailored for traction inverters and grid converters.

Microchip, STMicroelectronics, and Denso maintain strong R&D programs targeting liquid-cooled power modules designed for electrified transportation and energy storage applications. BYD and SanRex Corporation compete regionally with in-house module production and system-level expertise in vehicle and industrial power systems. Competition in this market is defined by thermal efficiency, reliability under high current density, and integration capability. Growth is driven by the global shift toward electrification and renewable power infrastructure, where liquid-cooled IGBT modules enable superior thermal management, reduced footprint, and longer service life in demanding high-power environments.

Key Players in the Direct Liquid Cooling IGBT Module Market

  • Infineon
  • Mitsubishi Electric (Vincotech)
  • Fuji Electric
  • Hitachi Power Semiconductor Device
  • Bosch
  • Onsemi
  • Toshiba
  • Microchip
  • STMicroelectronics
  • BYD
  • Denso
  • SanRex Corporation

Scope of the Report

Items Values
Quantitative Units USD million
Classification Less than 600V, 600V to 1200V, 1200V to 1700V, 1700V to 3300V, More Than 3300V
Application Automotive & EV/HEV, Industrial Control, Consumer Appliances, Others
Regions Covered Asia Pacific, Europe, North America, Latin America, Middle East & Africa
Countries Covered India, China, USA, Germany, South Korea, Japan, Italy, and 40+ countries
Key Companies Profiled Infineon, Mitsubishi Electric (Vincotech), Fuji Electric, Hitachi Power Semiconductor Device, Bosch, Onsemi, Toshiba, Microchip, STMicroelectronics, BYD, Denso, SanRex Corporation
Additional Attributes Dollar sales by classification and application categories; regional adoption trends across Asia Pacific, Europe, and North America; competitive landscape of IGBT module and semiconductor power device manufacturers; advancements in direct liquid cooling and high-voltage module efficiency; integration with electric vehicles, industrial automation, and renewable energy systems.

Direct Liquid Cooling IGBT Module Market by Segment

Classification:

  • Less than 600V
  • 600V to 1200V
  • 1200V to 1700V
  • 1700V to 3300V
  • More Than 3300V

Application:

  • Automotive & EV/HEV
  • Industrial Control
  • Consumer Appliances
  • Others

Region:

  • Asia Pacific
    • China
    • Japan
    • South Korea
    • India
    • Australia & New Zealand
    • ASEAN
    • Rest of Asia Pacific
  • Europe
    • Germany
    • United Kingdom
    • France
    • Italy
    • Spain
    • Nordic
    • BENELUX
    • Rest of Europe
  • North America
    • United States
    • Canada
    • Mexico
  • Latin America
    • Brazil
    • Chile
    • Rest of Latin America
  • Middle East & Africa
    • Kingdom of Saudi Arabia
    • Other GCC Countries
    • Turkey
    • South Africa
    • Other African Union
    • Rest of Middle East & Africa

Frequently Asked Questions

How big is the direct liquid cooling IGBT module market in 2025?

The global direct liquid cooling IGBT module market is estimated to be valued at USD 144.3 million in 2025.

What will be the size of direct liquid cooling IGBT module market in 2035?

The market size for the direct liquid cooling IGBT module market is projected to reach USD 748.8 million by 2035.

How much will be the direct liquid cooling IGBT module market growth between 2025 and 2035?

The direct liquid cooling IGBT module market is expected to grow at a 17.9% CAGR between 2025 and 2035.

What are the key product types in the direct liquid cooling IGBT module market?

The key product types in direct liquid cooling IGBT module market are 600v to 1200v, less than 600v, 1200v to 1700v, 1700v to 3300v and more than 3300v.

Which application segment to contribute significant share in the direct liquid cooling IGBT module market in 2025?

In terms of application, automotive & ev/hev segment to command 41.0% share in the direct liquid cooling IGBT module market in 2025.

Table of Content

  1. Executive Summary
    • Global Market Outlook
    • Demand to side Trends
    • Supply to side Trends
    • Technology Roadmap Analysis
    • Analysis and Recommendations
  2. Market Overview
    • Market Coverage / Taxonomy
    • Market Definition / Scope / Limitations
  3. Market Background
    • Market Dynamics
      • Drivers
      • Restraints
      • Opportunity
      • Trends
    • Scenario Forecast
      • Demand in Optimistic Scenario
      • Demand in Likely Scenario
      • Demand in Conservative Scenario
    • Opportunity Map Analysis
    • Product Life Cycle Analysis
    • Supply Chain Analysis
    • Investment Feasibility Matrix
    • Value Chain Analysis
    • PESTLE and Porter’s Analysis
    • Regulatory Landscape
    • Regional Parent Market Outlook
    • Production and Consumption Statistics
    • Import and Export Statistics
  4. Global Market Analysis 2020 to 2024 and Forecast, 2025 to 2035
    • Historical Market Size Value (USD Million) Analysis, 2020 to 2024
    • Current and Future Market Size Value (USD Million) Projections, 2025 to 2035
      • Y to o to Y Growth Trend Analysis
      • Absolute $ Opportunity Analysis
  5. Global Market Pricing Analysis 2020 to 2024 and Forecast 2025 to 2035
  6. Global Market Analysis 2020 to 2024 and Forecast 2025 to 2035, By Classification
    • Introduction / Key Findings
    • Historical Market Size Value (USD Million) Analysis By Classification , 2020 to 2024
    • Current and Future Market Size Value (USD Million) Analysis and Forecast By Classification , 2025 to 2035
      • 600V to 1200V
      • Less than 600V
      • 1200V to 1700V
      • 1700V to 3300V
      • More Than 3300V
    • Y to o to Y Growth Trend Analysis By Classification , 2020 to 2024
    • Absolute $ Opportunity Analysis By Classification , 2025 to 2035
  7. Global Market Analysis 2020 to 2024 and Forecast 2025 to 2035, By Application
    • Introduction / Key Findings
    • Historical Market Size Value (USD Million) Analysis By Application, 2020 to 2024
    • Current and Future Market Size Value (USD Million) Analysis and Forecast By Application, 2025 to 2035
      • Automotive & EV/HEV
      • Industrial Control
      • Consumer Appliances
      • Others
    • Y to o to Y Growth Trend Analysis By Application, 2020 to 2024
    • Absolute $ Opportunity Analysis By Application, 2025 to 2035
  8. Global Market Analysis 2020 to 2024 and Forecast 2025 to 2035, By Region
    • Introduction
    • Historical Market Size Value (USD Million) Analysis By Region, 2020 to 2024
    • Current Market Size Value (USD Million) Analysis and Forecast By Region, 2025 to 2035
      • North America
      • Latin America
      • Western Europe
      • Eastern Europe
      • East Asia
      • South Asia and Pacific
      • Middle East & Africa
    • Market Attractiveness Analysis By Region
  9. North America Market Analysis 2020 to 2024 and Forecast 2025 to 2035, By Country
    • Historical Market Size Value (USD Million) Trend Analysis By Market Taxonomy, 2020 to 2024
    • Market Size Value (USD Million) Forecast By Market Taxonomy, 2025 to 2035
      • By Country
        • USA
        • Canada
        • Mexico
      • By Classification
      • By Application
    • Market Attractiveness Analysis
      • By Country
      • By Classification
      • By Application
    • Key Takeaways
  10. Latin America Market Analysis 2020 to 2024 and Forecast 2025 to 2035, By Country
    • Historical Market Size Value (USD Million) Trend Analysis By Market Taxonomy, 2020 to 2024
    • Market Size Value (USD Million) Forecast By Market Taxonomy, 2025 to 2035
      • By Country
        • Brazil
        • Chile
        • Rest of Latin America
      • By Classification
      • By Application
    • Market Attractiveness Analysis
      • By Country
      • By Classification
      • By Application
    • Key Takeaways
  11. Western Europe Market Analysis 2020 to 2024 and Forecast 2025 to 2035, By Country
    • Historical Market Size Value (USD Million) Trend Analysis By Market Taxonomy, 2020 to 2024
    • Market Size Value (USD Million) Forecast By Market Taxonomy, 2025 to 2035
      • By Country
        • Germany
        • UK
        • Italy
        • Spain
        • France
        • Nordic
        • BENELUX
        • Rest of Western Europe
      • By Classification
      • By Application
    • Market Attractiveness Analysis
      • By Country
      • By Classification
      • By Application
    • Key Takeaways
  12. Eastern Europe Market Analysis 2020 to 2024 and Forecast 2025 to 2035, By Country
    • Historical Market Size Value (USD Million) Trend Analysis By Market Taxonomy, 2020 to 2024
    • Market Size Value (USD Million) Forecast By Market Taxonomy, 2025 to 2035
      • By Country
        • Russia
        • Poland
        • Hungary
        • Balkan & Baltic
        • Rest of Eastern Europe
      • By Classification
      • By Application
    • Market Attractiveness Analysis
      • By Country
      • By Classification
      • By Application
    • Key Takeaways
  13. East Asia Market Analysis 2020 to 2024 and Forecast 2025 to 2035, By Country
    • Historical Market Size Value (USD Million) Trend Analysis By Market Taxonomy, 2020 to 2024
    • Market Size Value (USD Million) Forecast By Market Taxonomy, 2025 to 2035
      • By Country
        • China
        • Japan
        • South Korea
      • By Classification
      • By Application
    • Market Attractiveness Analysis
      • By Country
      • By Classification
      • By Application
    • Key Takeaways
  14. South Asia and Pacific Market Analysis 2020 to 2024 and Forecast 2025 to 2035, By Country
    • Historical Market Size Value (USD Million) Trend Analysis By Market Taxonomy, 2020 to 2024
    • Market Size Value (USD Million) Forecast By Market Taxonomy, 2025 to 2035
      • By Country
        • India
        • ASEAN
        • Australia & New Zealand
        • Rest of South Asia and Pacific
      • By Classification
      • By Application
    • Market Attractiveness Analysis
      • By Country
      • By Classification
      • By Application
    • Key Takeaways
  15. Middle East & Africa Market Analysis 2020 to 2024 and Forecast 2025 to 2035, By Country
    • Historical Market Size Value (USD Million) Trend Analysis By Market Taxonomy, 2020 to 2024
    • Market Size Value (USD Million) Forecast By Market Taxonomy, 2025 to 2035
      • By Country
        • Kingdom of Saudi Arabia
        • Other GCC Countries
        • Turkiye
        • South Africa
        • Other African Union
        • Rest of Middle East & Africa
      • By Classification
      • By Application
    • Market Attractiveness Analysis
      • By Country
      • By Classification
      • By Application
    • Key Takeaways
  16. Key Countries Market Analysis
    • USA
      • Pricing Analysis
      • Market Share Analysis, 2024
        • By Classification
        • By Application
    • Canada
      • Pricing Analysis
      • Market Share Analysis, 2024
        • By Classification
        • By Application
    • Mexico
      • Pricing Analysis
      • Market Share Analysis, 2024
        • By Classification
        • By Application
    • Brazil
      • Pricing Analysis
      • Market Share Analysis, 2024
        • By Classification
        • By Application
    • Chile
      • Pricing Analysis
      • Market Share Analysis, 2024
        • By Classification
        • By Application
    • Germany
      • Pricing Analysis
      • Market Share Analysis, 2024
        • By Classification
        • By Application
    • UK
      • Pricing Analysis
      • Market Share Analysis, 2024
        • By Classification
        • By Application
    • Italy
      • Pricing Analysis
      • Market Share Analysis, 2024
        • By Classification
        • By Application
    • Spain
      • Pricing Analysis
      • Market Share Analysis, 2024
        • By Classification
        • By Application
    • France
      • Pricing Analysis
      • Market Share Analysis, 2024
        • By Classification
        • By Application
    • India
      • Pricing Analysis
      • Market Share Analysis, 2024
        • By Classification
        • By Application
    • ASEAN
      • Pricing Analysis
      • Market Share Analysis, 2024
        • By Classification
        • By Application
    • Australia & New Zealand
      • Pricing Analysis
      • Market Share Analysis, 2024
        • By Classification
        • By Application
    • China
      • Pricing Analysis
      • Market Share Analysis, 2024
        • By Classification
        • By Application
    • Japan
      • Pricing Analysis
      • Market Share Analysis, 2024
        • By Classification
        • By Application
    • South Korea
      • Pricing Analysis
      • Market Share Analysis, 2024
        • By Classification
        • By Application
    • Russia
      • Pricing Analysis
      • Market Share Analysis, 2024
        • By Classification
        • By Application
    • Poland
      • Pricing Analysis
      • Market Share Analysis, 2024
        • By Classification
        • By Application
    • Hungary
      • Pricing Analysis
      • Market Share Analysis, 2024
        • By Classification
        • By Application
    • Kingdom of Saudi Arabia
      • Pricing Analysis
      • Market Share Analysis, 2024
        • By Classification
        • By Application
    • Turkiye
      • Pricing Analysis
      • Market Share Analysis, 2024
        • By Classification
        • By Application
    • South Africa
      • Pricing Analysis
      • Market Share Analysis, 2024
        • By Classification
        • By Application
  17. Market Structure Analysis
    • Competition Dashboard
    • Competition Benchmarking
    • Market Share Analysis of Top Players
      • By Regional
      • By Classification
      • By Application
  18. Competition Analysis
    • Competition Deep Dive
      • Infineon
        • Overview
        • Product Portfolio
        • Profitability by Market Segments (Product/Age /Sales Channel/Region)
        • Sales Footprint
        • Strategy Overview
          • Marketing Strategy
          • Product Strategy
          • Channel Strategy
      • Mitsubishi Electric (Vincotech)
      • Fuji Electric
      • Hitachi Power Semiconductor Device
      • Bosch
      • Onsemi
      • Toshiba
      • Microchip
      • STMicroelectronics
      • BYD
      • Denso
      • SanRex Corporation
  19. Assumptions & Acronyms Used
  20. Research Methodology

List of Tables

  • Table 1: Global Market Value (USD Million) Forecast by Region, 2020 to 2035
  • Table 2: Global Market Value (USD Million) Forecast by Classification , 2020 to 2035
  • Table 3: Global Market Value (USD Million) Forecast by Application, 2020 to 2035
  • Table 4: North America Market Value (USD Million) Forecast by Country, 2020 to 2035
  • Table 5: North America Market Value (USD Million) Forecast by Classification , 2020 to 2035
  • Table 6: North America Market Value (USD Million) Forecast by Application, 2020 to 2035
  • Table 7: Latin America Market Value (USD Million) Forecast by Country, 2020 to 2035
  • Table 8: Latin America Market Value (USD Million) Forecast by Classification , 2020 to 2035
  • Table 9: Latin America Market Value (USD Million) Forecast by Application, 2020 to 2035
  • Table 10: Western Europe Market Value (USD Million) Forecast by Country, 2020 to 2035
  • Table 11: Western Europe Market Value (USD Million) Forecast by Classification , 2020 to 2035
  • Table 12: Western Europe Market Value (USD Million) Forecast by Application, 2020 to 2035
  • Table 13: Eastern Europe Market Value (USD Million) Forecast by Country, 2020 to 2035
  • Table 14: Eastern Europe Market Value (USD Million) Forecast by Classification , 2020 to 2035
  • Table 15: Eastern Europe Market Value (USD Million) Forecast by Application, 2020 to 2035
  • Table 16: East Asia Market Value (USD Million) Forecast by Country, 2020 to 2035
  • Table 17: East Asia Market Value (USD Million) Forecast by Classification , 2020 to 2035
  • Table 18: East Asia Market Value (USD Million) Forecast by Application, 2020 to 2035
  • Table 19: South Asia and Pacific Market Value (USD Million) Forecast by Country, 2020 to 2035
  • Table 20: South Asia and Pacific Market Value (USD Million) Forecast by Classification , 2020 to 2035
  • Table 21: South Asia and Pacific Market Value (USD Million) Forecast by Application, 2020 to 2035
  • Table 22: Middle East & Africa Market Value (USD Million) Forecast by Country, 2020 to 2035
  • Table 23: Middle East & Africa Market Value (USD Million) Forecast by Classification , 2020 to 2035
  • Table 24: Middle East & Africa Market Value (USD Million) Forecast by Application, 2020 to 2035

List of Figures

  • Figure 1: Global Market Pricing Analysis
  • Figure 2: Global Market Value (USD Million) Forecast 2020-2035
  • Figure 3: Global Market Value Share and BPS Analysis by Classification , 2025 and 2035
  • Figure 4: Global Market Y-o-Y Growth Comparison by Classification , 2025-2035
  • Figure 5: Global Market Attractiveness Analysis by Classification
  • Figure 6: Global Market Value Share and BPS Analysis by Application, 2025 and 2035
  • Figure 7: Global Market Y-o-Y Growth Comparison by Application, 2025-2035
  • Figure 8: Global Market Attractiveness Analysis by Application
  • Figure 9: Global Market Value (USD Million) Share and BPS Analysis by Region, 2025 and 2035
  • Figure 10: Global Market Y-o-Y Growth Comparison by Region, 2025-2035
  • Figure 11: Global Market Attractiveness Analysis by Region
  • Figure 12: North America Market Incremental Dollar Opportunity, 2025-2035
  • Figure 13: Latin America Market Incremental Dollar Opportunity, 2025-2035
  • Figure 14: Western Europe Market Incremental Dollar Opportunity, 2025-2035
  • Figure 15: Eastern Europe Market Incremental Dollar Opportunity, 2025-2035
  • Figure 16: East Asia Market Incremental Dollar Opportunity, 2025-2035
  • Figure 17: South Asia and Pacific Market Incremental Dollar Opportunity, 2025-2035
  • Figure 18: Middle East & Africa Market Incremental Dollar Opportunity, 2025-2035
  • Figure 19: North America Market Value Share and BPS Analysis by Country, 2025 and 2035
  • Figure 20: North America Market Value Share and BPS Analysis by Classification , 2025 and 2035
  • Figure 21: North America Market Y-o-Y Growth Comparison by Classification , 2025-2035
  • Figure 22: North America Market Attractiveness Analysis by Classification
  • Figure 23: North America Market Value Share and BPS Analysis by Application, 2025 and 2035
  • Figure 24: North America Market Y-o-Y Growth Comparison by Application, 2025-2035
  • Figure 25: North America Market Attractiveness Analysis by Application
  • Figure 26: Latin America Market Value Share and BPS Analysis by Country, 2025 and 2035
  • Figure 27: Latin America Market Value Share and BPS Analysis by Classification , 2025 and 2035
  • Figure 28: Latin America Market Y-o-Y Growth Comparison by Classification , 2025-2035
  • Figure 29: Latin America Market Attractiveness Analysis by Classification
  • Figure 30: Latin America Market Value Share and BPS Analysis by Application, 2025 and 2035
  • Figure 31: Latin America Market Y-o-Y Growth Comparison by Application, 2025-2035
  • Figure 32: Latin America Market Attractiveness Analysis by Application
  • Figure 33: Western Europe Market Value Share and BPS Analysis by Country, 2025 and 2035
  • Figure 34: Western Europe Market Value Share and BPS Analysis by Classification , 2025 and 2035
  • Figure 35: Western Europe Market Y-o-Y Growth Comparison by Classification , 2025-2035
  • Figure 36: Western Europe Market Attractiveness Analysis by Classification
  • Figure 37: Western Europe Market Value Share and BPS Analysis by Application, 2025 and 2035
  • Figure 38: Western Europe Market Y-o-Y Growth Comparison by Application, 2025-2035
  • Figure 39: Western Europe Market Attractiveness Analysis by Application
  • Figure 40: Eastern Europe Market Value Share and BPS Analysis by Country, 2025 and 2035
  • Figure 41: Eastern Europe Market Value Share and BPS Analysis by Classification , 2025 and 2035
  • Figure 42: Eastern Europe Market Y-o-Y Growth Comparison by Classification , 2025-2035
  • Figure 43: Eastern Europe Market Attractiveness Analysis by Classification
  • Figure 44: Eastern Europe Market Value Share and BPS Analysis by Application, 2025 and 2035
  • Figure 45: Eastern Europe Market Y-o-Y Growth Comparison by Application, 2025-2035
  • Figure 46: Eastern Europe Market Attractiveness Analysis by Application
  • Figure 47: East Asia Market Value Share and BPS Analysis by Country, 2025 and 2035
  • Figure 48: East Asia Market Value Share and BPS Analysis by Classification , 2025 and 2035
  • Figure 49: East Asia Market Y-o-Y Growth Comparison by Classification , 2025-2035
  • Figure 50: East Asia Market Attractiveness Analysis by Classification
  • Figure 51: East Asia Market Value Share and BPS Analysis by Application, 2025 and 2035
  • Figure 52: East Asia Market Y-o-Y Growth Comparison by Application, 2025-2035
  • Figure 53: East Asia Market Attractiveness Analysis by Application
  • Figure 54: South Asia and Pacific Market Value Share and BPS Analysis by Country, 2025 and 2035
  • Figure 55: South Asia and Pacific Market Value Share and BPS Analysis by Classification , 2025 and 2035
  • Figure 56: South Asia and Pacific Market Y-o-Y Growth Comparison by Classification , 2025-2035
  • Figure 57: South Asia and Pacific Market Attractiveness Analysis by Classification
  • Figure 58: South Asia and Pacific Market Value Share and BPS Analysis by Application, 2025 and 2035
  • Figure 59: South Asia and Pacific Market Y-o-Y Growth Comparison by Application, 2025-2035
  • Figure 60: South Asia and Pacific Market Attractiveness Analysis by Application
  • Figure 61: Middle East & Africa Market Value Share and BPS Analysis by Country, 2025 and 2035
  • Figure 62: Middle East & Africa Market Value Share and BPS Analysis by Classification , 2025 and 2035
  • Figure 63: Middle East & Africa Market Y-o-Y Growth Comparison by Classification , 2025-2035
  • Figure 64: Middle East & Africa Market Attractiveness Analysis by Classification
  • Figure 65: Middle East & Africa Market Value Share and BPS Analysis by Application, 2025 and 2035
  • Figure 66: Middle East & Africa Market Y-o-Y Growth Comparison by Application, 2025-2035
  • Figure 67: Middle East & Africa Market Attractiveness Analysis by Application
  • Figure 68: Global Market - Tier Structure Analysis
  • Figure 69: Global Market - Company Share Analysis
Dashboard
Dashboard
Dashboard
Dashboard
Dashboard
Dashboard

Our Research Products

Full Research Suite

The "Full Research Suite" delivers actionable market intel, deep dives on markets or technologies, so clients act faster, cut risk, and unlock growth.

Competitor Leaderboard Report

The Leaderboard benchmarks and ranks top vendors, classifying them as Established Leaders, Leading Challengers, or Disruptors & Challengers.

Future Leaders Index

Locates where complements amplify value and substitutes erode it, forecasting net impact by horizon

Market Data & Forecasts

We deliver granular, decision-grade intel: market sizing, 5-year forecasts, pricing, adoption, usage, revenue, and operational KPIs—plus competitor tracking, regulation, and value chains—across 60 countries broadly.

Market Focus Report

Spot the shifts before they hit your P&L. We track inflection points, adoption curves, pricing moves, and ecosystem plays to show where demand is heading, why it is changing, and what to do next across high-growth markets and disruptive tech

Survey Report

Real-time reads of user behavior. We track shifting priorities, perceptions of today’s and next-gen services, and provider experience, then pace how fast tech moves from trial to adoption, blending buyer, consumer, and channel inputs with social signals (#WhySwitch, #UX).

Bespoke Reports

Partner with our analyst team to build a custom report designed around your business priorities. From analysing market trends to assessing competitors or crafting bespoke datasets, we tailor insights to your needs.

Supplier Intelligence

Discovery & Profiling

Capacity & Footprint

Performance & Risk

Compliance & Governance

Commercial Readiness

Who Supplies Whom

Scorecards & Shortlists

Playbooks & Docs

Category Intelligence

Definition & Scope

Demand & Use Cases

Cost Drivers

Market Structure

Supply Chain Map

Trade & Policy

Operating Norms

Deliverables

Buyer Intelligence

Account Basics

Spend & Scope

Procurement Model

Vendor Requirements

Terms & Policies

Entry Strategy

Pain Points & Triggers

Outputs

Pricing Analysis

Benchmarks

Trends

Should-Cost

Indexation

Landed Cost

Commercial Terms

Deliverables

Brand Analysis

Positioning & Value Prop

Share & Presence

Customer Evidence

Go-to-Market

Digital & Reputation

Compliance & Trust

KPIs & Gaps

Outputs

Full Research Suite comprises of:

Market outlook & trends analysis

Market outlook & trends analysis

Interviews & case studies

Interviews & case studies

Strategic recommendations

Strategic recommendations

Vendor profiles & capabilities analysis

Vendor profiles & capabilities analysis

5-year forecasts

5-year forecasts

8 regions and 60+ country-level data splits

8 regions and 60+ country-level data splits

Market segment data splits

Market segment data splits

12 months of continuous data updates

12 months of continuous data updates

DELIVERED AS:

PDF EXCEL ONLINE

Full Research Suite


$5000

$7500

$10000

Buy Report Now
Similar Industry Reports

Similar Industry Reports

Direct Fast Dyes Market

Direct Fast Dyes Market Size and Share Forecast Outlook 2025 to 2035

Direct Thermal Printing Film Market

Direct Thermal Printing Film Market Size and Share Forecast Outlook 2025 to 2035

Directional Drilling Service Market

Directional Drilling Service Market Forecast Outlook 2025 to 2035

Direct Methanol Fuel Cell Market

Direct Methanol Fuel Cell Market Size and Share Forecast Outlook 2025 to 2035

Direct Operated Poppet Valve Market

Direct Operated Poppet Valve Market Forecast and Outlook 2025 to 2035

Direct to Garment Printing Market

Direct to Garment Printing Market Size and Share Forecast Outlook 2025 to 2035

Direct Burial Fiber Optic Cable Market

Direct Burial Fiber Optic Cable Market Size and Share Forecast Outlook 2025 to 2035

Directed Energy Weapons Market

Directed Energy Weapons Market Size and Share Forecast Outlook 2025 to 2035

Direct Write Semiconductor Market

Direct Write Semiconductor Market Size and Share Forecast Outlook 2025 to 2035

Direct Oral Anticoagulants Market

Direct Oral Anticoagulants Market Size and Share Forecast Outlook 2025 to 2035

Direct Thermal Linerless Labels Market

Direct Thermal Linerless Labels Market Size and Share Forecast Outlook 2025 to 2035

Direct Thermal Inks & Coating Market

Direct Thermal Inks & Coating Market from 2025 to 2035

Direct-to-shape Inkjet Printer Market

Direct-to-Shape Inkjet Printer Market Size, Growth, and Forecast 2025 to 2035

Directed Energy-Based Surgical Systems Market

Directed Energy-Based Surgical Systems Market Growth – Forecast 2025 to 2035

Direct-to-Consumer Genetic Testing Market

Direct-to-Consumer Genetic Testing Market Analysis - Trends & Outlook 2025 to 2035

Direct-to-shape Inkjet Printer Market Share Analysis

Assessing Direct-to-shape Inkjet Printer Market Share & Industry Trends

Direct Thermal Printing Films Market Share Analysis

Market Share Insights of Leading Direct Thermal Printing Film Providers

Direct to Garment Printing Market Share Analysis

Evaluating Direct to Garment Printing Market Share & Provider Insights

Direct Thermal Inks & Coating Market Share Analysis

Market Share Distribution Among Direct Thermal Inks & Coating Manufacturers

Direct Thermal Linerless Market Share Analysis

Market Share Insights of Direct Thermal Linerless Providers

Future Market Insights

Direct Liquid Cooling IGBT Module Market

Chat With MaRIA

Chat With

MaRIA

Hi There, I am MaRIA, Your Market Research Intelligence Assistant. How may I help you?