
- Market Size (2026)
- USD 1.4 Bn
- Forecast (2036)
- USD 3.1 Bn
- CAGR (2026 to 2036)
- 8.1%
How big is the Islanding Protection Market in 2026?
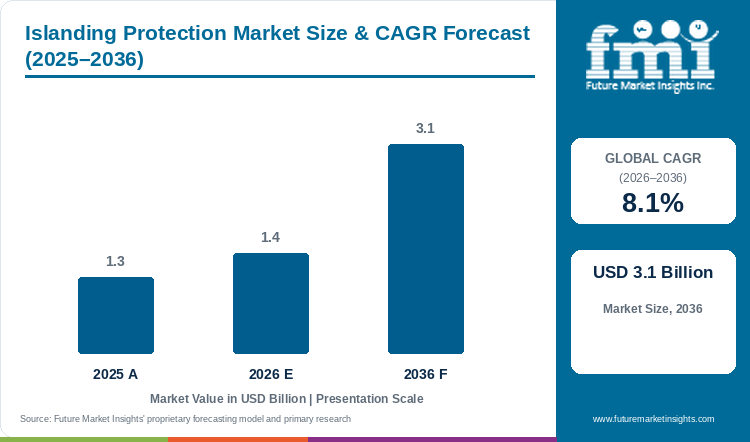
The Islanding Protection Market is projected to reach USD 3.1 billion by 2036, growing at an 8.1% CAGR from 2026 to 2036. The market is estimated at USD 1.4 billion in 2026.
Islanding Protection Market Size and Forecast
Table 1: Islanding Protection Market Size and Forecast
| Market size and forecast | Value |
|---|---|
| Market size in 2025 | USD 1.3 billion |
| Estimated market size in 2026 | USD 1.4 billion |
| Projected market size by 2036 | USD 3.1 billion |
| CAGR from 2026 to 2036 | 8.1% |
Source: Future Market Insights analysis of the islanding protection market, 2026.
The market was valued at USD 1.3 billion in 2025. Islanding protection covers the relays, recloser controls and detection systems that disconnect a generator when the part of the network it feeds has lost grid supply. IEEE 1547-2018, the interconnection standard for distributed energy resources, lists islanding among its topics. The nearest demand signal is the build-out of distributed generation. IEA-PVPS reported that about 698 GW of new PV systems were installed worldwide in 2025. That took global capacity to nearly 3 TW. In the United Kingdom, 296,000 solar installations came online in the 12 months to September 2026. That is the most in any 12-month period on record.
Compliance rules and retrofit payments set the pace of replacement. In Great Britain, Engineering Recommendation G59 Issue 3 Amendment 3 of February 2018 stopped vector shift relays being deemed adequate for plant commissioned after 1 February 2018. It pointed to rate of change of frequency settings of 1 Hz/s with a 0.5 s delay. Network operators then paid generators to switch. UK Power Networks offered GBP 4,000 plus VAT for a relay change and GBP 2,500 plus VAT for a settings change only, in a letter dated 1 May 2018. After the third assessment window of the Accelerated Loss of Mains Change Programme, 4,182 sites with 8,001 MW of capacity had been approved. Payments to generator owners came to about GBP 15.1 million. In Australia, AS/NZS 4777.2:2020 Amd 2:2024 came into effect on 23 August 2025. Inverters that do not comply have been removed from the Clean Energy Council approved list.
Key Market Trends & Insights
- On 5 March 2026 Schweitzer Engineering Laboratories and Puget Sound Energy reported completion of a community microgrid at Samish Island, Washington. An SEL-651R recloser control trips the utility recloser at the point of common coupling. The homes and fire station then run on their own, and the system handled five islanding events in its first storm season.
- As of September 2026, more than 16% of new US utility-scale solar capacity added during the year is co-located with operable battery storage, up from 2% in 2017. Reported plans point to 19% for 2026 and more than 30% for 2027 and 2028.
- The UK Department for Energy Security and Net Zero published statistics on 29 October 2026. They show provisional solar capacity of 23.4 GW across 2,160,000 installations at the end of September 2026. Capacity was up 8.9% on September 2025.
Regional Highlights
- North America: small-scale solar generation in the United States rose from 18,812 GWh to 92,979 GWh over the last decade. California alone produced 34,411 GWh in 2025, 37% of the national total.
- Europe: Germany had 130,675 MW of registered solar capacity in 6,395,688 units in September 2026, against 118,050 MW in 2025. The United Kingdom reached 23.4 GW of solar capacity.
- Asia Pacific: China accounted for around 60% of the roughly 698 GW of new PV installed worldwide in 2025. Australia recorded 30,917,812 kW of small-scale solar PV across 4,562,198 systems as at 30 September 2026.
Analyst Perspective
“Demand follows the number of generators that must be told, within a fraction of a second, that the grid has gone. Relays still carry most of that duty. The buying point is moving toward recloser controls and microgrid controllers, as feeders collect rooftop solar and batteries. Utilities that standardise settings across a feeder fleet, and test them against the interconnection rule in force, will spend less than those that set each site on its own.”
- Nikhil Kaitwade, Principal Consultant, FMI
How is the Islanding Protection Market segmented?
- By product: Protection Relays, Reclosers & Feeder Controllers and Islanding Detection & Protection Systems
- By application: Solar PV, Wind, Battery Energy Storage Systems (BESS), CHP / Cogeneration, Diesel & Gas Generation and Others
- By region: North America, Europe and Asia Pacific
Why does Protection Relays lead by Product in the Islanding Protection Market in 2026?
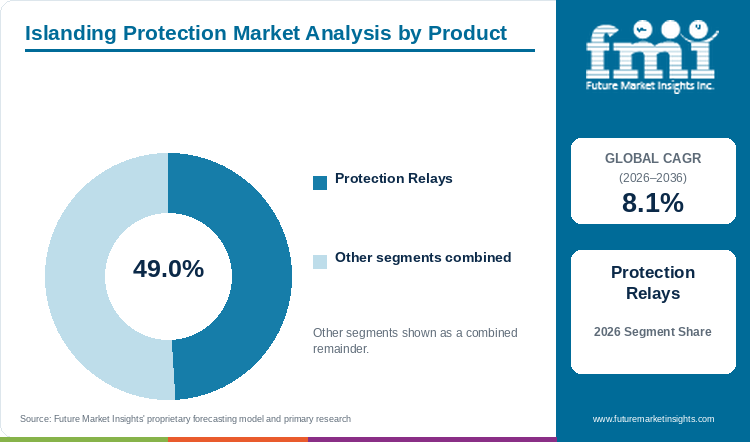
Protection Relays accounts for 49.0% of the Islanding Protection Market by product in 2026. The relay is where most islanding functions sit. SEL lists islanding detection among the features of its SEL-751 feeder relay, with an optional vector shift function that detects islanding by sensing voltage angle changes when bulk generation is lost [5]. ABB's REG615 generator and interconnection relay includes voltage vector shift protection [4]. It detects islanding by measuring the duration of the voltage cycle, and it can be secured with frequency and voltage based protection [4]. The product guide gives a typical operate time of 53 ms at 50 Hz [4]. GE Vernova lists frequency rate of change as element 81R in the Multilin 850 feeder relay and as 81df/dt in its P40 Agile range [8][9]. Breadth of supply helps the relay hold its share. Hitachi Energy lists interconnection protection among the typical applications of its REF650 relay for distribution networks with many distributed energy resources [10]. Siemens positions its SIPROTEC family as multifunctional protection relays, including universal protection for feeders, lines and motors in medium-voltage grids [13]. Beckwith Electric, part of Hubbell, describes the M-7651A as built for feeder protection, bay control and DG interconnection protection [14]. Reclosers take the next share. S&C describes the IntelliRupter PulseCloser as providing fault interruption, fault isolation and circuit restoration in one package [11]. Islanding detection then arrives through the control, as the SEL-651R shows [6]. Recloser buyers therefore compare control firmware as closely as the switching hardware.
Table 2: Product, 2026 Share
| Leading Share | 2026 market share |
|---|---|
| Protection Relays | 49.0% |
| All Other Segments Combined Share | 51.0% |
Source: Future Market Insights analysis of the islanding protection market, 2026.
Why does Solar PV lead by Application in the Islanding Protection Market in 2026?
Solar PV accounts for 34.0% of the Islanding Protection Market by application in 2026. The international test standard for PV inverters is explicit about islanding. IEC 62116, edition 2.0, was published on 26 February 2014 [2]. It provides a test procedure to evaluate the performance of islanding prevention measures in utility-interconnected photovoltaic systems [2]. Volume explains the rest. IEA-PVPS counted about 698 GW of new PV worldwide in 2025, with China at around 60% of installations [21]. The European Union, India and the United States led growth outside China [21]. Rooftop fleets create the duty at feeder level. Australia lists 4,562,198 small-scale solar PV systems as at 30 September 2026 [18]. Germany had registered 6,395,688 solar units [20], and the United Kingdom counted 2,160,000 installations [17]. Each of these systems is a generator connected through solar inverters. It must stop energising a line the grid has dropped. That is why grid operators in the United Kingdom and Australia have written and amended protection rules for them [15][19].
Table 3: Application, 2026 Share
| Leading Share | 2026 market share |
|---|---|
| Solar PV | 34.0% |
| All Other Segments Combined Share | 66.0% |
Source: Future Market Insights analysis of the islanding protection market, 2026.
What are the key drivers, restraints and opportunities?
Driver
Distributed solar and storage growth. Generator fleets keep expanding at the edge of the network. EIA reported on 30 October 2026 that more than 16% of new US utility-scale solar capacity added this year is paired with operable battery storage [23]. The UK added 296,000 solar installations in the 12 months to September 2026 [17]. A site that can keep supplying power after the grid trips still has to be isolated. IEEE 1547-2018 treats islanding as part of the interconnection requirement [1]. More generators on a feeder means more interconnection points to protect.
Rule changes and paid retrofits. National rules have been rewritten within the last decade, and operators have funded the switch. The United Kingdom moved generators from vector shift to rate of change of frequency settings of 1 Hz/s with a 0.5 s delay [16]. The programme report records 1,773 sites declaring completion of works and 737 sites paid [15]. Australia's Amd 2:2024 to AS/NZS 4777.2:2020 took effect on 23 August 2025 [19]. Germany's VDE-AR-N 4105, in its 2026-03 edition, is the current technical rule according to DIN [3].
Restraint
Nuisance tripping and settings risk. Loss-of-mains settings that are too sensitive trip healthy generators at the wrong moment. The programme report put the generation at risk of inadvertent loss-of-mains tripping at 20 to 24 GW, split between 10 to 22 GW on vector shift and 2 to 10 GW on rate of change of frequency [15]. The report gives these as ranges, not single values. It added that the reduction of rate of change of frequency risk was not yet enough to reduce operational costs [15]. Network operators witnessed tests at 129 sites that had declared completion [15]. Each settings change therefore also carries testing effort.
Rules that differ by country and keep changing. IEEE 1547-2018 has an amendment, 1547a-2020, and a revision, P1547, is in development [1]. Great Britain uses rate of change of frequency settings of 1 Hz/s with a 0.5 s delay for plant covered by its rule [16]. Australia revised its inverter standard in 2024 [19]. Germany's low-voltage rule, VDE-AR-N 4105, is now in its 2026-03 edition [27]. Suppliers therefore need to maintain several settings and approval variants.
Opportunity
Microgrids and storage-linked feeders. Utilities are building feeders that can run on their own. Each one needs detection, a controller and a recloser. The Samish Island microgrid combines a battery system, solar generation from three homes and an 8 kW array at the fire station [7]. It uses an SEL-3555 controller and an SEL-651R recloser control [7]. Plans for co-located battery storage and solar put the share above 30% for 2027 and 2028 [23]. Suppliers that sell the relay, recloser control and controller as one tested package gain the system sale.
Replacement of legacy sites. Plants commissioned before a rule change were set to the earlier rule. The UK programme had approved 4,182 sites with 8,001 MW of capacity by its third window [15]. Australia has removed inverter models that do not comply with the 2024 amendment from its approved list [19]. Each rule change affects which newly supplied devices can be approved, and existing installations depend on their transition rules.
Islanding Protection Market by Country (2026 to 2036)
Table 4: Islanding Protection Market Country Growth Forecast
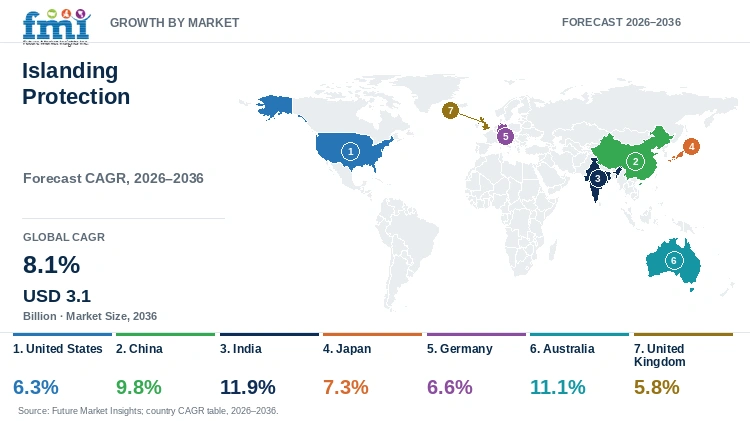
| Country | CAGR, 2026 to 2036 |
|---|---|
| United States | 6.3% |
| China | 9.8% |
| India | 11.9% |
| Japan | 7.3% |
| Germany | 6.6% |
| Australia | 11.1% |
| United Kingdom | 5.8% |
Source: Future Market Insights analysis of the islanding protection market, 2026.
United States
IEEE 1547-2018 sets the interconnection and interoperability rules for distributed energy resources in the United States, and its topics include islanding. The IEEE board approved it on 15 February 2018 and published it on 6 April 2018 [1]. An amendment, 1547a-2020, exists, and a revision, P1547, is in development [1]. SEL describes its SEL-651R recloser control as the first to support IEEE 1547-2018 and fast islanding detection for DER interconnections [6]. Buyers specifying new interconnections should ask every supplier to show which edition each device supports.
Distributed solar and storage drive US demand. EIA's analysis of 16 October 2026 puts US small-scale solar generation at 92,979 GWh, led by California, Arizona, Texas and Florida [22]. It notes that growth peaked at 25% in 2022 and has slowed since [22]. On 30 October 2026 EIA reported that more than 16% of new utility-scale solar added this year is co-located with battery storage [23]. A market past its fastest growth phase relies more on upgrades and storage-linked sites than on first-time rooftop connections.
Utilities are also building islandable systems. Puget Sound Energy and SEL reported on 5 March 2026 that they had completed the Samish Island microgrid [7]. It supports a volunteer fire station serving nearly 500 households, and it handled five islanding events in its first storm season [7]. S&C sells the TripSaver II single-phase cutout-mounted recloser, which replaces fuses on lateral lines [12]. It also sells the IntelliRupter PulseCloser for feeder segmentation [11]. Rural co-operatives with long laterals are natural buyers of the first. Utilities with automated feeders are natural buyers of the second.
China
China accounted for around 60% of all new PV installed worldwide in 2025, in a year when IEA-PVPS estimates global additions at about 698 GW [21]. Ember reports that China's solar generation increased by 336 TWh in 2025, up 40% from 2024, reaching 1,175 TWh [25]. Wind and solar together supplied 22% of the country's electricity [25].
IEC 62116 tests islanding prevention in utility-interconnected photovoltaic inverters [2]. The inverter therefore carries the first layer of protection. Relays and recloser controls form a second layer at the plant boundary and on the feeder. Suppliers whose products appear in the relay segment, such as ABB with the REG615 [4] and Hitachi Energy with the REF650 [10], list the interconnection functions that this second layer needs.
China adds the most capacity in the world. Its forecast rate of 9.8% sits below India's and Australia's, because the installed base is already the largest. Spending grows more slowly from that base. Growth will come more from replacing older protection and from storage-linked sites than from first-time installation. Suppliers should plan sales around plant upgrades.
India
Ember reports that India had 258 GW of installed renewable capacity as of December 2025 [24]. That is progress toward a 2030 target of 500 GW of non-fossil capacity [24]. Solar alone met 9.4% of total electricity demand in 2025, and wind and solar together 14% [24].
IEA-PVPS names India, with the European Union and the United States, among the growth leaders outside China in 2025 [21]. Ember notes that solar capacity has grown about fourteen-fold over the last decade [24]. Rapid growth means new connection points are added every year, each needing interconnection protection.
India's forecast rate of 11.9% is the highest of the seven profiled countries. It starts from a base where renewables are a rising share of supply. Ember's analysis of current plans reaches 42% renewable generation by 2030 [24]. Global relay suppliers such as ABB and Hitachi Energy list products for interconnection protection [4][10]. Buyers need to know which standard each utility applies at the connection point.
Japan
Ember reports that solar reached about 10% of Japan's electricity generation in 2025 for the first time [26]. Solar nearly tripled its share in a decade [26]. Japan is the world's fourth-largest solar generator [26].
Wind was about 1% of generation in 2025, but output rose by 1.3 TWh, or 11%, the second-largest annual increase on record for the country [26]. Ember records Japan's aim as 38% renewable electricity by 2030 as of March 2026 [26]. Solar is the larger base, and wind is the smaller one that is starting to move.
Fossil sources still supplied 67% of generation and low-carbon sources 33% in 2025 [26]. A 38% renewable target means the renewable fleet that islanding protection must cover will keep expanding. The forecast rate of 7.3% sits close to the global rate of 8.1%. That points to steady replacement and extension of existing protection, not a surge.
Germany
The Bundesnetzagentur's register statistics, dated 13 October 2026, show 130,675 MW of solar capacity in 6,395,688 units in September 2026, against 118,050 MW in 2025 [20]. Onshore wind stood at 71,267 MW and offshore wind at 11,539 MW [20]. The monthly net addition for solar in September 2026 was about 1.2 GW, once expected late registrations are included [20].
DIN lists VDE-AR-N 4105 as a current technical rule in its 2026-03 edition [3]. The edition was published on 27 February 2026, and installations certified under the 2018-11 edition are not automatically invalid [27]. The title shows its coverage: generators connected at the low-voltage level, where most rooftop systems connect.
Targets keep the build-out going. The statistics take 215 GW of solar, 115 GW of onshore wind and 30 GW of offshore wind as the goals for 2030 under the EEG and the offshore wind law [20]. Larger wind and storage connections sit at medium voltage and above. Siemens, whose SIPROTEC page covers medium-voltage grids [13], and Hitachi Energy [10] compete for that business. Each gigawatt of offshore wind added widens that market.
Australia
The Clean Energy Regulator reports 4,562,198 small-scale solar PV systems with 30,917,812 kW of capacity as at 30 September 2026, on a page last updated on 20 October 2026 [18]. That is a fleet of millions of small inverter-connected generators.
The Clean Energy Council states that AS/NZS 4777.2:2020 Amd 2:2024 came into effect on 23 August 2025. Inverters that do not comply with the updated standard have been removed from its approved list. Listing keeps those inverters eligible for small-scale technology certificates. Models approved under an AS/NZS 4777.2:2020 certificate carry an AS4777-2 2020 suffix [19].
In January 2026 the council brought forward the expiry dates of several inverters to 31 December 2027 [19]. It ties that change to the transition to new battery product specifications [19]. The forecast rate of 11.1% is the second highest of the seven. Frequent listing changes keep replacement demand alive, because each one prompts installers and manufacturers to re-list or replace products.
United Kingdom
DESNZ statistics published on 29 October 2026 show provisional solar capacity of 23.4 GW across 2,160,000 installations at the end of September 2026 [17]. Capacity rose 8.9% (1.9 GW) in a year [17]. There were 296,000 installations in the last 12 months, the most on record [17].
Loss of mains protection is the UK's best-documented islanding rule change. Engineering Recommendation G59 Issue 3 Amendment 3 of February 2018 stopped vector shift relays being deemed adequate for plant commissioned after 1 February 2018 [16]. It named rate of change of frequency settings of 1 Hz/s with a 0.5 s delay [16]. In a letter dated 1 May 2018, UK Power Networks asked for about 800 MW of vector shift capacity in southern England to move by 1 June 2018 [16].
The Accelerated Loss of Mains Change Programme, which ran from 2019 to 2022, then widened the change. After its third window, 4,182 sites with 8,001 MW had been approved [15]. A total of 1,773 sites had declared completion and 737 had been paid [15]. The UK has the lowest forecast rate of the seven at 5.8%. The programme's funding closed in 2022, with a compliance deadline of 1 September 2022, so its approvals are historical. Demand now comes mainly from new connections.
Who are the notable companies in the Islanding Protection Market?
Notable companies in the Islanding Protection Market include ABB, Schweitzer Engineering Laboratories, GE Vernova, Hitachi Energy, S&C Electric Company, Siemens and Beckwith Electric.
Where the islanding function sits separates the offers. SEL and ABB put it in the feeder or interconnection relay. SEL lists islanding detection and optional vector shift on the SEL-751 [5]. ABB builds voltage vector shift into the REG615 [4]. GE Vernova offers frequency rate of change in the Multilin 850 and P40 Agile ranges [8][9]. Hitachi Energy lists interconnection protection for the REF650 [10]. Utilities then choose between these functions according to the rule they must meet.
A second route runs through the feeder device. SEL describes the SEL-651R recloser control as the first to support IEEE 1547-2018 and fast islanding detection for DER interconnections [6]. S&C pairs fault interruption and restoration in the IntelliRupter PulseCloser [11]. It also sells the single-phase TripSaver II for lateral lines [12]. The Samish Island microgrid shows the system sale. An SEL-3555 controller coordinates the battery, the solar sources and the recloser control [7].
Standards and settings decide who qualifies. Utilities buy against local rules, such as G59 Issue 3 Amendment 3 in Great Britain [16], AS/NZS 4777.2:2020 Amd 2:2024 in Australia [19], IEEE 1547-2018 in the United States [1] and VDE-AR-N 4105 in Germany [3]. A supplier that documents which edition each device supports shortens approval. It also documents how vector shift combines with frequency and voltage functions, as ABB describes for the REG615 [4]. Siemens, with its SIPROTEC relay family [13], and Beckwith Electric, with the M-7651A [14], compete in the same relay segment.
Key Developments in the Islanding Protection Market
- On 5 March 2026, Puget Sound Energy and Schweitzer Engineering Laboratories reported completion of the Samish Island microgrid in Washington [7]. The system is built around an SEL-3555 controller and an SEL-651R recloser control [7]. It handled five islanding events in its first storm season [7].
- In April 2026, IEA-PVPS published its Snapshot 2026. It puts new PV installed worldwide in 2025 at about 698 GW and global capacity at nearly 3 TW [21].
- On 13 October 2026, the Bundesnetzagentur released register statistics. They show 130,675 MW of solar and 71,267 MW of onshore wind in Germany in September 2026 [20].
- On 29 October 2026, the UK Department for Energy Security and Net Zero published solar deployment statistics. They show 23.4 GW of capacity and a record 296,000 installations in the preceding 12 months [17].
Key Players in the Islanding Protection Market
- ABB
- Schweitzer Engineering Laboratories
- GE Vernova
- Hitachi Energy
- S&C Electric Company
- Siemens
- Beckwith Electric (Hubbell)
Islanding Protection Market Report Scope
Table 5: Islanding Protection Market Report Scope
| Coverage field | Report scope |
|---|---|
| Market definition | Relays, recloser and feeder controls and detection systems that detect islanding and disconnect distributed generation, measured by value of sales |
| Product | Protection Relays, Reclosers & Feeder Controllers, Islanding Detection & Protection Systems |
| Application | Solar PV, Wind, Battery Energy Storage Systems (BESS), CHP / Cogeneration, Diesel & Gas Generation, Others |
| Regions and profiled countries | North America, Europe and Asia Pacific, with United States, China, India, Japan, Germany, Australia and United Kingdom |
| Companies covered | ABB, Schweitzer Engineering Laboratories, GE Vernova, Hitachi Energy, S&C Electric Company, Siemens and Beckwith Electric (Hubbell) |
| Forecast period | 2026 to 2036, with 2025 as the historical base year |
| Quantitative Units | USD billion |
Source: Future Market Insights analysis of the islanding protection market, 2026.
Islanding Protection Market by Segments
Islanding Protection Market segmented by Product:
- Protection Relays
- Reclosers & Feeder Controllers
- Islanding Detection & Protection Systems
Islanding Protection Market segmented by Application:
- Solar PV
- Wind
- Battery Energy Storage Systems (BESS)
- CHP / Cogeneration
- Diesel & Gas Generation
- Others
Islanding Protection Market by Region
- North America
- Europe
- Asia Pacific
- United States
- China
- India
- Japan
- Germany
- Australia
- United Kingdom
Research Sources and Bibliography
- [1] IEEE Standards Association. (2018, April 6). IEEE Std 1547-2018, IEEE Standard for Interconnection and Interoperability of Distributed Energy Resources with Associated Electric Power Systems Interfaces. https://standards.ieee.org/ieee/1547/5915/
- [2] International Electrotechnical Commission. (2014, February 26). IEC 62116:2014, Utility-interconnected photovoltaic inverters - Test procedure of islanding prevention measures. https://webstore.iec.ch/en/publication/6479
- [3] DIN and DKE. (n.d.). VDE-AR-N 4105, Generators connected to the low-voltage distribution network. https://www.din.de/en/getting-involved/standards-committees/dke/publications/wdc-beuth:din21:296389983
- [4] ABB. (n.d.). Relion 615 series Generator and Interconnection Protection REG615, Product Guide. https://library.e.abb.com/public/a6e808e959de4c9aab7109d48bda4bbb/REG615_pg_758279_ENc.pdf
- [5] Schweitzer Engineering Laboratories. (n.d.). SEL-751 Feeder Protection Relay. https://selinc.com/products/751/
- [6] Schweitzer Engineering Laboratories. (n.d.). SEL-651R Advanced Recloser Control. https://selinc.com/products/651R/
- [7] Schweitzer Engineering Laboratories. (2026, March 5). SEL and Puget Sound Energy Collaborate With Customers for Community Microgrid. https://selinc.com/company/news/SEL-and-PSE-Complete-Microgrid-Project-for-Critical-Backup-Power/
- [8] GE Vernova. (n.d.). Multilin 850: Advanced Feeder Protection & Bay Controller. https://www.gevernova.com/electrification/automation/protection-control-metering/feeder-protection/multilin-850
- [9] GE Vernova. (n.d.). P40 Agile P14N, P14D and P94V Feeder Protection. https://www.gevernova.com/electrification/automation/protection-control-metering/feeder-protection/p40-agile-p14n-p14d-p94v
- [10] Hitachi Energy. (n.d.). Relion REF650. https://www.hitachienergy.com/products-and-solutions/substation-automation-protection-and-control/products/protection-and-control/relion-product-family/relion-ref650
- [11] S&C Electric Company. (n.d.). IntelliRupter PulseCloser Fault Interrupter. https://www.sandc.com/en/products--services/products/intellirupter-pulsecloser-fault-interrupter/
- [12] S&C Electric Company. (n.d.). TripSaver II Cutout-Mounted Recloser. https://www.sandc.com/en/products--services/products/tripsaver-ii-cutout-mounted-recloser/
- [13] Siemens. (n.d.). SIPROTEC protection relays. https://www.siemens.com/en-us/products/siprotec/
- [14] Hubbell Beckwith Electric. (n.d.). Beckwith Electric products. https://www.hubbell.com/beckwithelectric/en/
- [15] National Grid ESO, distribution network operators and Energy Networks Association. (n.d.). Window 3 Report, Accelerated Loss of Mains Change Programme (ALoMCP). https://www.enwl.co.uk/globalassets/get-connected/network-information/loss-of-mains/stakeholder-information/alomcp---window-three-report.pdf
- [16] UK Power Networks (Operations) Limited. (2018, May). Distributed Generators: Loss of Mains Protection change, away from Vector Shift (VS). https://www.neso.energy/document/113886/download
- [17] Department for Energy Security and Net Zero. (2026, October 29). Solar photovoltaics deployment in the UK, September 2026 (ET 6.3). https://assets.publishing.service.gov.uk/media/6ae0cc0c16428df537606259/ET_6.3_SOLAR_PV_OCT_26.xlsx
- [18] Clean Energy Regulator. (2026, October 20). Small-scale installation postcode data. https://cer.gov.au/markets/reports-and-data/small-scale-installation-postcode-data
- [19] Clean Energy Council. (n.d.). Approved inverters and AS/NZS 4777.2:2020. https://www.cleanenergycouncil.org.au/industry/products/inverters
- [20] Bundesnetzagentur. (2026, October 13). Statistik zur Stromerzeugungsleistung ausgewaehlter erneuerbarer Energietraeger, September 2026. https://www.bundesnetzagentur.de/DE/Fachthemen/ElektrizitaetundGas/ErneuerbareEnergien/EE-Statistik/DL/EEStatistikMaStR.pdf?__blob=publicationFile&v=57
- [21] IEA Photovoltaic Power Systems Programme. (2026, April). Snapshot 2026, Task 1. https://iea-pvps.org/snapshot-reports/snapshot-2026/
- [22] U.S. Energy Information Administration. (2026, October 16). U.S. small-scale solar generation has quadrupled in the last decade. https://www.eia.gov/todayinenergy/detail.php?id=68324
- [23] U.S. Energy Information Administration. (2026, October 30). The share of solar generation with co-located battery storage is increasing. https://www.eia.gov/todayinenergy/detail.php?id=68384
- [24] Ember. (n.d.). India electricity profile. https://ember-energy.org/countries-and-regions/india/
- [25] Ember. (n.d.). China electricity profile. https://ember-energy.org/countries-and-regions/china/
- [26] Ember. (2026, June 4). Japan electricity profile. https://ember-energy.org/countries-and-regions/japan/
- [27] VDE Association for Electrical, Electronic & Information Technologies. (2026, February 27). VDE-AR-N 4105:2026-03, Generators connected to the low-voltage distribution network. https://www.vde.com/de/fnn/themen/tar/tar-niederspannung/erzeugungsanlagen-am-niederspannungsnetz-vde-ar-n-4105-2018
- [28] National Grid. (n.d.). Fast track G99 connections for solar and wind. https://connections.nationalgrid.co.uk/get-connected/solar-and-wind/fast-track-g99
Table of Content
- Key Takeaways
- Market Size and CAGR
- Top Growth Driver
- Fastest Growing Segment
- Leading Region
- Key Companies
- Emerging Opportunities
- Executive Summary
- Global Market Outlook
- Demand-side Trends
- Supply-side Trends
- Technology Roadmap Analysis
- Analysis and Recommendations
- Analyst Perspective (What is happening? Why now? What should investors know?)
- Key Questions Answered
- How large is the market?
- What is the CAGR?
- What are key trends?
- Which region dominates?
- Who are the leaders?
Read More...
- Market Overview
- Market Coverage / Taxonomy
- Market Definition / Scope / Limitations
- Research Methodology
- Chapter Orientation
- Analytical Lens and Working Hypotheses
- Market Structure, Signals, and Trend Drivers
- Benchmarking and Cross-market Comparability
- Market Sizing, Forecasting, and Opportunity Mapping
- Research Design and Evidence Framework
- Desk Research Programme (Secondary Evidence)
- Expert Input and Fieldwork (Primary Evidence)
- Tooling, Models, and Reference Databases
- Data Engineering and Model Build
- Quality Assurance and Audit Trail
- Market Background
- Market Dynamics (Drivers, Restraints, Opportunity, Trends)
- Scenario Forecast (Optimistic, Likely, Conservative)
- Impact Analysis
- AI Impact
- Sustainability Impact
- Regulatory Impact
- Technology Impact
- Consumer / Buyer Analysis
- Purchase Drivers
- Adoption Barriers
- Buyer Journey
- Opportunity Map Analysis
- Product Life Cycle Analysis
- Supply Chain Analysis
- Investment Feasibility Matrix
- Value Chain Analysis
- PESTLE and Porter's Analysis
- Regulatory Landscape
- Regional Parent Market Outlook
- Production and Consumption Statistics
- Import and Export Statistics
- Global Market Analysis and Forecast, 2021 to 2036
- Historical Market Size Value (USD Billion) Analysis, 2021 to 2025
- Current and Future Market Size Value (USD Billion) Projections, 2026 to 2036
- Y-o-Y Growth Trend Analysis
- Absolute $ Opportunity Analysis
- Global Market Pricing Analysis, 2021 to 2036
- Global Market Analysis and Forecast, By Product, 2021 to 2036
- Introduction / Key Findings
- Historical Market Size Value (USD Billion) Analysis By Product, 2021 to 2025
- Current and Future Market Size Value (USD Billion) Analysis and Forecast By Product, 2026 to 2036
- Protection Relays
- Reclosers & Feeder Controllers
- Islanding Detection & Protection Systems
- Y-o-Y Growth Trend Analysis By Product, 2021 to 2025
- Absolute $ Opportunity Analysis By Product, 2026 to 2036
- Global Market Analysis and Forecast, By Application, 2021 to 2036
- Introduction / Key Findings
- Historical Market Size Value (USD Billion) Analysis By Application, 2021 to 2025
- Current and Future Market Size Value (USD Billion) Analysis and Forecast By Application, 2026 to 2036
- Solar PV
- Wind
- Battery Energy Storage Systems (BESS)
- CHP / Cogeneration
- Diesel & Gas Generation
- Others
- Y-o-Y Growth Trend Analysis By Application, 2021 to 2025
- Absolute $ Opportunity Analysis By Application, 2026 to 2036
- Global Market Analysis and Forecast, By Region, 2021 to 2036
- Introduction
- Historical Market Size Value (USD Billion) Analysis By Region, 2021 to 2025
- Current Market Size Value (USD Billion) Analysis and Forecast By Region, 2026 to 2036
- North America
- Europe
- Asia Pacific
- Market Attractiveness Analysis By Region
- North America Market Analysis and Forecast, By Country, 2021 to 2036
- Historical Market Size Value (USD Billion) Trend Analysis By Market Taxonomy, 2021 to 2025
- Market Size Value (USD Billion) Forecast By Market Taxonomy, 2026 to 2036
- By Country
- By Product
- By Application
- Market Attractiveness Analysis
- By Country
- By Product
- By Application
- Key Takeaways
- Europe Market Analysis and Forecast, By Country
- Historical Market Size Value (USD Billion) Trend Analysis By Market Taxonomy, 2021 to 2025
- Market Size Value (USD Billion) Forecast By Market Taxonomy, 2026 to 2036
- By Country
- By Product
- By Application
- Market Attractiveness Analysis
- By Country
- By Product
- By Application
- Key Takeaways
- Asia Pacific Market Analysis and Forecast, By Country
- Historical Market Size Value (USD Billion) Trend Analysis By Market Taxonomy, 2021 to 2025
- Market Size Value (USD Billion) Forecast By Market Taxonomy, 2026 to 2036
- By Country
- United States
- China
- India
- Japan
- Germany
- Australia
- United Kingdom
- By Product
- By Application
- By Country
- Market Attractiveness Analysis
- By Country
- By Product
- By Application
- Key Takeaways
- Key Countries Market Analysis
- United States
- Pricing Analysis
- Market Share Analysis, 2025
- By Product
- By Application
- Germany
- Pricing Analysis
- Market Share Analysis, 2025
- By Product
- By Application
- United Kingdom
- Pricing Analysis
- Market Share Analysis, 2025
- By Product
- By Application
- India
- Pricing Analysis
- Market Share Analysis, 2025
- By Product
- By Application
- China
- Pricing Analysis
- Market Share Analysis, 2025
- By Product
- By Application
- Japan
- Pricing Analysis
- Market Share Analysis, 2025
- By Product
- By Application
- Australia
- Pricing Analysis
- Market Share Analysis, 2025
- By Product
- By Application
- United States
- Market Structure Analysis
- Competition Dashboard
- Competition Benchmarking
- Market Share Analysis of Top Players
- By Regional
- By Product
- By Application
- Emerging Startups
- Innovation Benchmarking
- Competition Analysis
- Competition Deep Dive
- ABB
- Overview
- Product Portfolio
- Profitability by Market Segments
- Sales Footprint
- Strategy Overview
- Marketing Strategy
- Product Strategy
- Channel Strategy
- Schweitzer Engineering Laboratories
- GE Vernova
- Hitachi Energy
- S&C Electric Company
- Siemens
- Beckwith Electric (Hubbell)
- ABB
- Case Studies
- Success Stories
- Recent Developments
- Competition Deep Dive
- Assumptions & Acronyms Used
List of Tables
- Table 1: Global Market Value (USD Billion) Forecast by Region, 2021 to 2036
- Table 2: Global Market Value (USD Billion) Forecast by Product, 2021 to 2036
- Table 3: Global Market Value (USD Billion) Forecast by Application, 2021 to 2036
- Table 4: North America Market Value (USD Billion) Forecast by Country, 2021 to 2036
- Table 5: North America Market Value (USD Billion) Forecast by Product, 2021 to 2036
- Table 6: North America Market Value (USD Billion) Forecast by Application, 2021 to 2036
- Table 7: Europe Market Value (USD Billion) Forecast by Country, 2021 to 2036
- Table 8: Europe Market Value (USD Billion) Forecast by Product, 2021 to 2036
- Table 9: Europe Market Value (USD Billion) Forecast by Application, 2021 to 2036
- Table 10: Asia Pacific Market Value (USD Billion) Forecast by Country, 2021 to 2036
- Table 11: Asia Pacific Market Value (USD Billion) Forecast by Product, 2021 to 2036
- Table 12: Asia Pacific Market Value (USD Billion) Forecast by Application, 2021 to 2036
List of Figures
- Figure 1: Global Market Pricing Analysis
- Figure 2: Global Market Value (USD Billion) Forecast 2021-2036
- Figure 3: Global Market Value Share and BPS Analysis by Product, 2026 and 2036
- Figure 4: Global Market Y-o-Y Growth Comparison by Product, 2026-2036
- Figure 5: Global Market Attractiveness Analysis by Product
- Figure 6: Global Market Value Share and BPS Analysis by Application, 2026 and 2036
- Figure 7: Global Market Y-o-Y Growth Comparison by Application, 2026-2036
- Figure 8: Global Market Attractiveness Analysis by Application
- Figure 9: Global Market Value (USD Billion) Share and BPS Analysis by Region, 2026 and 2036
- Figure 10: Global Market Y-o-Y Growth Comparison by Region, 2026-2036
- Figure 11: Global Market Attractiveness Analysis by Region
- Figure 12: North America Market Incremental Dollar Opportunity, 2026-2036
- Figure 13: Europe Market Incremental Dollar Opportunity, 2026-2036
- Figure 14: Asia Pacific Market Incremental Dollar Opportunity, 2026-2036
- Figure 15: North America Market Value Share and BPS Analysis by Country, 2026 and 2036
- Figure 16: North America Market Value Share and BPS Analysis by Product, 2026 and 2036
- Figure 17: North America Market Y-o-Y Growth Comparison by Product, 2026-2036
- Figure 18: North America Market Attractiveness Analysis by Product
- Figure 19: North America Market Value Share and BPS Analysis by Application, 2026 and 2036
- Figure 20: North America Market Y-o-Y Growth Comparison by Application, 2026-2036
- Figure 21: North America Market Attractiveness Analysis by Application
- Figure 22: Europe Market Value Share and BPS Analysis by Country, 2026 and 2036
- Figure 23: Europe Market Value Share and BPS Analysis by Product, 2026 and 2036
- Figure 24: Europe Market Y-o-Y Growth Comparison by Product, 2026-2036
- Figure 25: Europe Market Attractiveness Analysis by Product
- Figure 26: Europe Market Value Share and BPS Analysis by Application, 2026 and 2036
- Figure 27: Europe Market Y-o-Y Growth Comparison by Application, 2026-2036
- Figure 28: Europe Market Attractiveness Analysis by Application
- Figure 29: Asia Pacific Market Value Share and BPS Analysis by Country, 2026 and 2036
- Figure 30: Asia Pacific Market Value Share and BPS Analysis by Product, 2026 and 2036
- Figure 31: Asia Pacific Market Y-o-Y Growth Comparison by Product, 2026-2036
- Figure 32: Asia Pacific Market Attractiveness Analysis by Product
- Figure 33: Asia Pacific Market Value Share and BPS Analysis by Application, 2026 and 2036
- Figure 34: Asia Pacific Market Y-o-Y Growth Comparison by Application, 2026-2036
- Figure 35: Asia Pacific Market Attractiveness Analysis by Application
- Figure 36: Global Market - Tier Structure Analysis
- Figure 37: Global Market - Company Share Analysis
Frequently Asked Questions
How big is the islanding protection market in 2026?
The Islanding Protection Market is estimated at USD 1.4 billion in 2026, up from USD 1.3 billion in 2025. It is projected to reach USD 3.1 billion by 2036, an 8.1% CAGR from 2026 to 2036.
Which product leads the islanding protection market?
Protection Relays leads with 49.0% of the market in 2026. SEL lists islanding detection on the SEL-751 feeder relay [5]. ABB's REG615 includes voltage vector shift protection that detects islanding [4]. GE Vernova lists frequency rate of change in its Multilin 850 and P40 Agile relays [8][9].
Which other products and applications matter?
Reclosers & Feeder Controllers hold 29.0% by product, and Islanding Detection & Protection Systems hold 22.0%. By application, Solar PV leads at 34.0%, followed by Wind at 20.0%, Battery Energy Storage Systems (BESS) at 15.0%, CHP / Cogeneration at 12.0%, Diesel & Gas Generation at 10.0% and Others at 9.0%. Germany had 71,267 MW of onshore wind and 11,539 MW of offshore wind in September 2026 [20].
Which profiled country is forecast to grow fastest?
India has the highest forecast CAGR of the seven profiled countries, at 11.9% from 2026 to 2036. Australia follows at 11.1%, and China at 9.8%. Ember reports 258 GW of installed renewable capacity in India as of December 2025 [24]. The 2030 target is 500 GW of non-fossil capacity [24].
Which rule changes are affecting buyers?
In Great Britain, G59 Issue 3 Amendment 3 of February 2018 stopped vector shift relays being deemed adequate for plant commissioned after 1 February 2018 [16]. It named rate of change of frequency settings of 1 Hz/s with a 0.5 s delay [16]. In Australia, AS/NZS 4777.2:2020 Amd 2:2024 came into effect on 23 August 2025 [19]. In the United States, IEEE 1547-2018 has an amendment, 1547a-2020, and a revision is in development [1].
What should a buyer check when choosing an islanding protection supplier?
Check which interconnection rule and edition the device supports, then which detection functions it offers and how they are combined. ABB's REG615 pairs vector shift with frequency and voltage based protection [4]. Its typical vector shift operate time is 53 ms at 50 Hz [4]. IEC 62116 covers testing of islanding prevention in PV inverters [2]. Confirm how inverter protection and the relay or recloser control divide the duty at the site.
Preview the report firsthand - request a free sample
Get SampleGet the brochure for pricing and purchase details.
Get PDF
