The Japan microturbines demand is valued at USD 4.2 million in 2025 and is forecasted to reach USD 9.1 million by 2035, reflecting a CAGR of 8.1%. Growth is driven by increased adoption of distributed power systems, demand for stable backup generation, and broader utilisation of combined heat and power units in commercial and small industrial facilities. End-users prioritise equipment with lower maintenance needs, high fuel flexibility, and improved operational reliability. Ongoing interest in compact generation units for remote facilities, wastewater plants, and buildings with constrained grid connectivity also contributes to uptake. Energy-efficiency targets and continued modernisation of small-scale power infrastructure support investment.
The 50-250 kW segment leads the power-rating landscape. Units in this range are widely selected for mid-sized commercial buildings, municipal facilities, and industrial sites requiring continuous output with controlled operating costs. Their compatibility with natural gas, biogas, and other cleaner fuels enhances deployment across decentralised energy systems. Improvements in turbine efficiency, thermal recovery capability, and emissions performance continue to influence procurement choices.

Kyushu & Okinawa, Kanto, and Kinki record the highest utilisation levels due to a concentration of commercial facilities, industrial clusters, and regional initiatives promoting energy-efficient generation. These regions also maintain established service networks for small-scale turbine maintenance and installation. Key suppliers include NewEnCo, Ansaldo Energia S.p.A, FlexEnergy, NewEnCo Ltd., and Elliot Company Inc, which provide microturbine systems used in cogeneration, standby power, and distributed-energy applications.
Breakpoint analysis indicates two structural shifts across the forecast period. The first breakpoint is likely to occur between 2026 and 2028, when early adopters in industrial facilities, small commercial buildings, and remote-site operators expand interest in compact, low-maintenance power units. During this phase, procurement increases as users integrate microturbines into combined heat and power systems to stabilise energy costs and improve operational resilience. This creates a clear early uplift anchored in efficiency-driven upgrades.
A second breakpoint emerges between 2030 and 2032 as deployment patterns transition from early experimentation to more standardised operational use. By this time, facilities with high thermal-energy utilisation will have incorporated microturbines into baseline energy strategies, and growth becomes tied to routine replacement cycles, incremental improvements in turbine efficiency, and broader compatibility with biogas and low-carbon fuels. Late-period expansion reflects stable demand rather than rapid acceleration, shaped by predictable use in distributed-generation projects and small-scale industrial applications. The breakpoint pattern therefore shows an early phase driven by system integration and a later phase defined by steady, utilisation-based growth across Japan’s decentralised-energy landscape.
| Metric | Value |
|---|---|
| Japan Microturbines Sales Value (2025) | USD 4.2 million |
| Japan Microturbines Forecast Value (2035) | USD 9.1 million |
| Japan Microturbines Forecast CAGR (2025-2035) | 8.1% |
Demand for microturbines in Japan is increasing because industries and commercial facilities are exploring distributed energy systems that offer high reliability, zero-emission potential and modular power generation. Microturbines provide compact design and flexible fuel use, which makes them suitable for remote sites, industrial parks and environments with stringent space constraints. The push toward energy efficiency, renewable integration and disaster-resilient infrastructure in Japan motivates adoption of these systems.
Technological improvements in microturbine efficiency, maintenance intervals and control systems support broader interest from Japanese buyers. Constraints include high initial capital cost, limited track record of microturbines in some application segments in Japan and the need for specialised servicing and parts. Regulatory and grid-connection requirements may pose hurdles in certain regions, and some project developers may await clearer economic payback or incentive availability before procurement.
Demand for microturbines in Japan reflects growing adoption of compact distributed-generation systems used for home energy security, industrial backup capability, and commercial operations seeking stable onsite power. Power-rating preferences relate to output needs, efficiency considerations, and integration with combined heat-and-power systems used across Japanese buildings. Application patterns highlight reliance on microturbines for standby and emergency power where grid stability or resilience is a priority. End-user distribution shows how households, industrial facilities, and commercial users integrate microturbines within energy-management routines shaped by load requirements and operating conditions.
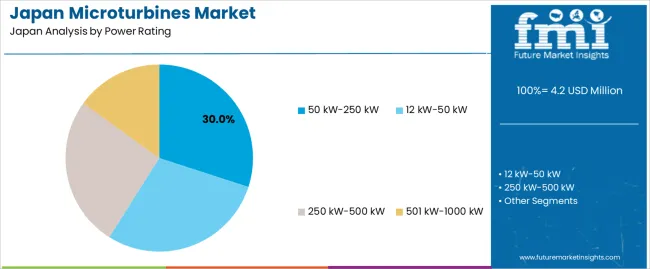
Microturbines rated 50-250 kW hold 30.0% of national demand and represent the leading power-rating category. These units support small industrial facilities, commercial buildings, and large residential complexes requiring moderate electrical output and recoverable thermal energy. Other rating categories 12-50 kW, 250-500 kW, and 501-1000 kW do not have specified shares but serve defined roles across different site requirements. Lower-rating units support individual homes and small commercial spaces, while higher-rating systems serve continuous-use environments and heavier loads. Power-rating distribution reflects energy-use intensity, building size, and efficiency targets across Japanese users selecting microturbines for stable, decentralised operation.
Key drivers and attributes:
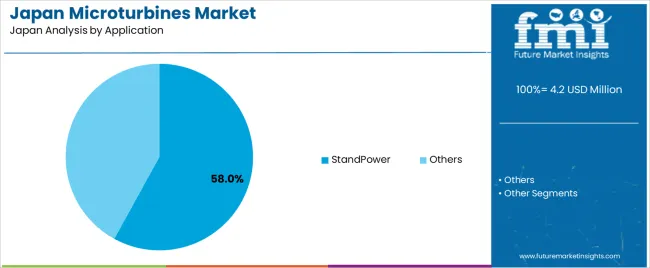
Standby-power use holds 58.0% of national demand and represents the dominant application category. Users adopt microturbines to support emergency power, mitigate outage risk, and stabilise operations during grid disturbances. These systems also assist in maintaining essential services in commercial and industrial settings. Other applications account for 42.0%, covering continuous onsite generation, heat-recovery integration, and supplemental power configurations used in energy-efficient building systems. Application distribution reflects energy-resilience requirements, cost-control priorities, and operational continuity across Japanese facilities adopting microturbines to improve reliability.
Key drivers and attributes:
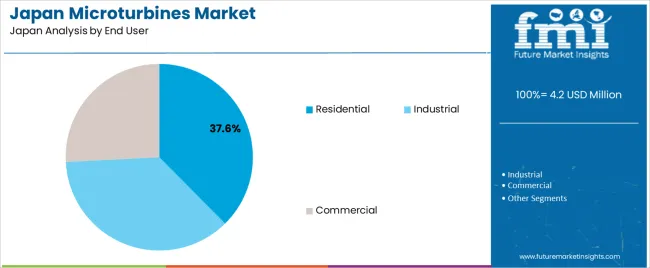
Residential users hold 37.6% of national demand and represent the leading end-user category. Homeowners adopt microturbines for backup capacity, combined heat-and-power systems, and stable supply during outages or peak-demand periods. Industrial users account for 36.6%, integrating microturbines into facilities requiring consistent onsite generation and thermal-energy utilisation. Commercial users represent 25.8%, including offices, retail buildings, and service facilities seeking improved power quality and reduced operational interruptions. End-user distribution reflects building size, energy-load characteristics, and the need for decentralised solutions across Japanese settings prioritising reliability and operating efficiency.
Key drivers and attributes:
Increased interest in distributed energy systems, growth in industrial backup power and focus on on-site generation efficiency are driving demand.
In Japan, demand for microturbines is rising as commercial and industrial facilities look to enhance energy resilience, reduce dependency on central grid supply and manage rising electricity costs. Microturbines are suitable for combined heat and power applications, small-scale cogeneration and distributed energy systems in manufacturing plants, data centres or island communities. Japan’s commitment to improving energy efficiency and supporting renewable integration encourages deployment of compact turbine systems that provide both electricity and usable thermal energy in compact onsite installations.
High upfront investment, limited awareness of full lifecycle benefit and competition from other generation technologies restrain uptake.
Microturbine systems require significant capital outlay for equipment, installation, fuel line connections and controls, which may deter smaller sites or those with uncertain utilisation. Many users may be more familiar with traditional diesel generators or gas engines and hesitate to adopt newer turbine technology without clearly demonstrated payback. Competing technologies such as battery storage, fuel cells or medium-sized gas engines may offer more familiar pathways to onsite generation, which limits the immediate growth of microturbines in some sectors.
Trend toward biogas and hydrogen-fuel capable microturbines, increasing use in microgrid and remote-site applications and stronger interest from commercial and industrial sectors define industry direction.
Suppliers are introducing microturbine models designed to operate on biogas, landfill gas or hydrogen blends to meet Japan’s goals for decarbonisation and renewable heat generation. Use in microgrid systems and remote or island installations is gaining traction since microturbines offer compact, low-maintenance power generation where grid access is limited. Industrial and commercial end-users such as manufacturing campuses and hospital complexes are increasingly considering microturbines for onsite generation combined with thermal recovery to improve energy efficiency and cost control. These developments point to moderate but growing demand for microturbine systems in Japan.

Demand for microturbines in Japan is increasing through 2035 as facilities adopt compact turbine systems for combined heat and power (CHP), on-site electricity generation, and resilient backup power. Microturbines support stable thermal output, low emissions, and reduced maintenance compared with conventional engines, making them suitable for hospitals, commercial buildings, small industrial plants, wastewater facilities, and district-energy networks. Growth is reinforced by energy-efficiency policies, aging-grid concerns, and the need for stable power in both urban and regional settings. Adoption varies with industrial density, infrastructure modernization, and local clean-energy initiatives. Kyushu & Okinawa leads with 10.1%, followed by Kanto (9.3%), Kinki (8.2%), Chubu (7.2%), Tohoku (6.3%), and the Rest of Japan (6.0%).
| Region | CAGR (2025-2035) |
|---|---|
| Kyushu & Okinawa | 10.1% |
| Kanto | 9.3% |
| Kinki | 8.2% |
| Chubu | 7.2% |
| Tohoku | 6.3% |
| Rest of Japan | 6.0% |
Kyushu & Okinawa grows at 10.1% CAGR, supported by strong industrial diversification, widespread use of distributed-energy systems, and rising adoption of CHP units across Fukuoka, Kumamoto, Nagasaki, and Okinawa. Small and mid-scale manufacturers integrate microturbines to secure stable power for processing operations. Hotels, hospitals, and commercial complexes adopt microturbine-based CHP systems to improve energy efficiency and reduce operational risks during peak-demand months. Wastewater-treatment plants deploy microturbines fueled by biogas generated on-site, enabling lower emissions and continuous operation. Remote and island facilities favor microturbines for reliable fuel-flexible generation where grid stability varies.
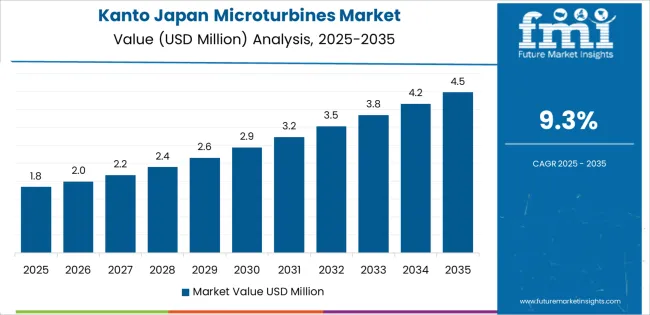
Kanto grows at 9.3% CAGR, driven by high electricity demand, dense commercial infrastructure, and growing interest in energy-resilience solutions across Tokyo, Kanagawa, Saitama, and Chiba. Office buildings and mixed-use developments adopt CHP systems to manage energy costs and improve resilience during grid disturbances. Hospitals and medical centers rely on microturbines for stable backup heat and power. Data-center expansions across Greater Tokyo create demand for microturbine-assisted cooling and backup electricity. Municipal facilities integrate microturbines into district-energy networks to support emission-reduction objectives.
Kinki grows at 8.2% CAGR, supported by commercial-sector expansion, manufacturing activity, and modernized building infrastructure across Osaka, Kyoto, Hyogo, and Nara. Retail complexes and hospitality facilities adopt microturbine-driven CHP systems for predictable heating and cooling performance. Mid-scale manufacturers integrate microturbines to strengthen power reliability and manage cost volatility. Research institutes and universities in the region pilot microturbine systems using hydrogen-enriched fuel blends, supporting long-term adaptation to low-carbon energy strategies.
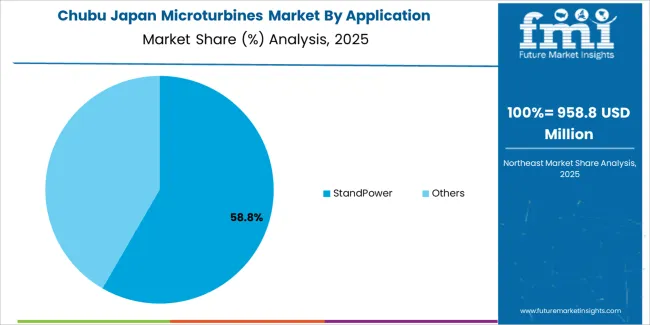
Chubu grows at 7.2% CAGR, influenced by industrial clusters, transportation infrastructure, and strong adoption of energy-efficiency systems across Aichi, Shizuoka, and Gifu. Automotive-component producers deploy microturbines to stabilize thermal and electrical loads in process lines. Airports and transportation hubs integrate microturbines for backup power and building-energy support. Public institutions adopt CHP installations to reduce dependence on aging grid systems. Regional wastewater plants expand biogas-based microturbine usage to improve energy recovery.
Tohoku grows at 6.3% CAGR, supported by disaster-resilience planning, cold-climate energy requirements, and industrial-facility modernization across Miyagi, Iwate, Aomori, and Akita. Municipal facilities adopt microturbines to maintain heat and power during emergency conditions. Food-processing plants integrate microturbines for reliable thermal output needed for continuous operations. District-heating networks in colder prefectures deploy microturbines to improve efficiency. Research on rural energy systems strengthens interest in distributed microturbine installations.
The Rest of Japan grows at 6.0% CAGR, shaped by steady demand from small industrial plants, regional hospitals, public buildings, and localized CHP deployments. Smaller manufacturers adopt microturbines to enhance power stability for production lines. Healthcare facilities integrate systems to secure dependable thermal and electrical supply. Local governments expand microturbine-based energy centers to meet efficiency targets. Gradual upgrades of aging public buildings increase reliance on distributed-generation systems.
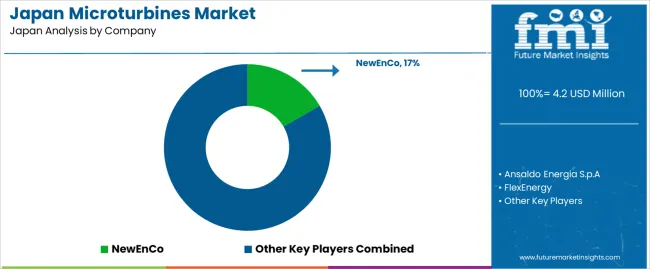
Demand for microturbines in Japan is shaped by a focused group of distributed-energy suppliers supporting commercial buildings, factories, wastewater facilities, and regional power-reliability projects. NewEnCo holds the leading position with an estimated 16.7% share, supported by controlled turbine-module engineering, consistent part-load efficiency, and dependable performance in combined-heat-and-power installations. Its position is reinforced by predictable thermal-recovery behaviour and reliable operation across Japan’s mixed-climate regions.
Ansaldo Energia S.p.A. and FlexEnergy follow as significant participants. Ansaldo supplies microturbine units designed for continuous-duty applications requiring stable electrical output and controlled emissions. FlexEnergy contributes systems capable of handling low-BTU and biogas streams, offering steady performance for industrial sites and municipal facilities with variable fuel characteristics.
NewEnCo Ltd. extends the group’s presence through compact systems suited to smaller buildings and modular deployment scenarios where footprint constraints and efficiency stability are essential. Elliot Company Inc maintains a role through durable turbomachinery adapted for small-scale generation, emphasizing reliable mechanical stability and predictable output under varying load profiles.
Competition across this segment centres on fuel flexibility, thermal-electric efficiency, emissions control, mechanical durability, integration with heat-recovery systems, and long-cycle operational stability. Demand continues to grow as Japanese operators seek reliable onsite generation, support energy-resilience goals, and adopt systems that provide steady output using natural gas, biogas, and other opportunity fuels across commercial and industrial environments.
| Items | Values |
|---|---|
| Quantitative Units | USD million |
| Power Rating | 50 kW-250 kW, 12 kW-50 kW, 250 kW-500 kW, 501 kW-1000 kW |
| Application | StandPower, Others |
| End User | Residential, Industrial, Commercial |
| Regions Covered | Kyushu & Okinawa, Kanto, Kinki, Chubu, Tohoku, Rest of Japan |
| Key Companies Profiled | NewEnCo, Ansaldo Energia S.p.A, FlexEnergy, NewEnCo Ltd., Elliot Company Inc |
| Additional Attributes | Dollar sales by power rating, application, and end-user segments; regional adoption trends across Kyushu & Okinawa, Kanto, Kinki, Chubu, Tohoku, and Rest of Japan; competitive landscape of microturbine manufacturers; integration with distributed energy systems, combined heat and power (CHP) solutions, emergency generation, and small-scale industrial operations across Japan. |
The demand for microturbines in japan is estimated to be valued at USD 4.2 million in 2025.
The market size for the microturbines in japan is projected to reach USD 9.1 million by 2035.
The demand for microturbines in japan is expected to grow at a 8.1% CAGR between 2025 and 2035.
The key product types in microturbines in japan are 50 kw-250 kw, 12 kw-50 kw, 250 kw-500 kw and 501 kw-1000 kw.
In terms of application, standpower segment is expected to command 58.0% share in the microturbines in japan in 2025.


Our Research Products

The "Full Research Suite" delivers actionable market intel, deep dives on markets or technologies, so clients act faster, cut risk, and unlock growth.

The Leaderboard benchmarks and ranks top vendors, classifying them as Established Leaders, Leading Challengers, or Disruptors & Challengers.

Locates where complements amplify value and substitutes erode it, forecasting net impact by horizon

We deliver granular, decision-grade intel: market sizing, 5-year forecasts, pricing, adoption, usage, revenue, and operational KPIs—plus competitor tracking, regulation, and value chains—across 60 countries broadly.

Spot the shifts before they hit your P&L. We track inflection points, adoption curves, pricing moves, and ecosystem plays to show where demand is heading, why it is changing, and what to do next across high-growth markets and disruptive tech

Real-time reads of user behavior. We track shifting priorities, perceptions of today’s and next-gen services, and provider experience, then pace how fast tech moves from trial to adoption, blending buyer, consumer, and channel inputs with social signals (#WhySwitch, #UX).

Partner with our analyst team to build a custom report designed around your business priorities. From analysing market trends to assessing competitors or crafting bespoke datasets, we tailor insights to your needs.
Supplier Intelligence
Discovery & Profiling
Capacity & Footprint
Performance & Risk
Compliance & Governance
Commercial Readiness
Who Supplies Whom
Scorecards & Shortlists
Playbooks & Docs
Category Intelligence
Definition & Scope
Demand & Use Cases
Cost Drivers
Market Structure
Supply Chain Map
Trade & Policy
Operating Norms
Deliverables
Buyer Intelligence
Account Basics
Spend & Scope
Procurement Model
Vendor Requirements
Terms & Policies
Entry Strategy
Pain Points & Triggers
Outputs
Pricing Analysis
Benchmarks
Trends
Should-Cost
Indexation
Landed Cost
Commercial Terms
Deliverables
Brand Analysis
Positioning & Value Prop
Share & Presence
Customer Evidence
Go-to-Market
Digital & Reputation
Compliance & Trust
KPIs & Gaps
Outputs
Full Research Suite comprises of:
Market outlook & trends analysis
Interviews & case studies
Strategic recommendations
Vendor profiles & capabilities analysis
5-year forecasts
8 regions and 60+ country-level data splits
Market segment data splits
12 months of continuous data updates
DELIVERED AS:
PDF EXCEL ONLINE
Japan Faith-based Tourism Market Size and Share Forecast Outlook 2025 to 2035
Japan Sports Tourism Market Size and Share Forecast Outlook 2025 to 2035
Japan Respiratory Inhaler Devices Market Size and Share Forecast Outlook 2025 to 2035
Japan Halal Tourism Market Size and Share Forecast Outlook 2025 to 2035
Japan Automated People Mover Industry Size and Share Forecast Outlook 2025 to 2035
Japan Automotive Load Floor Industry Analysis Size and Share Forecast Outlook 2025 to 2035
Japan Food Cling Film Market Size and Share Forecast Outlook 2025 to 2035
Japan Polypropylene Packaging Films Market Size and Share Forecast Outlook 2025 to 2035
Japan Probiotic Yogurt Market is segmented by product type, source type, nature type, flavor type, fat content, sales channel and key city/province through 2025 to 2035.
japan Tortilla Market - Growth, Trends and Forecast from 2025 to 2035
Japan Cosmetics ODM Market Analysis - Size, Share & Trends 2025 to 2035
Japan Automotive Turbocharger Market Insights – Demand, Size & Industry Trends 2025–2035
Japan Yeast Market Insights – Demand, Size & Industry Trends 2025–2035
Japan Green and Bio-based Polyol Market Insights – Demand, Size & Industry Trends 2025–2035
Japan Natural Food Color Market Trends – Growth, Demand & Forecast 2025–2035
Japan Coated Fabrics Market Growth – Trends, Demand & Innovations 2025–2035
Japan Barite Market Growth – Trends, Demand & Innovations 2025–2035
Japan 1,4-Diisopropylbenzene Market Growth – Trends, Demand & Innovations 2025–2035
Japan Compact Construction Equipment Market Insights – Demand, Size & Industry Trends 2025–2035
Social Employee Recognition System Market in Japan - Growth & Forecast 2025 to 2035

Thank you!
You will receive an email from our Business Development Manager. Please be sure to check your SPAM/JUNK folder too.
Chat With
MaRIA