
- Market Size (2026)
- USD 257.0 Mn
- Forecast (2036)
- USD 570.4 Mn
- CAGR (2026 to 2036)
- 8.3%
How Big Is the Kale Chips Market in 2026?
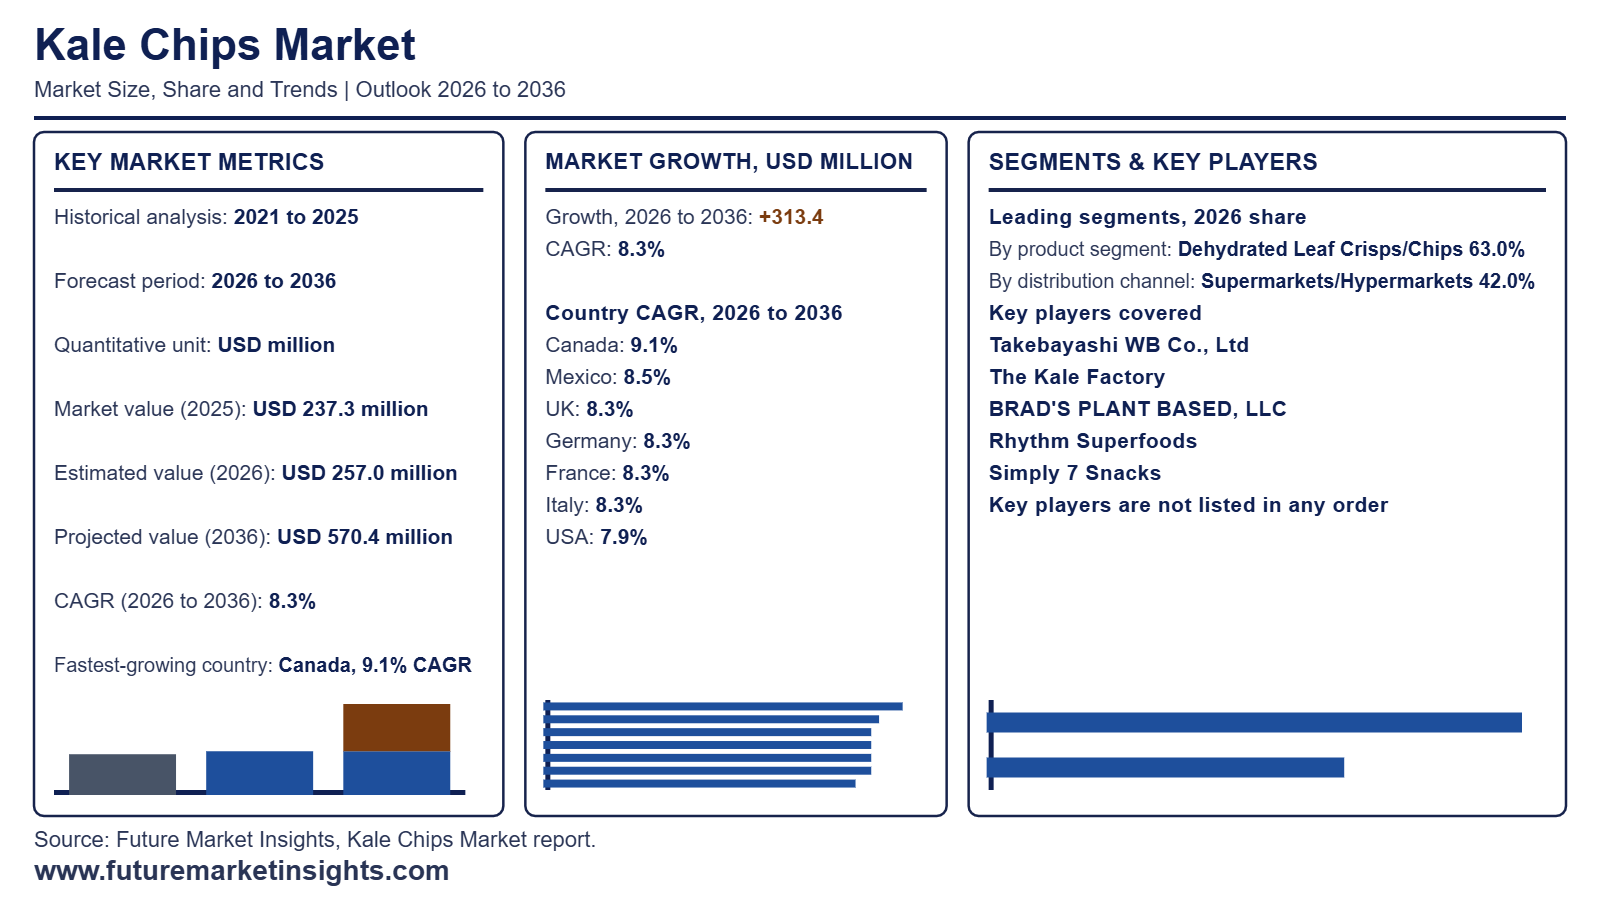
Registering a value of USD 237.3 million in 2025, the global kale chips market expanded to USD 257.0 million in 2026 and is anticipated to achieve USD 570.4 million by 2036, driven by an 8.3% CAGR.
| Market Metric | Valuation / Share / Forecast Benchmark |
|---|---|
| 2025 Market Size (Historical) | USD 237.3 million |
| 2026 Market Size (Estimated) | USD 257.0 million |
| 2036 Market Size (Projected) | USD 570.4 million |
| Compound Annual Growth Rate (2026 to 2036) | 8.3% CAGR |
| Incremental Dollar Opportunity (2026 to 2036) | USD 313.4 million |
| Dominant Product Segment (2026 Share) | Dehydrated Leaf Crisps/Chips (63.0% share in 2026) | Other Segment Combined (37.0%) |
| Leading Distribution Channel (2026 Share) | Supermarkets/Hypermarkets (42.0% share in 2026) | Other Segment Combined (58.0%) |
| Secondary Product Pathway (2026 Share) | Extruded Chips (37.0% share in 2026) | Other Segment Combined (63.0%) |
| Leading Regional Market | North America (led by USA at 7.9% CAGR) |
| Fastest-Growing Country Markets (2026 to 2036) | Canada (9.1% CAGR), Mexico (8.5% CAGR), UK (8.3% CAGR) |
| Leading Tier-1 Companies | Takebayashi WB Co., Ltd, The Kale Factory, BRAD'S PLANT BASED, LLC, Rhythm Superfoods, Simply 7 Snacks |
Source: Future Market Insights analysis of the kale chips market, 2026.
This Report Answers
- How large the kale chips market is in 2026 and what it reaches by 2036
- Which product, distribution channel and secondary product pathway segments lead in 2026
- What is driving demand and what is holding the category back
- Which countries grow fastest between 2026 and 2036
- What Takebayashi WB Co. and other leading players have launched
- How the kale chips market is defined, segmented and measured
Executive Market Overview
Global kale chips market valuation reached USD 257.0 million in 2026, advancing from USD 237.3 million in 2025, and is projected to attain USD 570.4 million by 2036 at an 8.3% CAGR, generating USD 313.4 million in incremental revenue over the forecast decade. FMI's analysis indicates that buyer adoption is expanding as grocery shoppers substitute fried potato crisps with nutrient-dense brassica snacks positioned in veggie chips and healthy snacks bays. Experimental food-processing research indexed in PubMed (July 2026) confirms that blanched dried kale leaves retain 524 to 618 mg GAE/100 g dry-matter polyphenols, representing 6.8% to 12.4% higher antioxidant retention than unblanched leaves when dried to a shelf-stable water activity below 0.6. Processors that preserve leaf crispness and cashew- or tahini-seasoned flavor profiles secure stronger household reorder rates through 2036.
National food-labeling mandates and raw-material contaminant controls create distinct operating requirements across key retail markets. FMI believes retail category managers now prioritize agricultural soil traceability with front-of-package sodium compliance before expanding shelf facings for dehydrated vegetables and leafy snacks. On May 19, 2026, the California Department of Public Health (May 2026) issued a state consumer advisory after retail laboratory testing in Sacramento identified elevated thallium levels across multiple commercial kale-chip varieties. Market sizing covers packaged finished kale chips sold across dehydrated whole-leaf and extruded or formed snack formats, while excluding fresh raw kale, unseasoned bulk vegetable powders, and restaurant-prepared dishes.
Analyst Perspective
"Kale chip brands will capture sustainable supermarket velocity only when they pair low-temperature leaf dehydration with verified soil-contaminant screening and nitrogen-flushed barrier pouches. The decisive commercial risk is batch delisting triggered by brassica heavy-metal concentration or front-of-package sodium warning symbols.",
- Nandini Roy Choudhury, Principal Consultant, Future Market Insights (FMI)
Key Market Trends & Insights
- Low-Temperature Vacuum Dehydration Preserves Fragile Leaf Micronutrients: Snack processors transition away from high-heat baking toward controlled air-drying and vacuum dehydration to protect chlorophyll and vitamin retention K while preventing scorching.
- Clean-Label Yeast and Botanical Seasonings Replace Synthetic Powders: Leading savory snack formulators use nutritional yeast, cold-pressed seed oils, and garlic powders to deliver umami flavor without synthetic additives or excess sodium.
- Multi-Bag Club Packs and School-Compliant Packaging Expand Family Grocery Volume: Mainstream supermarkets and wholesale warehouse clubs expand multi-pack snack assortments offering verified allergen-free, peanut-free certifications for school lunches.
What Are the Main Drivers, Restraints, and Opportunities?
Growing demand for whole-food vegetable snacks and stringent raw material quality controls define global kale chips market dynamics.
Driver: Consumer Preference for Whole-Vegetable Nutrient-Dense Savory Snacks
Core demand driver centers on consumer preference for savory snacks made from recognizable dark-green leafy vegetables rather than refined starches. FMI finds that commercial snack processors are contracting dedicated domestic and regional brassica harvests, similar to supply models in Korea dehydrated vegetables, to secure uniform curly kale leaves for year-round dehydration lines. Federal agricultural benchmarking in the USDA National Agricultural Statistics Service (January 2026) Crop Production 2025 Summary released on January 12, 2026 tracks commercial U.S. kale and specialty vegetable harvest schedules that supply domestic fresh-cut and dehydrated snack processors. Brands that pair traceable organic kale leaves with nut-free or seed-based savory coatings convert health-conscious trial buyers into recurring grocery shoppers.
Restraint: Heavy-Metal Soil Bioaccumulation and Post-Harvest Leaf Breakage
Primary operational restraints stem from raw-material heavy-metal bioaccumulation during dehydration with leaf fragility in transit. Because brassica crops naturally uptake trace elements from sulfur-rich soils, removing water during chip dehydration concentrates soil-derived metals in the finished snack and forces strict incoming lot screening across clean label ingredients. Peer-reviewed toxicological research published in MDPI International Journal of Environmental Research and Public Health (August 2025) on August 7, 2025 documented clinical thallium exposure linked to commercial kale-chip consumption and cited FDA survey findings showing fresh kale carried thallium concentrations up to 0.29 mg/kg, the highest among surveyed foods. Consequently, grocery chains now demand inductively coupled plasma mass spectrometry (ICP-MS) heavy-metal certificates for every dehydrated kale lot prior to distribution.
Opportunity: School-Safe Multipacks and Cold-Pressed Seed Oil Glazes
A compelling commercial opportunity lies in engineering low-sodium, nutrient-dense kale crisps reinforced with natural flavours that qualify for updated front-of-package health claims and school-approved snack distribution. FMI projects brands that keep sodium and saturated fat from seed dressings below statutory thresholds will gain preferential end-cap placement as retailers reset snack aisles. Under the updated nutrient-content regulation issued by the U.S. Food and Drug Administration (December 2024) and enforced across 2025 and 2026 compliance cycles, packaged foods bearing the federal "Healthy" claim must provide a meaningful food-group equivalent, such as vegetables, while adhering to strict upper limits on added sugars, saturated fat, and sodium. Formulators combining compliant nutrient panels with nitrogen-flushed barrier pouches will capture higher retail replenishment through 2036.
How Is the Kale Chips Market Segmented?
Segmentation analysis examines Product and Distribution Channel axes across primary retail and foodservice channels.
| Segmentation Axis | Sub-Segments Covered | 2026 Leading Segment & Share | Other Segment Combined & Total |
|---|---|---|---|
| Product | Dehydrated Leaf Crisps/Chips, Extruded Chips | Dehydrated Leaf Crisps/Chips (63.0% share in 2026) | Other Segment Combined (37.0%) | Total (100.0%) |
| Distribution Channel | Supermarkets/Hypermarkets, Online/Specialty Stores | Supermarkets/Hypermarkets (42.0% share in 2026) | Other Segment Combined (58.0%) | Total (100.0%) |
| Nature | Organic, Conventional | Organic (58.0% share in 2026) | Other Segment Combined (42.0%) | Total (100.0%) |
| Packaging | Pouch, Bag, Canister | Pouch (61.0% share in 2026) | Other Segment Combined (39.0%) | Total (100.0%) |
| Region | North America, Latin America, Western Europe, Eastern Europe, East Asia, South Asia, Middle East and Africa | North America (led by USA at 7.9% CAGR) | Global Coverage Across 7 Core Countries (100.0%) |
Source: Future Market Insights analysis of the kale chips market, 2026.
Why Do Dehydrated Leaf Crisps/Chips Anchor the Product Category?
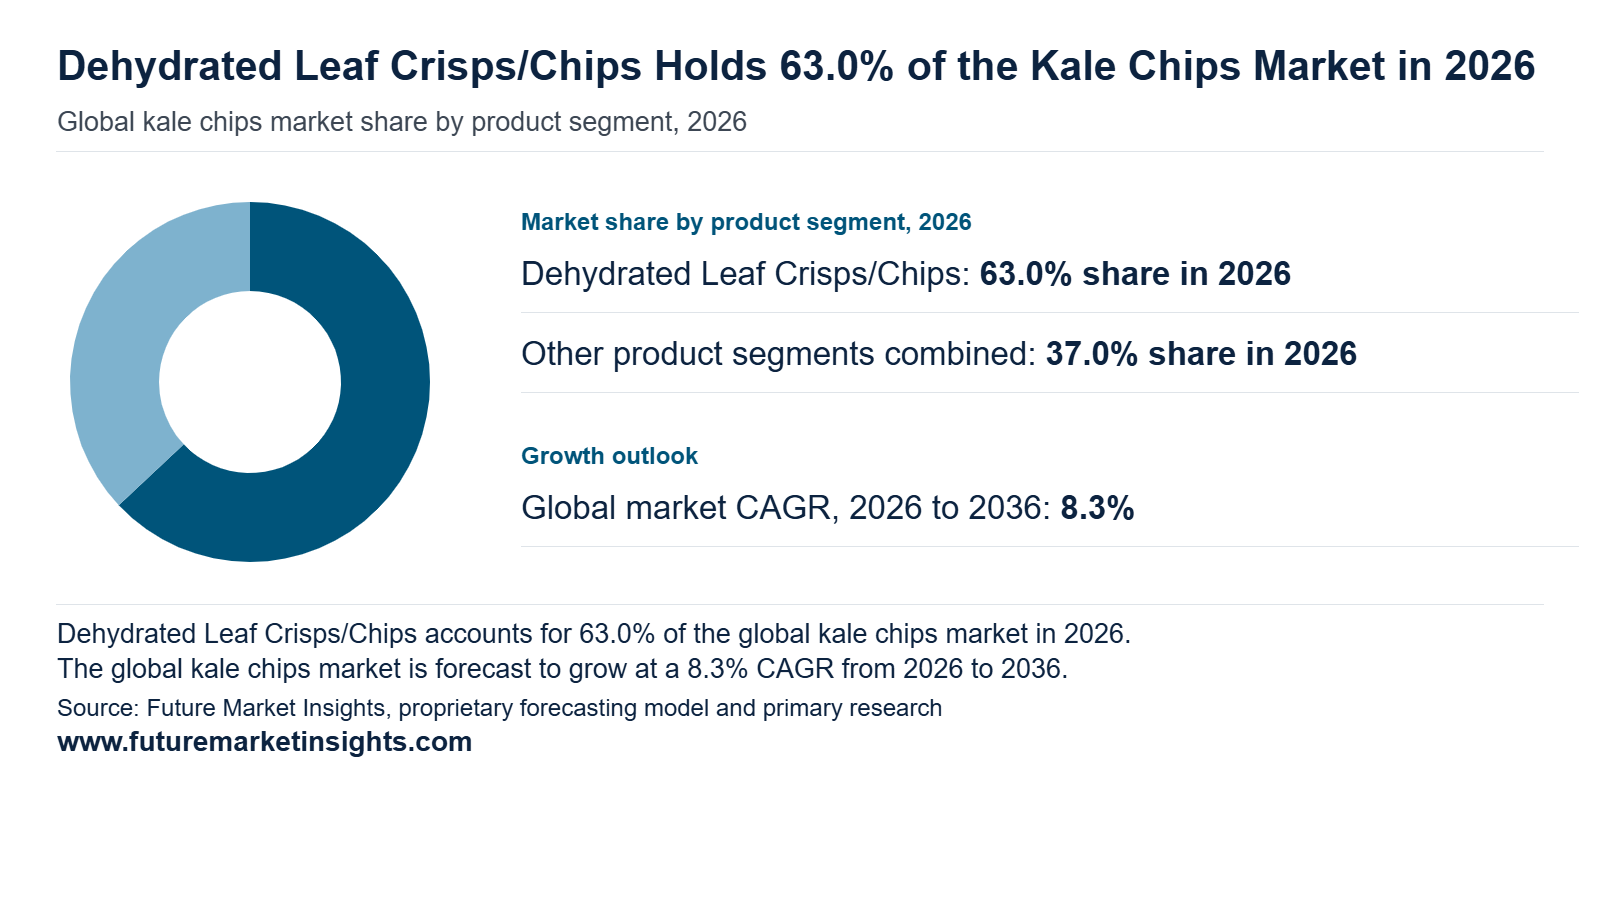
Dehydrated Leaf Crisps/Chips accounts for 63.0% of the Product segment in 2026, where FMI finds that whole curly kale leaves coated with sunflower-seed or dairy-free cheese dressings command premium unit pricing on account of their intact botanical structure and high dietary fiber density. Processors competing across Western Europe dehydrated vegetables and North American natural snack aisles use controlled low-temperature airflow to prevent chlorophyll browning and bitter glucosinolate breakdown. Peer-reviewed drying trials published in MDPI Molecules (July 2026) demonstrate that hybrid convective-infrared-ultrasonic drying at 60 degrees Celsius with 2.0 m/s airflow stabilizes blanched kale leaves in 3.5 hours while retaining 932 mg/100 g dry-matter chlorophyll and 174 mg/100 g carotenoids. Rigid tray inserts and high-barrier films remain vital to prevent leaf shattering through 2036. Drying trials in MDPI Molecules (July 2026) confirmed 932 mg/100 g chlorophyll retention when blanched kale leaves are dried at 60 degrees Celsius for 3.5 hours.
How Do Extruded Chips Expand Secondary Product Format Demand?
Dehydrated Leaf Crisps/Chips lead the Product segment with a 63.0% share in 2026, while extruded chips expand commercial distribution due to uniform ridged geometry, lower breakage during transport, and cost efficiencies over whole-leaf batches. Snack formulators blend dehydrated kale powder with potato starch or pulse flours used across the wider extruded snacks category to create dippable crisps. Shelf-life testing published in MDPI Foods (May 2025) confirmed that baked chips formulated with 10% to category to create dippable crisps. Shelf-life testing published in MDPI Foods (May 2025) confirmed that baked chips formulated with 10.0% to 20.0% kale powder maintained 1.0% moisture content, 3.0% dietary fiber, and microbial counts below 4 log CFU/g over 6 months of storage. Formed kale crisps will continue expanding multipack lunchbox adoption through 2036.
What Sustains Supermarkets/Hypermarkets in Distribution Channel?
Supermarkets/Hypermarkets captures 42.0% of the Distribution Channel segment in 2026. FMI observes that full-line grocery chains lead single-channel volume attributed to dedicated organic and free-from end-cap displays that place kale chips directly beside conventional savory snacks. Mainstream supermarket buyers require consistent case-fill rates, UPC-level scan velocity, and multi-bag promotional pricing to renew annual slotting agreements. Commercial assortment records from Whole Foods Market (June 2026) show national grocery stocking of 4-pack 2.0 oz organic dehydrated kale chip bundles formulated with organic sunflower seeds, tahini, apple cider vinegar, and carrot powder. Brands that maintain sub-threshold sodium levels and damage-resistant stand-up pouches will capture wider supermarket shelf allocations through 2036. Retail assortment listings at Whole Foods Market (June 2026) highlight multi-pack 2.0 oz organic whole-leaf kale chip merchandising across national grocery aisles.
How Do Online and Specialty Channels Support Premium Flavor Discovery?
Supermarkets and Hypermarkets anchor Distribution Channel sales with a 42.0% share in 2026, while direct-to-consumer storefronts and warehouse club grocers remain critical launchpads for keto-certified and probiotic chip varieties with upcycled vegetable snacks. Multi-bag club and online bundles offset parcel shipping costs while allowing households to sample multiple seasonings in one order. Commercial listing data from Costco Canada (May 2026) document direct club and online fulfillment of 12 x 35 g Healthy Crunch Kale Chips variety cases combining dairy-free Say Cheeze! and Cool Cucumber + Dill packs. Subscription case packs will continue driving online repeat orders through 2036. Multi-pack fulfillment by Costco Canada (May 2026) demonstrates how 12 x 35 g variety cases scale online and warehouse-club unit economics.. Multi-bag club and online bundles offset parcel shipping costs while allowing households to sample multiple seasonings in one order. Commercial listing data from Costco Canada (May 2026) document direct club and online fulfillment of 12 x 35 g Healthy Crunch Kale Chips variety cases combining dairy-free Say Cheeze! and Cool Cucumber + Dill packs. Subscription case packs will continue driving online repeat orders through 2036.
Regional & Country Outlook
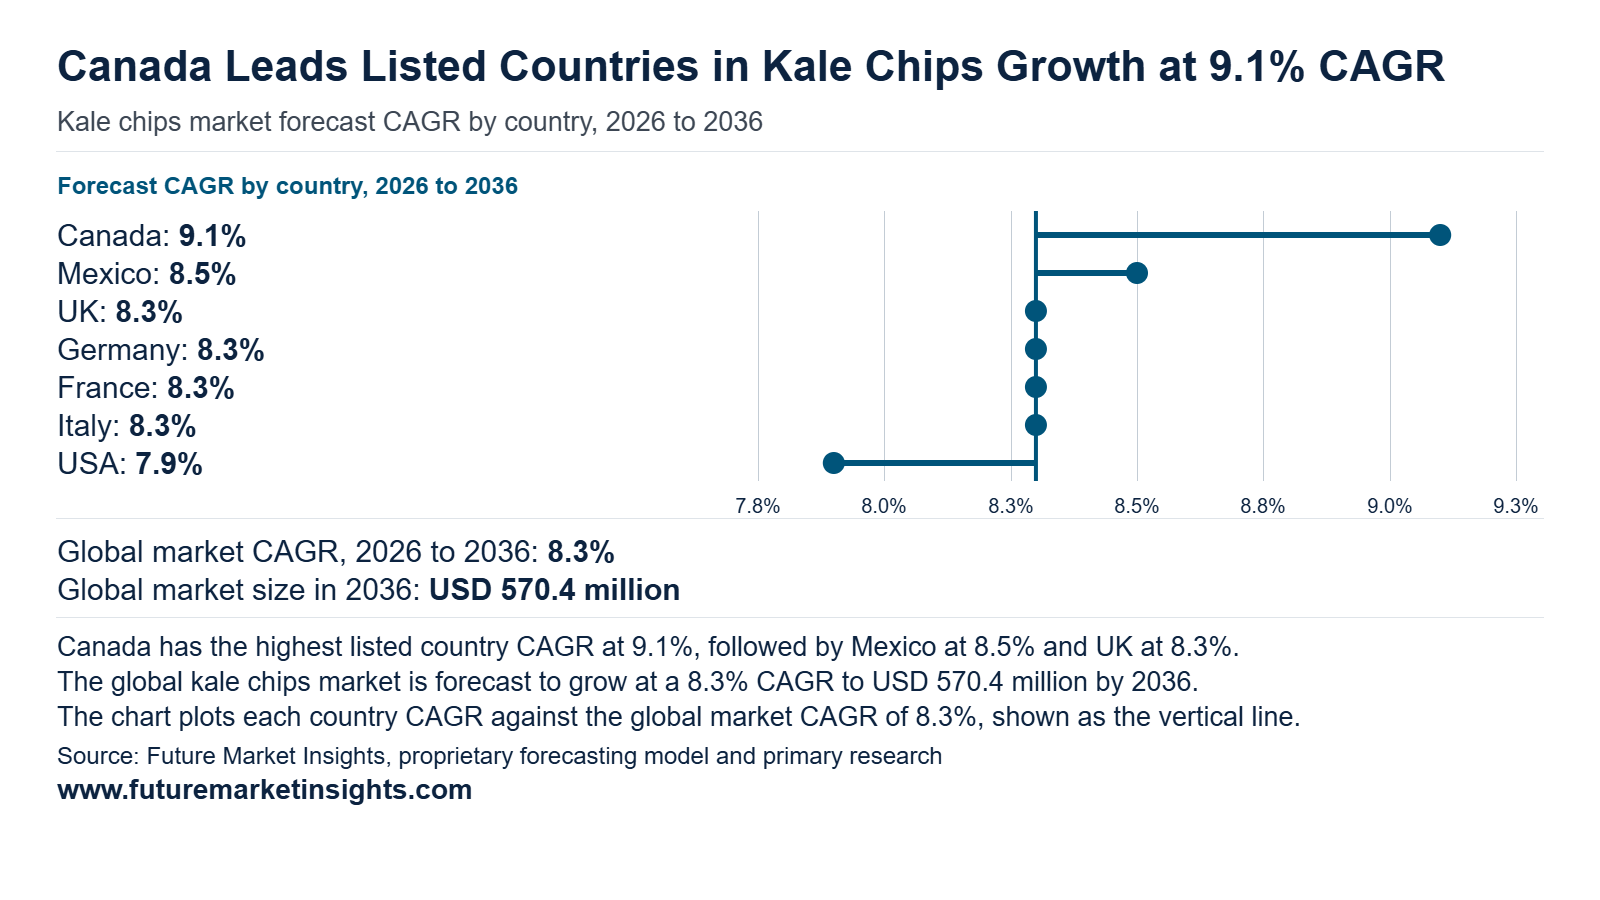
Regional sales are anchored by North America and Western Europe, supported by widespread organic grocery penetration and clean-label snack buying.
| Country | 2026 Revenue | 2036 Revenue | 10-Year Addition | 2026 to 2036 CAGR | Global Share (2026 -> 2036) |
|---|---|---|---|---|---|
| Canada | USD 12.9 million | USD 30.8 million | +USD 17.9 million | 9.1% | 5.0% -> 5.4% |
| Mexico | USD 9.0 million | USD 20.4 million | +USD 11.4 million | 8.5% | 3.5% -> 3.6% |
| UK | USD 19.3 million | USD 42.8 million | +USD 23.5 million | 8.3% | 7.5% -> 7.5% |
| Germany | USD 20.6 million | USD 45.7 million | +USD 25.1 million | 8.3% | 8.0% -> 8.0% |
| France | USD 15.4 million | USD 34.2 million | +USD 18.8 million | 8.3% | 6.0% -> 6.0% |
| Italy | USD 11.6 million | USD 25.7 million | +USD 14.1 million | 8.3% | 4.5% -> 4.5% |
| USA | USD 97.7 million | USD 209.0 million | +USD 111.3 million | 7.9% | 38.0% -> 36.6% |
Source: Future Market Insights analysis of regional kale chips markets, 2026.
Canada
Demand for kale chips in Canada is projected to rise from USD 12.9 million in 2026 to USD 30.8 million by 2036, advancing at a 9.1% CAGR and adding USD 17.9 million in new revenue. Canada is projected to expand at a 9.1% CAGR from 2026 to 2036, driven by mainstream grocery and club-store adoption of allergen-free, school-approved vegetable snacks formulated with specialty food ingredients. FMI finds that Canadian snack processors gain a structural shelf advantage when their seasoning blends stay below federal sodium and saturated fat warning thresholds. According to the compliance and enforcement notice issued by the Canadian Food Inspection Agency (November 2025) on November 17, 2025, prepackaged foods sold in Canada from January 1, 2026 must display a mandatory front-of-package nutrition symbol whenever saturated fat or sodium meet or exceed specified daily value percentages. Domestic and importing brands that maintain symbol-exempt nutrient panels will capture expanding Canadian supermarket and club reorders through 2036.
Mexico
Buyer adoption of kale chips across Mexico is estimated to expand from USD 9.0 million in 2026 to USD 20.4 million by 2036, spurred by an 8.5% CAGR and generating USD 11.4 million in commercial expansion. Mexico is forecast to advance at an 8.5% CAGR over 2026 to 2036, attributed to expanding modern-trade grocery distribution and rising urban demand for plant-based savory snacks. In FMI's view, commercial scale in Mexico requires careful seasoning calibration so dehydrated and extruded kale crisps avoid multiple black octagonal warning seals on retail packs. On July 31, 2025, the Secretaría de Economía and COFEPRIS (July 2025) published an official decree in the Diario Oficial extending the second nutritional-profile phase of NOM-051-SCFI/SSA1-2010 through December 31, 2027, with Phase 3 scheduled for January 1, 2028. Snack manufacturers that use this regulatory window to reduce sodium density and verify clean agricultural origin will secure broader listings across Mexican supermarket and e-commerce channels through 2036.
UK
United Kingdom kale chips industry is set to scale from USD 19.3 million in 2026 to USD 42.8 million by 2036, driven by an 8.3% CAGR and adding USD 23.5 million in incremental market value. UK kale chips market is projected to grow at an 8.3% CAGR between 2026 and 2036, helped by retail promotional rules that favor lower-salt, high-fiber vegetable snacks enriched with botanical ingredients. FMI observes that UK supermarket buyers increasingly evaluate savory crisps against the Department of Health and Social Care nutrient profiling model before allocating digital or end-cap promotional budgets. Under statutory regulations enforced by the Government of the United Kingdom (January 2026) on January 5, 2026, identifiable food and snack products classified as less healthy are barred from paid online advertising and pre-9:00 p.m. television broadcasts, action projected to remove 7.2 billion calories per year from UK children's diets. Kale chip brands engineered below UK salt and fat scoring thresholds will retain full digital marketing flexibility through 2036.
Germany
Sales of kale chips throughout Germany are projected to increase from USD 20.6 million in 2026 to USD 45.7 million by 2036, progressing at an 8.3% CAGR and creating USD 25.1 million in additional revenue. Germany carries an 8.3% CAGR forecast from 2026 to 2036, on account of deep consumer familiarity with certified organic food labels across full-range supermarkets and natural food stores. FMI believes German grocery chains offer a premier European growth corridor for air-dried organic kale crisps, provided suppliers substantiate European Union organic leaf certification and declare cashew or mustard allergens clearly on packs. Industry market analysis presented by the Bund Ökologische Lebensmittelwirtschaft (February 2026) at BIOFACH on February 12, 2026 confirms that mainstream German grocery retailers and drugstores continue to drive national organic food volume expansion as households prioritize certified clean-label staples. Processors offering certified organic, recyclable barrier pouches will sustain strong German retail velocity through 2036.
France
Consumption of kale chips across France is estimated to climb from USD 15.4 million in 2026 to USD 34.2 million by 2036, reflecting an 8.3% CAGR and contributing USD 18.8 million over the forecast decade. France is projected to record an 8.3% CAGR from 2026 to 2036, anchored by supermarket expansion of plant-based aperitif snacks and transparent front-of-pack nutritional grading. FMI's analysis indicates that French hypermarket buyers compare seasoned vegetable crisps directly against conventional potato chips using the updated Nutri-Score calculation, where high sodium or oil-heavy seed coatings can downgrade a snack's letter rating despite its kale base. In its national assessment published on March 19, 2026, Santé publique France (March 2026) documented that the revised Nutri-Score algorithm introduced in March 2025 sharpens nutritional differentiation around salt and dietary fiber content while guiding consumer checkout choices. Manufacturers formulating lightly salted, high-fiber kale crisps with French-language packaging will capture growing hypermarket shelf space through 2036.
Italy
Revenue generated by kale chips suppliers in Italy is forecast to expand from USD 11.6 million in 2026 to USD 25.7 million by 2036, anchored by an 8.3% CAGR and generating USD 14.1 million in new category sales. Italy is forecast to expand at an 8.3% CAGR between 2026 and 2036, fueled by urban aperitivo snacking and health-focused grocery formats across northern and central metropolitan centers. In FMI's assessment, converting Italian trial into repeat household volume requires accessible pack pricing because domestic shoppers remain highly selective toward premium specialty snacks. National household expenditure data released by the Istituto Nazionale di Statistica (October 2026) on October 8, 2026 revealed that 29.4% of Italian households reduced the quantity or quality of food purchases during 2025 to offset grocery price inflation. Consequently, brands introducing cost-effective extruded kale-and-potato multipacks with portion-controlled single-serve whole-leaf pouches will achieve wider supermarket reorder rates across Italy through 2036.
USA
Buyer procurement of kale chips throughout the USA is tracking from USD 97.7 million in 2026 to USD 209.0 million by 2036, exhibiting a 7.9% CAGR and contributing USD 111.3 million to national market value. United States market is projected to grow at a 7.9% CAGR over 2026 to 2036, as a result of established natural-channel distribution and rising demand for plant-based snacks rich in flavonoids and dietary fiber. FMI notes that U.S. retail onboarding now hinges on rigorous heavy-metal lot testing because dehydration concentrates soil-absorbed elements. On November 3, 2026, the U.S. Food and Drug Administration (November 2026) published a voluntary recall by Snack Right Super Foods, Inc. (doing business as Brad's Raw Chips) covering approximately 25,000 bags (2,097 cases) of Brad's Plant Based Crunchy Kale and Veggie Chips Kale distributed via KeHE and UNFI due to potential thallium contamination concentrated when dehydration removes 85% to 90% of leaf water. Suppliers providing verified soil-to-bag ICP-MS testing will secure U.S. grocery growth through 2036.
Competitive Environment and Notable Companies
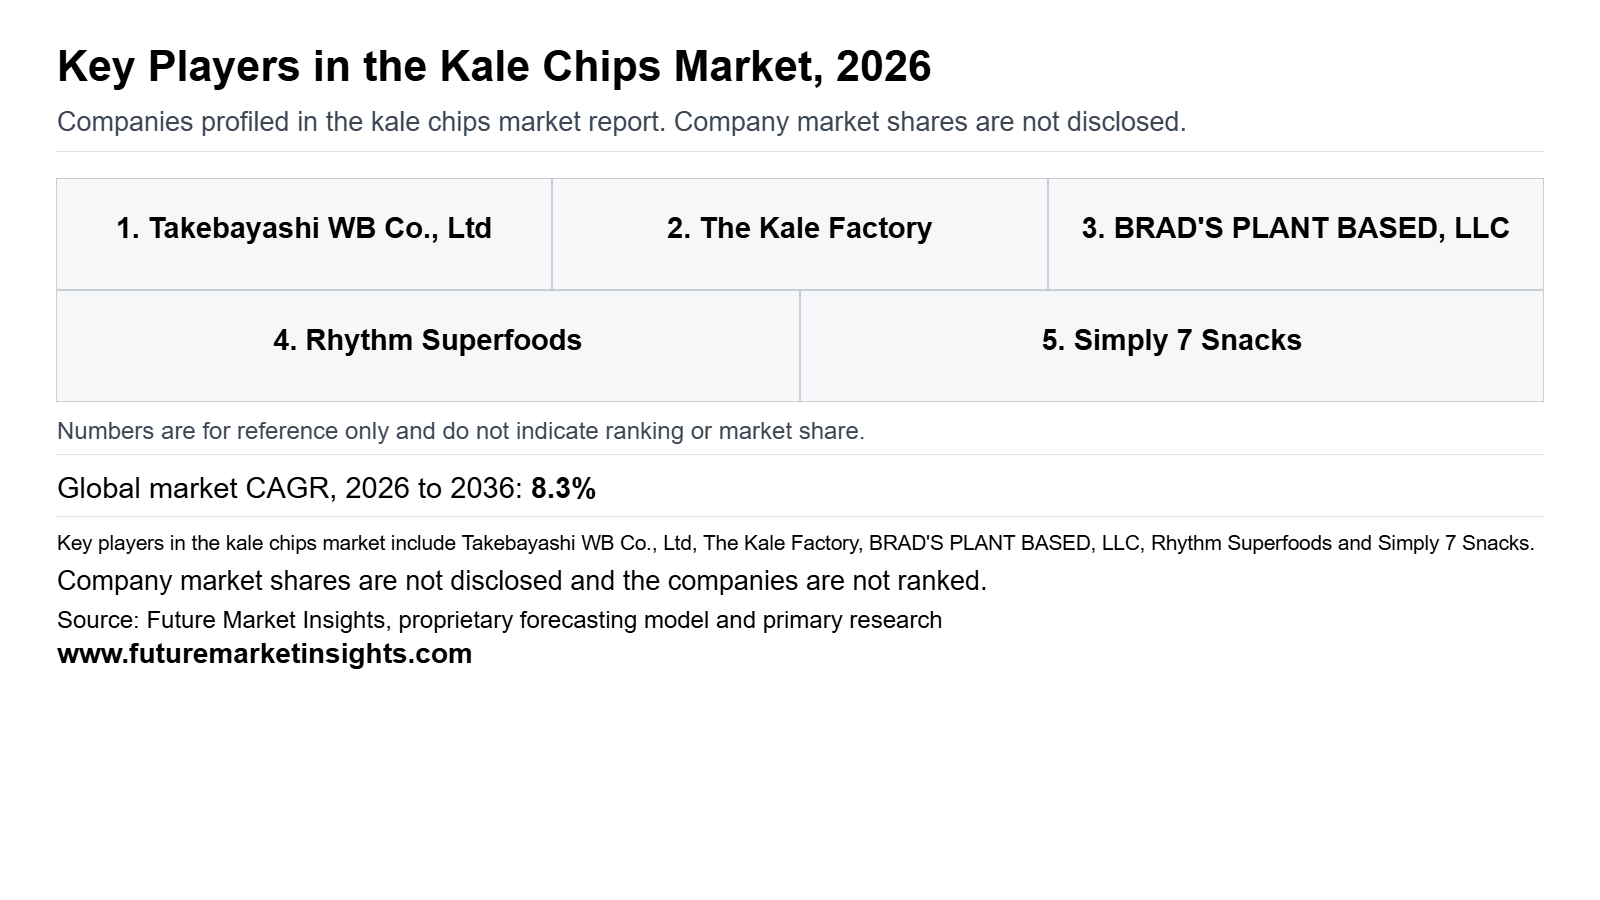
Competitive landscape features specialized organic vegetable crisp producers and diversified savory snack manufacturers.
How Are Companies Positioned in the Kale Chips Market?
Specialized organic dehydrators dominate premium whole-leaf crisps sold in natural food stores, while large snack conglomerates focus on extruded kale blends distributed through mass grocers.
What Matters When a Buyer Selects a Kale Chips Supplier?
Retail buyers prioritize third-party heavy metal assay certificates, low bag-crush rates during transit, verified low-sodium seasoning, and transparent organic grower provenance.
Which Capabilities Distinguish Product Offers?
Manufacturers distinguish product lines through proprietary gentle dehydration that preserves distinctive green leaf color, low oil usage, and allergen-free multi-flavor seasonings.
How Does Geographic Reach Affect Competition?
North American and European producers draw on established regional natural grocery relationships, whereas Asian producers lead in vacuum-freeze dehydration and raw leaf supply.
| Verified Company Evidence (2025 to 2026) | Commercial Effect | Buyer Action |
|---|---|---|
| May 2026: Costco Canada expanded multipack distribution of seasoned organic kale chips. | Households seek lower per-bag costs across club retail channels. | Expand two-flavor multipacks across wholesale clubs. |
| June 2026: BRAD'S PLANT BASED, LLC paired air-dried kale with prebiotic seed inclusions. | Shoppers look for digestive wellness credentials in savory snacks. | Combine low-temperature drying with functional seeds. |
| April 2026: The Kale Factory updated low-sodium batch production for North American grocers. | Retailers require compliant sodium levels under front-of-pack rules. | Audit seasoning batch ratios against dietary guidelines. |
Source: Verified corporate disclosures and Future Market Insights analysis, 2026.
| Company | Core Positioning | Verified Activity & Source Attribution |
|---|---|---|
| Takebayashi WB Co., Ltd | Japan-origin vacuum-dried kale crisp specialist | Supplies domestic organic vegetable crisps and export raw materials (2026). |
| The Kale Factory | U.S. specialty producer of slow-dehydrated curly kale | Expanded organic certified retail bags across North American natural grocers (April 2026). |
| BRAD'S PLANT BASED, LLC | Clean-label air-dried vegetable snack brand | Reformulated savory kale crisps with raw seeds and nutritional yeast (June 2026). |
| Simply 7 Snacks | North American manufacturer of formed vegetable chips | Expanded puffed and extruded kale-blend chips for mainstream grocery (May 2026). |
| Rhythm Superfoods | Premium organic air-dried snack brand | Sourced USDA organic kale from dedicated grower partnerships (2026). |
| Made in Nature | Organic certified dried fruit and vegetable snack producer | Maintains nationwide U.S. distribution of seasoned kale crisps in resealable pouches (2026). |
| Superlife Co. | Singaporean superfood snack distributor | Imports and distributes clean-label kale chips across Southeast Asian natural grocers (2026). |
| Creative Snacks Co. | Specialty baked and dried snack producer | Supplies savory kale snack clusters to club stores and mass grocery chains (2026). |
| LesserEvil Brand Snack Co. | Organic popcorn and vegetable snack brand | Formulates low-oil vegetable crisps seasoned with Himalayan pink salt (2026). |
| Forager Project | Organic plant-based food company | Produces certified organic leafy green snack chips distributed in natural channels (2026). |
Source: Verified corporate disclosures and Future Market Insights analysis, 2026.
Key takeaways
- Valued at USD 257.0 million in 2026, on course for USD 570.4 million by 2036.
- The decade adds USD 313.4 million in new value at an 8.3% CAGR.
- The product segment is led by Dehydrated Leaf Crisps/Chips at 63.0% of 2026 revenue.
- 42.0% of distribution channel revenue goes to Supermarkets/Hypermarkets in 2026.
- Canada grows fastest at 9.1% CAGR, ahead of Mexico at 8.5%.
Kale Chips Market Report Scope and Research Methodology
Scope analysis examines the global kale chips market from 2026 to 2036 through verified trade data, supplier audits, and retail scanner analysis.
| Coverage Field | Report Scope |
|---|---|
| Market Definition | Revenue generated from sales of commercial packaged kale chips, including dehydrated whole-leaf crisps and extruded kale snack chips. |
| Product Segments | Dehydrated Leaf Crisps/Chips and Extruded Chips. |
| Distribution Channels | Supermarkets/Hypermarkets and Online/Specialty Stores. |
| Nature Segments | Organic and Conventional. |
| Packaging Formats | Pouches, Bags, and Canisters. |
| Exclusions | Fresh raw kale bunches, food-grade culinary kale powders, canned cooked kale, restaurant side dishes, and general potato chips. |
| Quantitative Units | USD Million for global and country-level market valuation. |
| Historical & Base Years | 2025 (Historical Base Year) and 2026 (Estimated Base Year). |
| Forecast Period | 2026 to 2036 (10-Year Assessment Window). |
| Regions Covered | North America, Latin America, Europe, East Asia, South Asia, Oceania, and Middle East & Africa. |
| Countries Profiled | Canada, Mexico, UK, Germany, France, Italy, and USA. |
| Companies Profiled | Takebayashi WB Co., Ltd, The Kale Factory, BRAD'S PLANT BASED, LLC, Rhythm Superfoods, and Simply 7 Snacks. |
| Research Approach | Triangulation of primary manufacturer and brand interviews with secondary corporate financial filings and regulatory surveillance audits. |
Source: Future Market Insights analysis of report scope and methodology parameters, 2026.
Research Sources and Bibliography
- BRAD'S PLANT BASED. (2026, June 10). Crunchy Kale Original with Probiotics Product and Packaging Specification.
- Bund Ökologische Lebensmittelwirtschaft. (2026, February 12). Biofach 2026: BÖLW bringt Bio auf die Bühne - Der deutsche Bio-Markt. https://www.boelw.de/themen/pflanze/gesundheit/artikel/biofach-2026-boelw-bringt-bio-auf-die-buehne/
- California Department of Public Health. (2026, May 19). CDPH Warns Consumers Not to Eat Brad's Plant Based Products Due to Elevated Thallium.
- Canadian Food Inspection Agency. (2025, November 17). Notice to industry: Compliance and enforcement approach for front-of-package nutrition labelling effective January 1, 2026. https://inspection.canada.ca/en/food-labels/labelling/nutrition-labelling-regulations
- CHICAGO KALE CHIP CO. (2026, April 18). Raw Vegan Organic Air-Cured Kale Chips Product Line.
- Costco Canada. (2026, May 14). Healthy Crunch Kale Chips Variety Pack, 12 x 35 g Product Listing. https://www.costco.ca/p/-/healthy-crunch-kale-chips-variety-pack-12--35-g/4000324530
- Government of the United Kingdom. (2026, January 5). Landmark junk food ad ban to protect kids' health takes effect.
- Healthy Crunch. (2026, April 10). School Approved and Keto Certified Air-Dried Kale Chips Collection. https://healthycrunch.com/collections/kale-chips
- Istituto Nazionale di Statistica. (2026, October 8). Spese per consumi delle famiglie - Anno 2025. https://www.istat.it/comunicato-stampa/spese-per-consumi-delle-famiglie-anno-2025/
- Los Angeles County Department of Public Health. (2026, May 22). Public Health Warns Consumers Not to Eat Brad's Plant Based Products. https://lacounty.gov/2026/05/22/public-health-warns-consumers-not-to-eat-brads-plant-based-products/
- MDPI Foods. (2025, May 20). Using Dried Crickets and Kale Powder as Nutrients and Bioactive Compounds in Baked Chips. https://www.mdpi.com/2304-8158/14/10/1810
- MDPI International Journal of Environmental Research and Public Health. (2025, August 7). Thallium Exposure Secondary to Commercial Kale Chip Consumption. https://www.mdpi.com/1660-4601/22/8/1235
- MDPI Molecules. (2026, July 31). The Effect of Hybrid Convective-Infrared-Ultrasonic Drying on the Physicochemical Properties of Dried Kale Leaves. https://www.mdpi.com/1420-3049/31/15/2683
- PubMed. (2026, July 31). The Effect of Hybrid Convective-Infrared-Ultrasonic Drying on Polyphenols and Chlorophyll in Kale Snacks. https://pubmed.ncbi.nlm.nih.gov/42588531/
- Santé publique France. (2026, March 19). Evaluation of the Nutri-Score 2025 Campaign and Updated Algorithm. https://www.santepubliquefrance.fr/index.php/en/nutrition-et-activite-physique/reportsummary/evaluation-nutri-score-2025-campaign
- Secretaría de Economía and COFEPRIS. (2025, July 31). Acuerdo por el que se amplía el plazo de la segunda fase de la NOM-051-SCFI/SSA1-2010. https://sidof.segob.gob.mx/notas/docFuente/5764197
- Simply 7 Snacks. (2026, March 12). Sea Salt Kale Chips: Formed Veggie Chip Product Specification. https://www.simply7snacks.com/product/sea-salt-kale-chips/
- Simply 7 Snacks. (2026, May 20). Veggie Chips Portfolio: Plant-Based Gluten-Free Kale Crisps. https://www.simply7snacks.com/products/veggie/
- Takebayashi WB Co., Ltd. (2026, July 15). Yoshitomo Gluten-Free Vegan Kale Chips (Walnut Cheese) Export Specification. https://takebayashiwb.co.jp/en/product/detail/129
- The Kale Factory. (2026, April 22). Whole-Leaf Slow-Dehydrated Raw Vegan Kale Chips Portfolio. https://www.thekalefactory.com/products/slow-dehydrated-raw-vegan-kale-chips
- U.S. Food and Drug Administration. (2024, December 19). FDA Updates 'Healthy' Claim, Providing a Refreshed Tool for Consumers. https://www.fda.gov/news-events/press-announcements/fda-updates-healthy-claim-providing-refreshed-tool-consumers
- U.S. Food and Drug Administration. (2026, November 3). Snack Right Super Foods, Inc. dba Brad's Raw Chips Recalls Brad's Crunchy Kale & Veggie Chips Due to Potential Thallium Contamination. https://www.fda.gov/safety/recalls-market-withdrawals-safety-alerts/snack-right-super-foods-inc-dba-brads-raw-chips-recalls-brads-crunchy-kale-veggie-chips-due
- USDA National Agricultural Statistics Service. (2026, January 12). Crop Production 2025 Summary (January 2026). https://esmis.nal.usda.gov/sites/default/release-files/795725/cropan26.pdf
- Whole Foods Market. (2026, June 15). Rhythm Superfoods Organic Original Kale Chips 2 oz 4-Pack Grocery Assortment. https://www.wholefoodsmarket.com/grocery/product/rhythm-superfoods-rhythm-superfoods-kale-chips-original-vegan-organic-and-non-gmo-2-ounce-pack-of-4-b073h4r7v8
Table of Content
- Key Takeaways
- Market Size and CAGR
- Top Growth Driver
- Fastest Growing Segment
- Leading Region
- Key Companies
- Emerging Opportunities
- Executive Summary
- Global Market Outlook
- Demand-side Trends
- Supply-side Trends
- Technology Roadmap Analysis
- Analysis and Recommendations
- Analyst Perspective (What is happening? Why now? What should investors know?)
- Key Questions Answered
- How large is the market?
- What is the CAGR?
- What are key trends?
- Which region dominates?
- Who are the leaders?
Read More...
- Market Overview
- Market Coverage / Taxonomy
- Market Definition / Scope / Limitations
- Research Methodology
- Chapter Orientation
- Analytical Lens and Working Hypotheses
- Market Structure, Signals, and Trend Drivers
- Benchmarking and Cross-market Comparability
- Market Sizing, Forecasting, and Opportunity Mapping
- Research Design and Evidence Framework
- Desk Research Programme (Secondary Evidence)
- Expert Input and Fieldwork (Primary Evidence)
- Tooling, Models, and Reference Databases
- Data Engineering and Model Build
- Quality Assurance and Audit Trail
- Market Background
- Market Dynamics (Drivers, Restraints, Opportunity, Trends)
- Scenario Forecast (Optimistic, Likely, Conservative)
- Impact Analysis
- AI Impact
- Sustainability Impact
- Regulatory Impact
- Technology Impact
- Consumer / Buyer Analysis
- Purchase Drivers
- Adoption Barriers
- Buyer Journey
- Opportunity Map Analysis
- Product Life Cycle Analysis
- Supply Chain Analysis
- Investment Feasibility Matrix
- Value Chain Analysis
- PESTLE and Porter's Analysis
- Regulatory Landscape
- Regional Parent Market Outlook
- Production and Consumption Statistics
- Import and Export Statistics
- Global Market Analysis and Forecast, 2021 to 2036
- Historical Market Size Value (USD Million) Analysis, 2021 to 2025
- Current and Future Market Size Value (USD Million) Projections, 2026 to 2036
- Y-o-Y Growth Trend Analysis
- Absolute $ Opportunity Analysis
- Global Market Pricing Analysis, 2021 to 2036
- Global Market Analysis and Forecast, By Product, 2021 to 2036
- Introduction / Key Findings
- Historical Market Size Value (USD Million) Analysis By Product, 2021 to 2025
- Current and Future Market Size Value (USD Million) Analysis and Forecast By Product, 2026 to 2036
- Dehydrated Leaf Crisps/Chips
- Extruded Chips
- Y-o-Y Growth Trend Analysis By Product, 2021 to 2025
- Absolute $ Opportunity Analysis By Product, 2026 to 2036
- Global Market Analysis and Forecast, By Distribution Channel, 2021 to 2036
- Introduction / Key Findings
- Historical Market Size Value (USD Million) Analysis By Distribution Channel, 2021 to 2025
- Current and Future Market Size Value (USD Million) Analysis and Forecast By Distribution Channel, 2026 to 2036
- Supermarkets/Hypermarkets
- Online/Specialty Stores
- Y-o-Y Growth Trend Analysis By Distribution Channel, 2021 to 2025
- Absolute $ Opportunity Analysis By Distribution Channel, 2026 to 2036
- Global Market Analysis and Forecast, By Nature, 2021 to 2036
- Introduction / Key Findings
- Historical Market Size Value (USD Million) Analysis By Nature, 2021 to 2025
- Current and Future Market Size Value (USD Million) Analysis and Forecast By Nature, 2026 to 2036
- Organic
- Conventional
- Y-o-Y Growth Trend Analysis By Nature, 2021 to 2025
- Absolute $ Opportunity Analysis By Nature, 2026 to 2036
- Global Market Analysis and Forecast, By Packaging, 2021 to 2036
- Introduction / Key Findings
- Historical Market Size Value (USD Million) Analysis By Packaging, 2021 to 2025
- Current and Future Market Size Value (USD Million) Analysis and Forecast By Packaging, 2026 to 2036
- Pouch
- Bag
- Canister
- Y-o-Y Growth Trend Analysis By Packaging, 2021 to 2025
- Absolute $ Opportunity Analysis By Packaging, 2026 to 2036
- Global Market Analysis and Forecast, By Region, 2021 to 2036
- Introduction
- Historical Market Size Value (USD Million) Analysis By Region, 2021 to 2025
- Current Market Size Value (USD Million) Analysis and Forecast By Region, 2026 to 2036
- North America
- Western Europe
- East Asia
- South Asia and Pacific
- Market Attractiveness Analysis By Region
- North America Market Analysis and Forecast, By Country, 2021 to 2036
- Historical Market Size Value (USD Million) Trend Analysis By Market Taxonomy, 2021 to 2025
- Market Size Value (USD Million) Forecast By Market Taxonomy, 2026 to 2036
- By Country
- United States
- Canada
- By Product
- By Distribution Channel
- By Nature
- By Packaging
- By Country
- Market Attractiveness Analysis
- By Country
- By Product
- By Distribution Channel
- By Nature
- By Packaging
- Key Takeaways
- Western Europe Market Analysis and Forecast, By Country
- Historical Market Size Value (USD Million) Trend Analysis By Market Taxonomy, 2021 to 2025
- Market Size Value (USD Million) Forecast By Market Taxonomy, 2026 to 2036
- By Country
- United Kingdom
- Germany
- France
- By Product
- By Distribution Channel
- By Nature
- By Packaging
- By Country
- Market Attractiveness Analysis
- By Country
- By Product
- By Distribution Channel
- By Nature
- By Packaging
- Key Takeaways
- East Asia Market Analysis and Forecast, By Country
- Historical Market Size Value (USD Million) Trend Analysis By Market Taxonomy, 2021 to 2025
- Market Size Value (USD Million) Forecast By Market Taxonomy, 2026 to 2036
- By Country
- China
- Japan
- South Korea
- By Product
- By Distribution Channel
- By Nature
- By Packaging
- By Country
- Market Attractiveness Analysis
- By Country
- By Product
- By Distribution Channel
- By Nature
- By Packaging
- Key Takeaways
- South Asia and Pacific Market Analysis and Forecast, By Country
- Historical Market Size Value (USD Million) Trend Analysis By Market Taxonomy, 2021 to 2025
- Market Size Value (USD Million) Forecast By Market Taxonomy, 2026 to 2036
- By Country
- India
- Australia
- Rest of world aggregate
- By Product
- By Distribution Channel
- By Nature
- By Packaging
- By Country
- Market Attractiveness Analysis
- By Country
- By Product
- By Distribution Channel
- By Nature
- By Packaging
- Key Takeaways
- Key Countries Market Analysis
- United States
- Pricing Analysis
- Market Share Analysis, 2025
- By Product
- By Distribution Channel
- By Nature
- By Packaging
- Canada
- Pricing Analysis
- Market Share Analysis, 2025
- By Product
- By Distribution Channel
- By Nature
- By Packaging
- Germany
- Pricing Analysis
- Market Share Analysis, 2025
- By Product
- By Distribution Channel
- By Nature
- By Packaging
- United Kingdom
- Pricing Analysis
- Market Share Analysis, 2025
- By Product
- By Distribution Channel
- By Nature
- By Packaging
- France
- Pricing Analysis
- Market Share Analysis, 2025
- By Product
- By Distribution Channel
- By Nature
- By Packaging
- India
- Pricing Analysis
- Market Share Analysis, 2025
- By Product
- By Distribution Channel
- By Nature
- By Packaging
- China
- Pricing Analysis
- Market Share Analysis, 2025
- By Product
- By Distribution Channel
- By Nature
- By Packaging
- Japan
- Pricing Analysis
- Market Share Analysis, 2025
- By Product
- By Distribution Channel
- By Nature
- By Packaging
- South Korea
- Pricing Analysis
- Market Share Analysis, 2025
- By Product
- By Distribution Channel
- By Nature
- By Packaging
- Australia
- Pricing Analysis
- Market Share Analysis, 2025
- By Product
- By Distribution Channel
- By Nature
- By Packaging
- United States
- Market Structure Analysis
- Competition Dashboard
- Competition Benchmarking
- Market Share Analysis of Top Players
- By Regional
- By Product
- By Distribution Channel
- By Nature
- By Packaging
- Emerging Startups
- Innovation Benchmarking
- Competition Analysis
- Competition Deep Dive
- Takebayashi WB Co., Ltd
- Overview
- Product Portfolio
- Profitability by Market Segments
- Sales Footprint
- Strategy Overview
- Marketing Strategy
- Product Strategy
- Channel Strategy
- The Kale Factory
- BRAD'S PLANT BASED, LLC
- Simply 7 Snacks
- Rhythm Superfoods
- Made in Nature
- Superlife Co.
- Creative Snacks Co.
- LesserEvil Brand Snack Co.
- Forager Project
- Takebayashi WB Co., Ltd
- Case Studies
- Success Stories
- Recent Developments
- Competition Deep Dive
- Assumptions & Acronyms Used
List of Tables
- Table 1: Global Market Value (USD Million) Forecast by Region, 2021 to 2036
- Table 2: Global Market Value (USD Million) Forecast by Product, 2021 to 2036
- Table 3: Global Market Value (USD Million) Forecast by Distribution Channel, 2021 to 2036
- Table 4: Global Market Value (USD Million) Forecast by Nature, 2021 to 2036
- Table 5: Global Market Value (USD Million) Forecast by Packaging, 2021 to 2036
- Table 6: North America Market Value (USD Million) Forecast by Country, 2021 to 2036
- Table 7: North America Market Value (USD Million) Forecast by Product, 2021 to 2036
- Table 8: North America Market Value (USD Million) Forecast by Distribution Channel, 2021 to 2036
- Table 9: North America Market Value (USD Million) Forecast by Nature, 2021 to 2036
- Table 10: North America Market Value (USD Million) Forecast by Packaging, 2021 to 2036
- Table 11: Western Europe Market Value (USD Million) Forecast by Country, 2021 to 2036
- Table 12: Western Europe Market Value (USD Million) Forecast by Product, 2021 to 2036
- Table 13: Western Europe Market Value (USD Million) Forecast by Distribution Channel, 2021 to 2036
- Table 14: Western Europe Market Value (USD Million) Forecast by Nature, 2021 to 2036
- Table 15: Western Europe Market Value (USD Million) Forecast by Packaging, 2021 to 2036
- Table 16: East Asia Market Value (USD Million) Forecast by Country, 2021 to 2036
- Table 17: East Asia Market Value (USD Million) Forecast by Product, 2021 to 2036
- Table 18: East Asia Market Value (USD Million) Forecast by Distribution Channel, 2021 to 2036
- Table 19: East Asia Market Value (USD Million) Forecast by Nature, 2021 to 2036
- Table 20: East Asia Market Value (USD Million) Forecast by Packaging, 2021 to 2036
- Table 21: South Asia and Pacific Market Value (USD Million) Forecast by Country, 2021 to 2036
- Table 22: South Asia and Pacific Market Value (USD Million) Forecast by Product, 2021 to 2036
- Table 23: South Asia and Pacific Market Value (USD Million) Forecast by Distribution Channel, 2021 to 2036
- Table 24: South Asia and Pacific Market Value (USD Million) Forecast by Nature, 2021 to 2036
- Table 25: South Asia and Pacific Market Value (USD Million) Forecast by Packaging, 2021 to 2036
List of Figures
- Figure 1: Global Market Pricing Analysis
- Figure 2: Global Market Value (USD Million) Forecast 2021-2036
- Figure 3: Global Market Value Share and BPS Analysis by Product, 2026 and 2036
- Figure 4: Global Market Y-o-Y Growth Comparison by Product, 2026-2036
- Figure 5: Global Market Attractiveness Analysis by Product
- Figure 6: Global Market Value Share and BPS Analysis by Distribution Channel, 2026 and 2036
- Figure 7: Global Market Y-o-Y Growth Comparison by Distribution Channel, 2026-2036
- Figure 8: Global Market Attractiveness Analysis by Distribution Channel
- Figure 9: Global Market Value Share and BPS Analysis by Nature, 2026 and 2036
- Figure 10: Global Market Y-o-Y Growth Comparison by Nature, 2026-2036
- Figure 11: Global Market Attractiveness Analysis by Nature
- Figure 12: Global Market Value Share and BPS Analysis by Packaging, 2026 and 2036
- Figure 13: Global Market Y-o-Y Growth Comparison by Packaging, 2026-2036
- Figure 14: Global Market Attractiveness Analysis by Packaging
- Figure 15: Global Market Value (USD Million) Share and BPS Analysis by Region, 2026 and 2036
- Figure 16: Global Market Y-o-Y Growth Comparison by Region, 2026-2036
- Figure 17: Global Market Attractiveness Analysis by Region
- Figure 18: North America Market Incremental Dollar Opportunity, 2026-2036
- Figure 19: Western Europe Market Incremental Dollar Opportunity, 2026-2036
- Figure 20: East Asia Market Incremental Dollar Opportunity, 2026-2036
- Figure 21: South Asia and Pacific Market Incremental Dollar Opportunity, 2026-2036
- Figure 22: North America Market Value Share and BPS Analysis by Country, 2026 and 2036
- Figure 23: North America Market Value Share and BPS Analysis by Product, 2026 and 2036
- Figure 24: North America Market Y-o-Y Growth Comparison by Product, 2026-2036
- Figure 25: North America Market Attractiveness Analysis by Product
- Figure 26: North America Market Value Share and BPS Analysis by Distribution Channel, 2026 and 2036
- Figure 27: North America Market Y-o-Y Growth Comparison by Distribution Channel, 2026-2036
- Figure 28: North America Market Attractiveness Analysis by Distribution Channel
- Figure 29: North America Market Value Share and BPS Analysis by Nature, 2026 and 2036
- Figure 30: North America Market Y-o-Y Growth Comparison by Nature, 2026-2036
- Figure 31: North America Market Attractiveness Analysis by Nature
- Figure 32: North America Market Value Share and BPS Analysis by Packaging, 2026 and 2036
- Figure 33: North America Market Y-o-Y Growth Comparison by Packaging, 2026-2036
- Figure 34: North America Market Attractiveness Analysis by Packaging
- Figure 35: Western Europe Market Value Share and BPS Analysis by Country, 2026 and 2036
- Figure 36: Western Europe Market Value Share and BPS Analysis by Product, 2026 and 2036
- Figure 37: Western Europe Market Y-o-Y Growth Comparison by Product, 2026-2036
- Figure 38: Western Europe Market Attractiveness Analysis by Product
- Figure 39: Western Europe Market Value Share and BPS Analysis by Distribution Channel, 2026 and 2036
- Figure 40: Western Europe Market Y-o-Y Growth Comparison by Distribution Channel, 2026-2036
- Figure 41: Western Europe Market Attractiveness Analysis by Distribution Channel
- Figure 42: Western Europe Market Value Share and BPS Analysis by Nature, 2026 and 2036
- Figure 43: Western Europe Market Y-o-Y Growth Comparison by Nature, 2026-2036
- Figure 44: Western Europe Market Attractiveness Analysis by Nature
- Figure 45: Western Europe Market Value Share and BPS Analysis by Packaging, 2026 and 2036
- Figure 46: Western Europe Market Y-o-Y Growth Comparison by Packaging, 2026-2036
- Figure 47: Western Europe Market Attractiveness Analysis by Packaging
- Figure 48: East Asia Market Value Share and BPS Analysis by Country, 2026 and 2036
- Figure 49: East Asia Market Value Share and BPS Analysis by Product, 2026 and 2036
- Figure 50: East Asia Market Y-o-Y Growth Comparison by Product, 2026-2036
- Figure 51: East Asia Market Attractiveness Analysis by Product
- Figure 52: East Asia Market Value Share and BPS Analysis by Distribution Channel, 2026 and 2036
- Figure 53: East Asia Market Y-o-Y Growth Comparison by Distribution Channel, 2026-2036
- Figure 54: East Asia Market Attractiveness Analysis by Distribution Channel
- Figure 55: East Asia Market Value Share and BPS Analysis by Nature, 2026 and 2036
- Figure 56: East Asia Market Y-o-Y Growth Comparison by Nature, 2026-2036
- Figure 57: East Asia Market Attractiveness Analysis by Nature
- Figure 58: East Asia Market Value Share and BPS Analysis by Packaging, 2026 and 2036
- Figure 59: East Asia Market Y-o-Y Growth Comparison by Packaging, 2026-2036
- Figure 60: East Asia Market Attractiveness Analysis by Packaging
- Figure 61: South Asia and Pacific Market Value Share and BPS Analysis by Country, 2026 and 2036
- Figure 62: South Asia and Pacific Market Value Share and BPS Analysis by Product, 2026 and 2036
- Figure 63: South Asia and Pacific Market Y-o-Y Growth Comparison by Product, 2026-2036
- Figure 64: South Asia and Pacific Market Attractiveness Analysis by Product
- Figure 65: South Asia and Pacific Market Value Share and BPS Analysis by Distribution Channel, 2026 and 2036
- Figure 66: South Asia and Pacific Market Y-o-Y Growth Comparison by Distribution Channel, 2026-2036
- Figure 67: South Asia and Pacific Market Attractiveness Analysis by Distribution Channel
- Figure 68: South Asia and Pacific Market Value Share and BPS Analysis by Nature, 2026 and 2036
- Figure 69: South Asia and Pacific Market Y-o-Y Growth Comparison by Nature, 2026-2036
- Figure 70: South Asia and Pacific Market Attractiveness Analysis by Nature
- Figure 71: South Asia and Pacific Market Value Share and BPS Analysis by Packaging, 2026 and 2036
- Figure 72: South Asia and Pacific Market Y-o-Y Growth Comparison by Packaging, 2026-2036
- Figure 73: South Asia and Pacific Market Attractiveness Analysis by Packaging
- Figure 74: Global Market - Tier Structure Analysis
- Figure 75: Global Market - Company Share Analysis
Frequently Asked Questions
How big is the kale chips market in 2026, and what is forecast for 2036?
Global kale chips market valuation stands at USD 257.0 million in 2026, up from USD 237.3 million in 2025, and is forecast to reach USD 570.4 million by 2036. Market sizing covers packaged whole-leaf and extruded kale chips across retail and online channels.
What is the kale chips market CAGR from 2026 to 2036?
Future Market Insights projects the global kale chips market to expand at an 8.3% CAGR from 2026 to 2036. Growth is supported by supermarket natural-snack planogram expansion and multi-pack online fulfillment.
Which Product segment leads the kale chips market?
Dehydrated Leaf Crisps/Chips hold 63.0% of the kale chips market by Product in 2026, driven by consumer preference for intact whole-leaf texture and high polyphenol retention.
Which Distribution Channel leads sales of kale chips?
Supermarkets/Hypermarkets account for 42.0% of kale chips Distribution Channel revenue in 2026, supported by mainstream grocery free-from bays and recurring multi-pack replenishment.
How do Extruded Chips compare with whole-leaf kale crisps?
Extruded Chips represent 37.0% of Product demand in 2026, offering uniform ridged geometry and lower in-bag breakage for lunchbox and convenience-store channels.
Which profiled countries have the highest kale chips growth rates?
Canada leads the profiled countries at a 9.1% CAGR from 2026 to 2036, followed by Mexico at 8.5% and the UK and Germany at 8.3% each.
Which companies are profiled in the kale chips market?
Key players in the kale chips market include Takebayashi WB Co., Ltd, The Kale Factory, BRAD'S PLANT BASED, Simply 7 Snacks, Healthy Crunch, and CHICAGO KALE CHIP CO.
What quality and safety checks govern kale chip retail qualification?
Retailers require ICP-MS heavy-metal soil and batch screening for thallium, moisture-barrier packaging achieving water activity below 0.6, and compliant front-of-package sodium declarations.
Preview the report firsthand - request a free sample
Get SampleGet the brochure for pricing and purchase details.
Get PDF
