Reports

- Global Locations -

Headquarters

Future Market Insights, Inc.

Christiana Corporate, 200
Continental Drive, Suite 401,
Newark, Delaware - 19713,
United States

T: +1-845-579-5705

Americas

Future Market Insights, Inc.

616 Corporate Way, Suite 2-9018,
Valley Cottage, NY 10989, United States

T: +1-347-918-3531

MEA

Future Market Insights

1602-6 Jumeirah Bay X2 Tower, Plot No: JLT-PH2-X2A,
Jumeirah Lakes Towers, Dubai,
United Arab Emirates

Europe

Future Market Insights

3rd Floor, 207 Regent Street,
W1B 3HH London
United Kingdom

T: + 44 (0) 20 8123 9659
D: +44 (0) 20 3287 4268

Asia Pacific

Future Market Insights

IndiaLand Global Tech Park, Unit UG-1, Behind Grand HighStreet, Phase 1, Hinjawadi, MH, Pune – 411057, India

Lupin Milk Market Outlook from 2024 to 2034

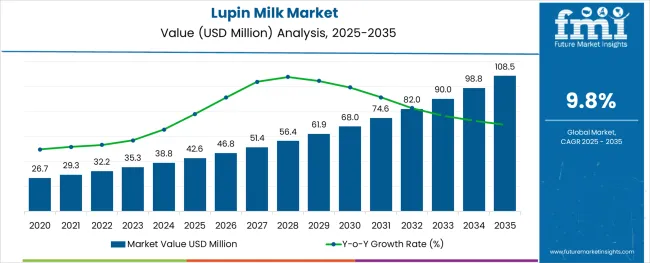
The global lupin milk market is expected to grow from US$ 39.0 million in 2024 to US$ 66.6 million by 2034. By 2034, the market is projected to surge at 9.8% CAGR.

Attributes Key Insights
Estimated Global Lupin Milk Market Size (2024E) US$ 39.0 million
Projected Lupin Milk Market Value (2024E) US$ 66.6 million
Value-based CAGR (2024 to 2034) 9.8%

Lupin Milk Market Overview

  • With increasing health and wellness awareness, consumers seek healthier alternatives to traditional dairy products. Lupin milk is rich in protein and minerals yet low in fat and carbohydrates, meeting the tastes of health-conscious consumers.
  • There is a growing demand for lupin-rich food products due to their high protein content and low glycemic index, which are beneficial for obese and diabetic patients with hypertension.
  • Lupin milk is naturally free from casein and lactose, making it a great alternative for individuals with lactose intolerance or dairy allergies.
  • Lupin milk is considered as a sustainable alternative to cow's milk because lupine plants require less water and fertilizer than traditional dairy farming, fueling the market growth.
  • The growing popularity of lupin milk in the food and beverage industry, considering its sustainability, nutritional benefits, and versatility in several recipes, is expected to drive market growth.

Don't pay for what you don't need

Customize your report by selecting specific countries or regions and save 30%!

2019 to 2024 Global Lupin Milk Market Growth Outlook Vs. 2024 to 2034

The global lupin milk market has shown steady growth from 2019 to 2023, reflecting the surging adoption of plant-based and vegan lifestyles.

  • Consumers were choosing plant-based alternatives for ethical, environmental, and health reasons, contributing to the increased demand for lupin milk as a milk substitute.
  • Food producers have diversified and innovated lupin-based products beyond conventional milk in response to market demand. This involves creating yogurt, cheese, ice cream, and other dairy substitutes based on lentils, giving consumers more options.
  • Technology developments in the food processing and industrial sectors have made it easier to produce lupin milk on a wider scale. The taste, texture, and nutritional profile of lupin milk have all been improved by advanced extraction and processing processes, which have increased consumer appeal.
  • Growing knowledge of lupin milk's nutritional advantages, such as its high protein, low fat, and cholesterol-free composition, has boosted its appeal.

The lupin milk market is projected to rise at a CAGR of 9.8% by 2034.

  • As consumers are becoming aware of lactose intolerance and allergies to dairy, there is a rising demand for suitable alternatives.
  • Lupin milk, being lactose-free and allergen-friendly, caters to individuals with dietary restrictions or those looking for plant-based options.
  • The versatility of lupin milk allows for innovation in several food and beverage products.
  • Manufacturers focus on developing unique recipes, such as lupin milk-based hot chocolate and pancakes, expanding the range of plant-based offerings in the market.

Key Lupin Milk Market Trends

  • Rising demand for lupin milk in the bakery and confectionery market.
  • Rising consumer consciousness of the environmental impact of their food choices.
  • Growing marketing efforts and educational drives about the benefits of lupin milk contribute to consumer awareness.
  • Lupin milk, made from lupin beans, appeals to health-conscious consumers searching for whole-food-based, minimally processed options.
  • Lupin milk is excellent for consumers with food allergies or intolerances as it lacks common allergens, including dairy, soy, and nuts.
  • Lupin milk fits in with vegetarian and vegan diets, satisfying the increasing number of customers switching to plant-based diets.
  • When compared to other crops, lupin cultivation is comparatively sustainable.
  • Consumers are becoming more concerned about the sustainability of components used in food items, such as lupin milk, as environmental issues gain prominence.
Nandini Roy Choudhury

Principal Consultant

Talk to Analyst

Find your sweet spots for generating winning opportunities in this market.

Restraining Factors in the Lupin Milk Market

  • Customers are expected to find lupin milk less acceptable than regular dairy milk because of its potential differences in taste and texture.
  • Restricted distribution networks are set to make it more difficult for consumers to obtain and use lupin milk, particularly in areas where it is not extensively available.
  • Processing techniques, where lupin beans are sourced, and economies of scale are expected to contribute to the high cost of lupin milk production.

Comparative View of Adjacent Markets

A comprehensive analysis of growth and challenges has been tabulated below. The lupin milk market is compared with two industries that have the potential to compete rigorously: the almond milk market and the oat milk market. The growth rates and key market trends are mentioned in the table below. Among the mentioned markets, the oat milk market is poised to rise more rapidly during the forecast period.

Lupin Milk Market:

Attributes Lupin Milk Industry
CAGR (2024 to 2034) 9.8%
Lupin Milk Market Opportunities Food producers are investing in research & development activities to expand and enhance their line of lupin-based goods, which includes cheese, ice cream, yogurt, and milk. The goal behind this movement is to provide a greater selection of plant-based solutions while also catering to the changing interests of consumers.
Lupin Milk Industry Trend The demand for plant-based milk substitutes, such as lupin milk, is increasing due to growing awareness of the negative environmental effects of dairy farming, as well as health issues and dietary choices.

Almond Milk Market:

Attributes Almond Milk Market
CAGR (2024 to 2034) 8.8%
Opportunity Due to its extended shelf life and accessibility in handy packaging options such as cartons and single-serve bottles, almond milk is a well-liked option for consumption when on the go.
Key Trends The increasing prevalence of lactose intolerance and hypercholesterolemia is driving the demand for almond milk.

Oat Milk Market:

Attributes Oat Milk Market
CAGR (2024 to 2034) 13.7%
Opportunity Rising demand for plant-based beverages and the development of new oat milk varieties are expected to create new opportunities for manufacturers.
Key Trends Surging usage of oat flour drinks as an alternative to traditional oatmeal is expected to foster market development.

Get the data you need at a Fraction of the cost

Personalize your report by choosing insights you need
and save 40%!

Country-wise Insights

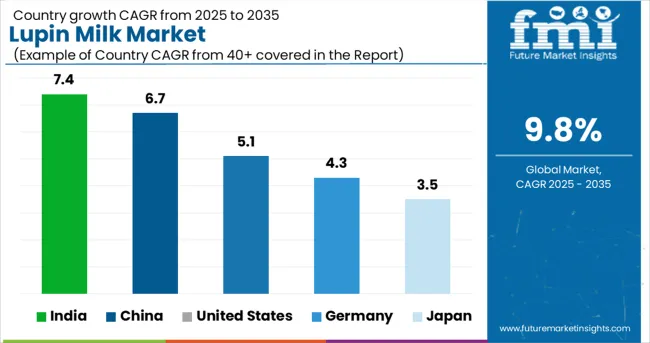
The table below explains the size of the lupin milk market in the top five countries for 2034. Among them, the United States is anticipated to remain at the forefront by reaching a valuation of US$ 13.3 million. It is expected to be followed by Germany and China at US$ 10.7 million and US$ 9.3 million, respectively, by 2034.

Countries Market Value in 2034
Australia US$ 3.3 million
Germany US$ 10.7 million
China US$ 9.3 million
United States US$ 13.3 million
Poland US$ 2.7 million

Emerging Opportunities in Australia Attracting Market Players

Australia’s lupin milk market is expected to reach US$ 3.3 million by 2034. The factors driving the market growth are as follows:

  • Concerns about the environment and health have all contributed to a sharp rise in the demand for plant-based milk substitutes such as lupin milk in Australia in recent years.
  • Sustained innovation in product composition and packaging is expected to enhance consumer interest in and demand for lupin milk in Australia.

Plant-based Diet Trend to Boost Sales of Lupin Milk in Poland

The lupin milk market in Poland is poised to exhibit a CAGR of 5.6%, reaching a market valuation of US$ 2.7 million during the forecast period. Emerging patterns in the market are as follows:

  • The upsurge in plant-based diets is boosting the sales of lupin milk in Poland. Lupin milk is a dairy-free alternative that has gained popularity due to its unique nutritional profile and potential health benefits.
  • Lupin milk's versatility in culinary applications makes it a versatile ingredient for several recipes, driving its popularity among consumers and food service establishments.

Booming Food and Beverage Industry Escalating the Demand in the United States

The United States is expected to surge at a CAGR of 7.6% to reach a market valuation of US$ 13.3 million by 2034. It is set to witness an increasing demand for nutritious and sustainable food sources. Other top factors supporting the market expansion in the country include:

  • With a growing number of consumers adopting plant-based diets for ethical, environmental, and health reasons, the demand for dairy alternatives like lupin milk is experiencing a substantial increase.
  • Lupin milk offers a nutritious and cruelty-free alternative to cow's milk, making it a preferred choice among vegans and individuals with lactose intolerance or dairy allergies.

Consumer Awareness Boosts Lupin Milk Demand in China

By 2034, China is expected to reach US$ 9.3 million. The key factors supporting the market growth are:

  • Lupin milk is available in several health food stores, specialty markets, or online retailers catering to consumers seeking plant-based alternatives in China.
  • Growing consumer knowledge and understanding of lupin milk's sustainability and nutritional advantages are set to fuel its expansion in China.
  • Compared to other plant-based milk substitutes such as almond, soy, or oat milk, the market for lupin milk is still developing in China.

Growing Emphasis on Health and Well-being in Germany Inflating Market Growth

Lupin milk demand in Germany is anticipated to reach US$ 10.7 million by 2034. This is attributable to a combination of factors, including:

  • Germany has a long history of cultivating lupin, which is utilized in several regional recipes.
  • The fact that customers in Germany are familiar with lupin as an ingredient is set to help lupin milk become more widely accepted and used.

Category-wise Insights

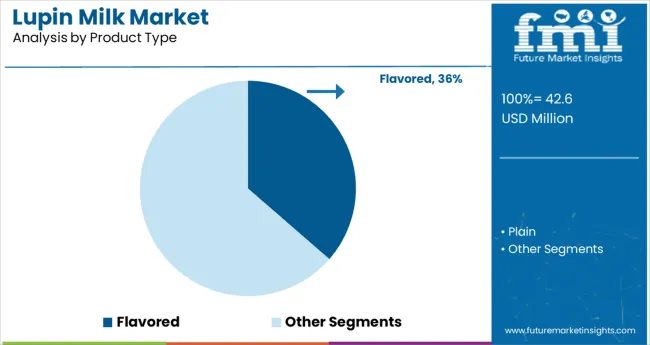
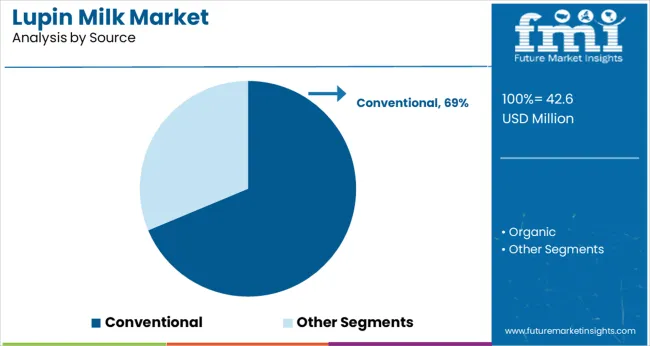
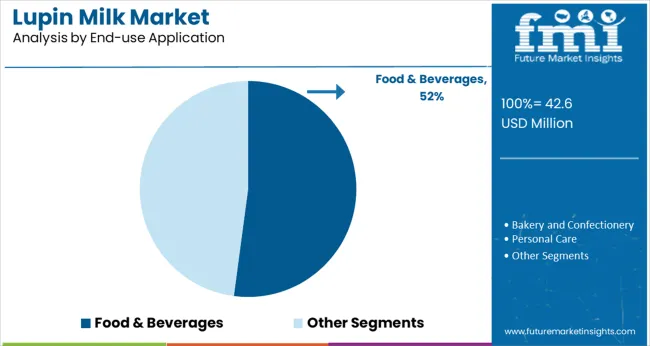
The section below shows the plain segment dominated by product type. The segment is expected to reach US$ 21.8 million by 2024. Based on end-use applications, the food and beverage segment is anticipated to generate a dominant share through 2024. It is set to reach US$ 15.6 million by 2024.

Segment Market Value (2024)
Plain (Product Type) US$ 21.8 million
Conventional (Source) US$ 35.1 million
Food and Beverages (End-use Application) US$ 15.6 million
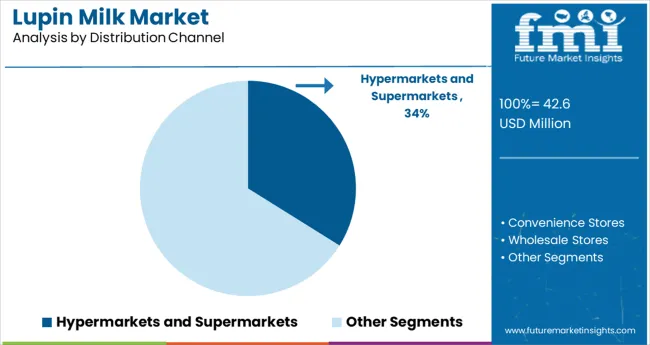
Hypermarket./Supermarket (Distribution Channel) US$ 12.0 million

Food and Beverage Industry to Generate High Revenue Through 2034

Based on end-use applications, the food and beverage segment is expected to reach US$ 15.6 million in 2024.

  • The food and beverage segment is projected to expand due to the rising popularity of lupin milk as an alternative to traditional dairy milk.
  • Lupin milk is a key ingredient used in smoothies, providing a creamy texture and additional nutritional benefits. Like conventional milk, lupin milk is poured over cereals or used as an ingredient in breakfast recipes.
  • Lupin milk adds a nutritional boost to morning meals. Also, it is used to prepare rice pudding and pasta, offering a plant-based alternative to traditional recipes.

Plain Lupin Milk Remains a Highly Sought-after Product Type

  • Consumers increasingly prioritize natural and minimally processed food & beverage options. Plain lupin milk, devoid of artificial flavors and additives, aligns with this consumer preference for simplicity and purity.
  • Plain lupin milk’s clean label appeal resonates with health-conscious individuals seeking wholesome dairy alternatives.
  • Plain lupin milk boasts a neutral flavor profile, making it a versatile ingredient in several culinary applications.
  • Unlike flavored variants, which are set to impart specific taste profiles, plain lupin milk is a blank canvas, allowing consumers to customize its flavor according to their preferences.

Competitive Landscape

The lupin milk market has a diverse and dynamic competitive landscape. Lupin milk suppliers and producers are focusing on research & development, sustainable sourcing, and new formulations to expand their market reach.

Leading companies are introducing flavors such as chocolate and vanilla to mask the nutty taste of lupin milk. Key players are enhancing their market position and capitalizing on the growing demand by focusing on quality, innovation, and matching customer preferences.

Product Launches and Key Developments

  • In 2021, Lumi Foods partnered with PURIS to establish an integrated ecosystem to increase the production of lupin-based products.
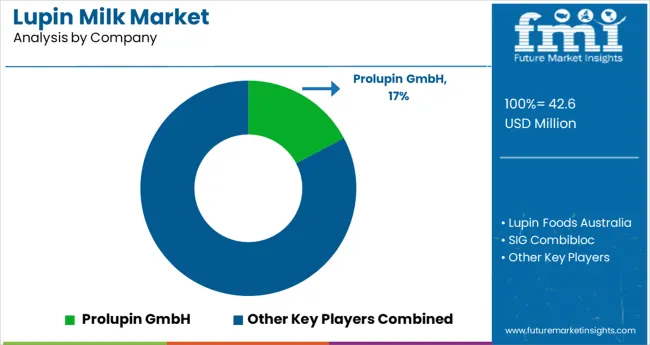
  • In 2023, Wide Open Agriculture, an Australia-based regenerative food and agriculture firm, acquired Prolupin, the top producer of sweet lupin protein in Germany.

Key Companies Profiled

  • Lupin Foods Australia
  • Prolupin
  • SIG Combibloc
  • PURIS
  • Made With Luv

Lupin Milk Market Segmentation by Category

By Product Type:

  • Plain
  • Flavored

By Source:

  • Organic
  • Conventional

By End-use Application:

  • Food & Beverages
  • Bakery and Confectionary
  • Personal Care
  • Retail Sales

By Distribution Channel:

  • Hypermarket/Supermarket
  • Convenience Stores
  • Wholesale Stores
  • Specialty Stores
  • B2B

By Region:

  • North America
  • Latin America
  • Europe
  • South Asia
  • East Asia
  • Oceania
  • Middle East and Africa

Frequently Asked Questions

How big is the lupin milk market?

The market is set to reach US$ 39.0 million in 2024.

What is the forecast for the lupin milk market?

Demand for lupin milk is slated to expand at a 9.8% CAGR by 2034.

What is the outlook for the lupin milk market?

The market is expected to reach US$ 66.6 million in 2034.

Who are the key players in the lupin milk market?

Lupin Foods Australia, Prolupin, and SIG Combibloc are the key players.

Which product type would lead the lupin milk market?

Plain segment is estimated to hold a significant market share in 2024.

Table of Content

1. Executive Summary

    1.1. Global Market Outlook

    1.2. Demand Side Trends

    1.3. Supply Side Trends

    1.4. Analysis and Recommendations

2. Market Overview

    2.1. Market Coverage / Taxonomy

    2.2. Market Definition

3. Global Market Outlook 

    3.1. Historical Market Size (in Value (US$ million) and Volume (Lit) Analysis, 2019 to 2023

    3.2. Current and Future Market Size (in Value (US$ million) and Volume (Lit) Analysis, 2024 to 2034

        3.2.1. Y-o-Y Growth Trend Analysis

        3.2.2. Absolute $ Opportunity Analysis

4. Market Dynamics

    4.1. Drivers

        4.1.1. Supply Side Drivers

        4.1.2. Demand Side drivers

        4.1.3. Economic Side Drivers

    4.2. Restraints

    4.3. Opportunity

    4.4. Market Trends by Region

    4.5. Forecast Factors - Relevance and Impact

    4.6. Regulations and Policies

5. Global Market - Pricing Analysis

    5.1. Price Point Assessment by Region

        5.1.1. Manufacturer-Level Pricing

        5.1.2. Distributor Level Pricing

        5.1.3. Retailer Level Pricing

    5.2. Price Point Assessment by Product Type

    5.3. Price Forecast till 2034

6. Value Chain Analysis

    6.1. Operating margins at each node of the supply chain

    6.2. List of Active Market Participants

7. Global Market Size (in Value (US$ million) and Volume (Lit) Analysis 2019 to 2023 and Forecast, 2024 to 2034

    7.1. Historical Market Size (in Value (US$ million) and Volume (Lit) Analysis, 2019 to 2023

    7.2. Current and Future Market Size (in Value (US$ million) and Volume (Lit) Analysis, 2024 to 2034

        7.2.1. Y-o-Y Growth Trend Analysis

        7.2.2. Absolute $ Opportunity Analysis

8. Global Market Analysis 2019 to 2023 and Forecast 2024 to 2034, by Product Type

    8.1. Introduction / Key Findings

    8.2. Historical Market Size (in Value (US$ million) and Volume (Lit) Analysis by Product Type, 2019 to 2023

    8.3. Current and Future Market Size (in Value (US$ million) and Volume (Lit) Analysis and Forecast by Product Type, 2024 to 2034

        8.3.1. Plain

        8.3.2. Flavored

    8.4. Market Attractiveness Analysis by Product Type

9. Global Market Analysis 2019 to 2023 and Forecast 2024 to 2034, Source

    9.1. Introduction / Key Findings

    9.2. Historical Market Size (in Value (US$ million) and Volume (Lit) Analysis by Source, 2019 to 2023

    9.3. Current and Future Market Size (in Value (US$ million) and Volume (Lit) Analysis and Forecast by Source, 2024 to 2034

        9.3.1. Organic

        9.3.2. Conventional

    9.4. Market Attractiveness Analysis by Source

10. Global Market Analysis 2019 to 2023 and Forecast 2024 to 2034, End-use Application

    10.1. Introduction / Key Findings

    10.2. Historical Market Size (in Value (US$ million) and Volume (Lit) Analysis by End-use Application, 2019 to 2023

    10.3. Current and Future Market Size (in Value (US$ million) and Volume (Lit) Analysis and Forecast by End-use Application, 2024 to 2034

        10.3.1. Food & Beverages

        10.3.2. Bakery and Confectionary

        10.3.3. Personal Care

        10.3.4. Retail Sales

    10.4. Market Attractiveness Analysis by End-use Application

11. Global Market Analysis 2019 to 2023 and Forecast 2024 to 2034, Distribution Channel

    11.1. Introduction / Key Findings

    11.2. Historical Market Size (in Value (US$ million) and Volume (Lit) Analysis by Distribution Channel, 2019 to 2023

    11.3. Current and Future Market Size (in Value (US$ million) and Volume (Lit) Analysis and Forecast by Distribution Channel, 2024 to 2034

        11.3.1. Hypermarket/Supermarket

            11.3.1.1. Convenience Stores

            11.3.1.2. Wholesale Stores

            11.3.1.3. Specialty Stores

            11.3.1.4. Online Retailers

            11.3.1.5. B2B

    11.4. Market Attractiveness Analysis by Distribution Channel

12. Global Market Analysis 2019 to 2023 and Forecast 2024 to 2034, by Region

    12.1. Introduction

    12.2. Historical Market Size (in Value (US$ million) and Volume (Lit) Analysis by Region, 2019 to 2023

    12.3. Current Market Size (in Value (US$ million) and Volume (Lit) Analysis and Forecast By Region, 2024 to 2034

        12.3.1. North America

        12.3.2. Latin America

        12.3.3. Europe

        12.3.4. East Asia

        12.3.5. South Asia

        12.3.6. Oceania

        12.3.7. Middle East and Africa

    12.4. Market Attractiveness Analysis by Region

13. North America Market Analysis 2019 to 2023 and Forecast 2024 to 2034

    13.1. Introduction

    13.2. Pricing Analysis

    13.3. Historical Market Size (US$ million) and Volume Trend Analysis by Market Taxonomy, 2019 to 2023

    13.4. Market Size (US$ million) and Volume Forecast by Market Taxonomy, 2024 to 2034

        13.4.1. By Country

            13.4.1.1. United States

            13.4.1.2. Canada

        13.4.2. by Product Type

        13.4.3. by Source

        13.4.4. by End-use Application

        13.4.5. by Distribution Channel

    13.5. Market Attractiveness Analysis

        13.5.1. By Country

        13.5.2. by Product Type

        13.5.3. by Source

        13.5.4. by End-use Application

        13.5.5. by Distribution Channel

    13.6. Key Takeaways

14. Latin America Market Analysis 2019 to 2023 and Forecast 2024 to 2034

    14.1. Introduction

    14.2. Pricing Analysis

    14.3. Historical Market Size (US$ million) and Volume Trend Analysis by Market Taxonomy, 2019 to 2023

    14.4. Market Size (US$ million) and Volume Forecast by Market Taxonomy, 2024 to 2034

        14.4.1. By Country

            14.4.1.1. Brazil

            14.4.1.2. Mexico

            14.4.1.3. Colombia

            14.4.1.4. Argentina

            14.4.1.5. Rest of Latin America

        14.4.2. by Product Type

        14.4.3. by Source

        14.4.4. by End-use Application

        14.4.5. by Distribution Channel

    14.5. Market Attractiveness Analysis

        14.5.1. By Country

        14.5.2. by Product Type

        14.5.3. by Source

        14.5.4. by End-use Application

        14.5.5. by Distribution Channel

    14.6. Key Takeaways

15. Europe Market Analysis 2019 to 2023 and Forecast 2024 to 2034

    15.1. Introduction

    15.2. Pricing Analysis

    15.3. Historical Market Size (US$ million) and Volume Trend Analysis by Market Taxonomy, 2019 to 2023

    15.4. Market Size (US$ million) and Volume Forecast by Market Taxonomy, 2024 to 2034

        15.4.1. By Country

            15.4.1.1. Germany

            15.4.1.2. United Kingdom

            15.4.1.3. France

            15.4.1.4. Italy

            15.4.1.5. Spain

            15.4.1.6. BENELUX

            15.4.1.7. Nordic

            15.4.1.8. Russia

            15.4.1.9. Poland

            15.4.1.10. Rest of Europe

        15.4.2. by Product Type

        15.4.3. by Source

        15.4.4. by End-use Application

        15.4.5. by Distribution Channel

    15.5. Market Attractiveness Analysis

        15.5.1. By Country

        15.5.2. by Product Type

        15.5.3. by Source

        15.5.4. by End-use Application

        15.5.5. by Distribution Channel

    15.6. Key Takeaways

16. East Asia Market Analysis 2019 to 2023 and Forecast 2024 to 2034

    16.1. Introduction

    16.2. Pricing Analysis

    16.3. Historical Market Size (US$ million) and Volume Trend Analysis by Market Taxonomy, 2019 to 2023

    16.4. Market Size (US$ million) and Volume Forecast by Market Taxonomy, 2024 to 2034

        16.4.1. By Country

            16.4.1.1. China

            16.4.1.2. Japan

            16.4.1.3. South Korea

        16.4.2. by Product Type

        16.4.3. by Source

        16.4.4. by End-use Application

        16.4.5. by Distribution Channel

    16.5. Market Attractiveness Analysis

        16.5.1. By Country

        16.5.2. by Product Type

        16.5.3. by Source

        16.5.4. by End-use Application

        16.5.5. by Distribution Channel

    16.6. Key Takeaways

17. South Asia Market Analysis 2019 to 2023 and Forecast 2024 to 2034

    17.1. Introduction

    17.2. Pricing Analysis

    17.3. Historical Market Size (US$ million) and Volume Trend Analysis by Market Taxonomy, 2019 to 2023

    17.4. Market Size (US$ million) and Volume Forecast by Market Taxonomy, 2024 to 2034

        17.4.1. By Country

            17.4.1.1. India

            17.4.1.2. Thailand

            17.4.1.3. Malaysia

            17.4.1.4. Indonesia

            17.4.1.5. Singapore

            17.4.1.6. Rest of South Asia

        17.4.2. by Product Type

        17.4.3. by Source

        17.4.4. by End-use Application

        17.4.5. by Distribution Channel

    17.5. Market Attractiveness Analysis

        17.5.1. By Country

        17.5.2. by Product Type

        17.5.3. by Source

        17.5.4. by End-use Application

        17.5.5. by Distribution Channel

    17.6. Key Takeaways

18. Oceania Market Analysis 2019 to 2023 and Forecast 2024 to 2034

    18.1. Introduction

    18.2. Pricing Analysis

    18.3. Historical Market Size (US$ million) and Volume Trend Analysis by Market Taxonomy, 2019 to 2023

    18.4. Market Size (US$ million) and Volume Forecast by Market Taxonomy, 2024 to 2034

        18.4.1. By Country

            18.4.1.1. Australia

            18.4.1.2. New Zealand

        18.4.2. by Product Type

        18.4.3. by Source

        18.4.4. by End-use Application

        18.4.5. by Distribution Channel

    18.5. Market Attractiveness Analysis

        18.5.1. By Country

        18.5.2. by Product Type

        18.5.3. by Source

        18.5.4. by End-use Application

        18.5.5. by Distribution Channel

    18.6. Key Takeaways

19. Middle East and Africa Market Analysis 2019 to 2023 and Forecast 2024 to 2034

    19.1. Introduction

    19.2. Pricing Analysis

    19.3. Historical Market Size (US$ million) and Volume Trend Analysis by Market Taxonomy, 2019 to 2023

    19.4. Market Size (US$ million) and Volume Forecast by Market Taxonomy, 2024 to 2034

        19.4.1. By Country

            19.4.1.1. UAE

            19.4.1.2. Saudi Arabia

            19.4.1.3. Other GCC Countries

            19.4.1.4. North Africa

            19.4.1.5. South Africa

            19.4.1.6. Central Africa

        19.4.2. by Product Type

        19.4.3. by Source

        19.4.4. by End-use Application

        19.4.5. by Distribution Channel

    19.5. Market Attractiveness Analysis

        19.5.1. By Country

        19.5.2. by Product Type

        19.5.3. by Source

        19.5.4. by End-use Application

        19.5.5. by Distribution Channel

    19.6. Key Takeaways

20. Country-level Market Analysis

    20.1. United States Market Analysis

        20.1.1. by Product Type

        20.1.2. by Source

        20.1.3. by End-use Application

        20.1.4. by Distribution Channel

    20.2. Canada Market Analysis

        20.2.1. by Product Type

        20.2.2. by Source

        20.2.3. by End-use Application

        20.2.4. by Distribution Channel

    20.3. Brazil Market Analysis

        20.3.1. by Product Type

        20.3.2. by Source

        20.3.3. by End-use Application

        20.3.4. by Distribution Channel

    20.4. Mexico Market Analysis

        20.4.1. by Product Type

        20.4.2. by Source

        20.4.3. by End-use Application

        20.4.4. by Distribution Channel

    20.5. Argentina Market Analysis

        20.5.1. by Product Type

        20.5.2. by Source

        20.5.3. by End-use Application

        20.5.4. by Distribution Channel

    20.6. Germany Market Analysis

        20.6.1. by Product Type

        20.6.2. by Source

        20.6.3. by End-use Application

        20.6.4. by Distribution Channel

    20.7. United Kingdom Market Analysis

        20.7.1. by Product Type

        20.7.2. by Source

        20.7.3. by End-use Application

        20.7.4. by Distribution Channel

    20.8. France Market Analysis

        20.8.1. by Product Type

        20.8.2. by Source

        20.8.3. by End-use Application

        20.8.4. by Distribution Channel

    20.9. Italy Market Analysis

        20.9.1. by Product Type

        20.9.2. by Source

        20.9.3. by End-use Application

        20.9.4. by Distribution Channel

    20.10. Spain Market Analysis

        20.10.1. by Product Type

        20.10.2. by Source

        20.10.3. by End-use Application

        20.10.4. by Distribution Channel

    20.11. BENELUX Market Analysis

        20.11.1. by Product Type

        20.11.2. by Source

        20.11.3. by End-use Application

        20.11.4. by Distribution Channel

    20.12. Nordic Market Analysis

        20.12.1. by Product Type

        20.12.2. by Source

        20.12.3. by End-use Application

        20.12.4. by Distribution Channel

    20.13. Russia Market Analysis

        20.13.1. by Product Type

        20.13.2. by Source

        20.13.3. by End-use Application

        20.13.4. by Distribution Channel

    20.14. Poland Market Analysis

        20.14.1. by Product Type

        20.14.2. by Source

        20.14.3. by End-use Application

        20.14.4. by Distribution Channel

    20.15. China Market Analysis

        20.15.1. by Product Type

        20.15.2. by Source

        20.15.3. by End-use Application

        20.15.4. by Distribution Channel

    20.16. Japan Market Analysis

        20.16.1. by Product Type

        20.16.2. by Source

        20.16.3. by End-use Application

        20.16.4. by Distribution Channel

    20.17. South Korea Market Analysis

        20.17.1. by Product Type

        20.17.2. by Source

        20.17.3. by End-use Application

        20.17.4. by Distribution Channel

    20.18. India Market Analysis

        20.18.1. by Product Type

        20.18.2. by Source

        20.18.3. by End-use Application

        20.18.4. by Distribution Channel

    20.19. Thailand Market Analysis

        20.19.1. by Product Type

        20.19.2. by Source

        20.19.3. by End-use Application

        20.19.4. by Distribution Channel

    20.20. Malaysia Market Analysis

        20.20.1. by Product Type

        20.20.2. by Source

        20.20.3. by End-use Application

        20.20.4. by Distribution Channel

    20.21. Indonesia Market Analysis

        20.21.1. by Product Type

        20.21.2. by Source

        20.21.3. by End-use Application

        20.21.4. by Distribution Channel

    20.22. Vietnam Market Analysis

        20.22.1. by Product Type

        20.22.2. by Source

        20.22.3. by End-use Application

        20.22.4. by Distribution Channel

    20.23. Philippines Market Analysis

        20.23.1. by Product Type

        20.23.2. by Source

        20.23.3. by End-use Application

        20.23.4. by Distribution Channel

    20.24. Singapore Market Analysis

        20.24.1. by Product Type

        20.24.2. by Source

        20.24.3. by End-use Application

        20.24.4. by Distribution Channel

    20.25. Australia Market Analysis

        20.25.1. by Product Type

        20.25.2. by Source

        20.25.3. by End-use Application

        20.25.4. by Distribution Channel

    20.26. New Zealand Market Analysis

        20.26.1. by Product Type

        20.26.2. by Source

        20.26.3. by End-use Application

        20.26.4. by Distribution Channel

    20.27. Turkiye Market Analysis

        20.27.1. by Product Type

        20.27.2. by Source

        20.27.3. by End-use Application

        20.27.4. by Distribution Channel

    20.28. Egypt Market Analysis

        20.28.1. by Product Type

        20.28.2. by Source

        20.28.3. by End-use Application

        20.28.4. by Distribution Channel

    20.29. South Africa Market Analysis

        20.29.1. by Product Type

        20.29.2. by Source

        20.29.3. by End-use Application

        20.29.4. by Distribution Channel

    20.30. GCC Countries Market Analysis

        20.30.1. by Product Type

        20.30.2. by Source

        20.30.3. by End-use Application

        20.30.4. by Distribution Channel

21. Market Structure Analysis

    21.1. Global Market Competition - a Dashboard View

    21.2. Industry Structure Analysis

        21.2.1. % tier 1 market players

        21.2.2. % tier 2 market players

        21.2.3. % tier 3 market players

    21.3. Global Market Company Share Analysis

        21.3.1. For Tier 1 Market Players, 2023

        21.3.2. Company Market Share Analysis of Top 5 Players, By Region

    21.4. Key Participants Market Presence (Intensity Mapping) by Region

22. Competition Analysis

    22.1. Competition Dashboard

    22.2. Competition Benchmarking

    22.3. Competition Deep Dive

        22.3.1. Lupin Foods Australia

            22.3.1.1. Product Portfolio

            22.3.1.2. Product Claim

            22.3.1.3. Revenue by Market Segments

            22.3.1.4. Sales Footprint

            22.3.1.5. Strategy Overview

            22.3.1.6. SWOT Analysis

        22.3.2. Prolupin

        22.3.3. SIG Combibloc

        22.3.4. PURIS

        22.3.5. Fraunhofer IVV

        22.3.6. Other Players (On Additional Requests)

23. Assumptions and Acronyms

24. Research Methodology

List of Tables

Table 1: Global Value (US$ million) Forecast by Region, 2019 to 2034

Table 2: Global Volume (MT) Forecast by Region, 2019 to 2034

Table 3: Global Value (US$ million) Forecast by Product Type, 2019 to 2034

Table 4: Global Volume (MT) Forecast by Product Type, 2019 to 2034

Table 5: Global Value (US$ million) Forecast by Source, 2019 to 2034

Table 6: Global Volume (MT) Forecast by Source, 2019 to 2034

Table 7: Global Value (US$ million) Forecast by End-use Application, 2019 to 2034

Table 8: Global Volume (MT) Forecast by End-use Application, 2019 to 2034

Table 9: Global Value (US$ million) Forecast by Distribution Channel, 2019 to 2034

Table 10: Global Volume (MT) Forecast by Distribution Channel, 2019 to 2034

Table 11: North America Value (US$ million) Forecast by Country, 2019 to 2034

Table 12: North America Volume (MT) Forecast by Country, 2019 to 2034

Table 13: North America Value (US$ million) Forecast by Product Type, 2019 to 2034

Table 14: North America Volume (MT) Forecast by Product Type, 2019 to 2034

Table 15: North America Value (US$ million) Forecast by Source, 2019 to 2034

Table 16: North America Volume (MT) Forecast by Source, 2019 to 2034

Table 17: North America Value (US$ million) Forecast by End-use Application, 2019 to 2034

Table 18: North America Volume (MT) Forecast by End-use Application, 2019 to 2034

Table 19: North America Value (US$ million) Forecast by Distribution Channel, 2019 to 2034

Table 20: North America Volume (MT) Forecast by Distribution Channel, 2019 to 2034

Table 21: Latin America Value (US$ million) Forecast by Country, 2019 to 2034

Table 22: Latin America Volume (MT) Forecast by Country, 2019 to 2034

Table 23: Latin America Value (US$ million) Forecast by Product Type, 2019 to 2034

Table 24: Latin America Volume (MT) Forecast by Product Type, 2019 to 2034

Table 25: Latin America Value (US$ million) Forecast by Source, 2019 to 2034

Table 26: Latin America Volume (MT) Forecast by Source, 2019 to 2034

Table 27: Latin America Value (US$ million) Forecast by End-use Application, 2019 to 2034

Table 28: Latin America Volume (MT) Forecast by End-use Application, 2019 to 2034

Table 29: Latin America Value (US$ million) Forecast by Distribution Channel, 2019 to 2034

Table 30: Latin America Volume (MT) Forecast by Distribution Channel, 2019 to 2034

Table 31: Europe Value (US$ million) Forecast by Country, 2019 to 2034

Table 32: Europe Volume (MT) Forecast by Country, 2019 to 2034

Table 33: Europe Value (US$ million) Forecast by Product Type, 2019 to 2034

Table 34: Europe Volume (MT) Forecast by Product Type, 2019 to 2034

Table 35: Europe Value (US$ million) Forecast by Source, 2019 to 2034

Table 36: Europe Volume (MT) Forecast by Source, 2019 to 2034

Table 37: Europe Value (US$ million) Forecast by End-use Application, 2019 to 2034

Table 38: Europe Volume (MT) Forecast by End-use Application, 2019 to 2034

Table 39: Europe Value (US$ million) Forecast by Distribution Channel, 2019 to 2034

Table 40: Europe Volume (MT) Forecast by Distribution Channel, 2019 to 2034

Table 41: East Asia Value (US$ million) Forecast by Country, 2019 to 2034

Table 42: East Asia Volume (MT) Forecast by Country, 2019 to 2034

Table 43: East Asia Value (US$ million) Forecast by Product Type, 2019 to 2034

Table 44: East Asia Volume (MT) Forecast by Product Type, 2019 to 2034

Table 45: East Asia Value (US$ million) Forecast by Source, 2019 to 2034

Table 46: East Asia Volume (MT) Forecast by Source, 2019 to 2034

Table 47: East Asia Value (US$ million) Forecast by End-use Application, 2019 to 2034

Table 48: East Asia Volume (MT) Forecast by End-use Application, 2019 to 2034

Table 49: East Asia Value (US$ million) Forecast by Distribution Channel, 2019 to 2034

Table 50: East Asia Volume (MT) Forecast by Distribution Channel, 2019 to 2034

Table 51: South Asia Value (US$ million) Forecast by Country, 2019 to 2034

Table 52: South Asia Volume (MT) Forecast by Country, 2019 to 2034

Table 53: South Asia Value (US$ million) Forecast by Product Type, 2019 to 2034

Table 54: South Asia Volume (MT) Forecast by Product Type, 2019 to 2034

Table 55: South Asia Value (US$ million) Forecast by Source, 2019 to 2034

Table 56: South Asia Volume (MT) Forecast by Source, 2019 to 2034

Table 57: South Asia Value (US$ million) Forecast by End-use Application, 2019 to 2034

Table 58: South Asia Volume (MT) Forecast by End-use Application, 2019 to 2034

Table 59: South Asia Value (US$ million) Forecast by Distribution Channel, 2019 to 2034

Table 60: South Asia Volume (MT) Forecast by Distribution Channel, 2019 to 2034

Table 61: Oceania Value (US$ million) Forecast by Country, 2019 to 2034

Table 62: Oceania Volume (MT) Forecast by Country, 2019 to 2034

Table 63: Oceania Value (US$ million) Forecast by Product Type, 2019 to 2034

Table 64: Oceania Volume (MT) Forecast by Product Type, 2019 to 2034

Table 65: Oceania Value (US$ million) Forecast by Source, 2019 to 2034

Table 66: Oceania Volume (MT) Forecast by Source, 2019 to 2034

Table 67: Oceania Value (US$ million) Forecast by End-use Application, 2019 to 2034

Table 68: Oceania Volume (MT) Forecast by End-use Application, 2019 to 2034

Table 69: Oceania Value (US$ million) Forecast by Distribution Channel, 2019 to 2034

Table 70: Oceania Volume (MT) Forecast by Distribution Channel, 2019 to 2034

Table 71: Middle East and Africa Value (US$ million) Forecast by Country, 2019 to 2034

Table 72: Middle East and Africa Volume (MT) Forecast by Country, 2019 to 2034

Table 73: Middle East and Africa Value (US$ million) Forecast by Product Type, 2019 to 2034

Table 74: Middle East and Africa Volume (MT) Forecast by Product Type, 2019 to 2034

Table 75: Middle East and Africa Value (US$ million) Forecast by Source, 2019 to 2034

Table 76: Middle East and Africa Volume (MT) Forecast by Source, 2019 to 2034

Table 77: Middle East and Africa Value (US$ million) Forecast by End-use Application, 2019 to 2034

Table 78: Middle East and Africa Volume (MT) Forecast by End-use Application, 2019 to 2034

Table 79: Middle East and Africa Value (US$ million) Forecast by Distribution Channel, 2019 to 2034

Table 80: Middle East and Africa Volume (MT) Forecast by Distribution Channel, 2019 to 2034

List of Charts

Figure 1: Global Market Value (US$ million) by Product Type, 2024 to 2034

Figure 2: Global Market Value (US$ million) by Source, 2024 to 2034

Figure 3: Global Market Value (US$ million) by End-use Application, 2024 to 2034

Figure 4: Global Market Value (US$ million) by Distribution Channel, 2024 to 2034

Figure 5: Global Market Value (US$ million) by Region, 2024 to 2034

Figure 6: Global Market Value (US$ million) Analysis by Region, 2019 to 2034

Figure 7: Global Market Volume (MT) Analysis by Region, 2019 to 2034

Figure 8: Global Market Value Share (%) and BPS Analysis by Region, 2024 to 2034

Figure 9: Global Market Y-o-Y Growth (%) Projections by Region, 2024 to 2034

Figure 10: Global Market Value (US$ million) Analysis by Product Type, 2019 to 2034

Figure 11: Global Market Volume (MT) Analysis by Product Type, 2019 to 2034

Figure 12: Global Market Value Share (%) and BPS Analysis by Product Type, 2024 to 2034

Figure 13: Global Market Y-o-Y Growth (%) Projections by Product Type, 2024 to 2034

Figure 14: Global Market Value (US$ million) Analysis by Source, 2019 to 2034

Figure 15: Global Market Volume (MT) Analysis by Source, 2019 to 2034

Figure 16: Global Market Value Share (%) and BPS Analysis by Source, 2024 to 2034

Figure 18: Global Market Y-o-Y Growth (%) Projections by Source, 2024 to 2034

Figure 18: Global Market Value (US$ million) Analysis by End-use Application, 2019 to 2034

Figure 19: Global Market Volume (MT) Analysis by End-use Application, 2019 to 2034

Figure 20: Global Market Value Share (%) and BPS Analysis by End-use Application, 2024 to 2034

Figure 22: Global Market Y-o-Y Growth (%) Projections by End-use Application, 2024 to 2034

Figure 23: Global Market Value (US$ million) Analysis by Distribution Channel, 2019 to 2034

Figure 23: Global Market Volume (MT) Analysis by Distribution Channel, 2019 to 2034

Figure 24: Global Market Value Share (%) and BPS Analysis by Distribution Channel, 2024 to 2034

Figure 25: Global Market Y-o-Y Growth (%) Projections by Distribution Channel, 2024 to 2034

Figure 26: Global Market Attractiveness by Product Type, 2024 to 2034

Figure 27: Global Market Attractiveness by Source, 2024 to 2034

Figure 28: Global Market Attractiveness by End-use Application, 2024 to 2034

Figure 29: Global Market Attractiveness by Distribution Channel, 2024 to 2034

Figure 30: Global Market Attractiveness by Region, 2024 to 2034

Figure 31: North America Market Value (US$ million) by Product Type, 2024 to 2034

Figure 33: North America Market Value (US$ million) by Source, 2024 to 2034

Figure 33: North America Market Value (US$ million) by End-use Application, 2024 to 2034

Figure 34: North America Market Value (US$ million) by Distribution Channel, 2024 to 2034

Figure 35: North America Market Value (US$ million) by Country, 2024 to 2034

Figure 36: North America Market Value (US$ million) Analysis by Country, 2019 to 2034

Figure 37: North America Market Volume (MT) Analysis by Country, 2019 to 2034

Figure 38: North America Market Value Share (%) and BPS Analysis by Country, 2024 to 2034

Figure 39: North America Market Y-o-Y Growth (%) Projections by Country, 2024 to 2034

Figure 40: North America Market Value (US$ million) Analysis by Product Type, 2019 to 2034

Figure 41: North America Market Volume (MT) Analysis by Product Type, 2019 to 2034

Figure 42: North America Market Value Share (%) and BPS Analysis by Product Type, 2024 to 2034

Figure 43: North America Market Y-o-Y Growth (%) Projections by Product Type, 2024 to 2034

Figure 44: North America Market Value (US$ million) Analysis by Source, 2019 to 2034

Figure 45: North America Market Volume (MT) Analysis by Source, 2019 to 2034

Figure 46: North America Market Value Share (%) and BPS Analysis by Source, 2024 to 2034

Figure 47: North America Market Y-o-Y Growth (%) Projections by Source, 2024 to 2034

Figure 48: North America Market Value (US$ million) Analysis by End-use Application, 2019 to 2034

Figure 49: North America Market Volume (MT) Analysis by End-use Application, 2019 to 2034

Figure 50: North America Market Value Share (%) and BPS Analysis by End-use Application, 2024 to 2034

Figure 51: North America Market Y-o-Y Growth (%) Projections by End-use Application, 2024 to 2034

Figure 52: North America Market Value (US$ million) Analysis by Distribution Channel, 2019 to 2034

Figure 53: North America Market Volume (MT) Analysis by Distribution Channel, 2019 to 2034

Figure 54: North America Market Value Share (%) and BPS Analysis by Distribution Channel, 2024 to 2034

Figure 55: North America Market Y-o-Y Growth (%) Projections by Distribution Channel, 2024 to 2034

Figure 56: North America Market Attractiveness by Product Type, 2024 to 2034

Figure 57: North America Market Attractiveness by Source, 2024 to 2034

Figure 58: North America Market Attractiveness by End-use Application, 2024 to 2034

Figure 59: North America Market Attractiveness by Distribution Channel, 2024 to 2034

Figure 60: North America Market Attractiveness by Country, 2024 to 2034

Figure 61: Latin America Market Value (US$ million) by Product Type, 2024 to 2034

Figure 62: Latin America Market Value (US$ million) by Source, 2024 to 2034

Figure 63: Latin America Market Value (US$ million) by End-use Application, 2024 to 2034

Figure 64: Latin America Market Value (US$ million) by Distribution Channel, 2024 to 2034

Figure 65: Latin America Market Value (US$ million) by Country, 2024 to 2034

Figure 66: Latin America Market Value (US$ million) Analysis by Country, 2019 to 2034

Figure 67: Latin America Market Volume (MT) Analysis by Country, 2019 to 2034

Figure 68: Latin America Market Value Share (%) and BPS Analysis by Country, 2024 to 2034

Figure 69: Latin America Market Y-o-Y Growth (%) Projections by Country, 2024 to 2034

Figure 70: Latin America Market Value (US$ million) Analysis by Product Type, 2019 to 2034

Figure 71: Latin America Market Volume (MT) Analysis by Product Type, 2019 to 2034

Figure 72: Latin America Market Value Share (%) and BPS Analysis by Product Type, 2024 to 2034

Figure 73: Latin America Market Y-o-Y Growth (%) Projections by Product Type, 2024 to 2034

Figure 74: Latin America Market Value (US$ million) Analysis by Source, 2019 to 2034

Figure 75: Latin America Market Volume (MT) Analysis by Source, 2019 to 2034

Figure 76: Latin America Market Value Share (%) and BPS Analysis by Source, 2024 to 2034

Figure 77: Latin America Market Y-o-Y Growth (%) Projections by Source, 2024 to 2034

Figure 78: Latin America Market Value (US$ million) Analysis by End-use Application, 2019 to 2034

Figure 79: Latin America Market Volume (MT) Analysis by End-use Application, 2019 to 2034

Figure 80: Latin America Market Value Share (%) and BPS Analysis by End-use Application, 2024 to 2034

Figure 81: Latin America Market Y-o-Y Growth (%) Projections by End-use Application, 2024 to 2034

Figure 82: Latin America Market Value (US$ million) Analysis by Distribution Channel, 2019 to 2034

Figure 83: Latin America Market Volume (MT) Analysis by Distribution Channel, 2019 to 2034

Figure 84: Latin America Market Value Share (%) and BPS Analysis by Distribution Channel, 2024 to 2034

Figure 85: Latin America Market Y-o-Y Growth (%) Projections by Distribution Channel, 2024 to 2034

Figure 86: Latin America Market Attractiveness by Product Type, 2024 to 2034

Figure 87: Latin America Market Attractiveness by Source, 2024 to 2034

Figure 88: Latin America Market Attractiveness by End-use Application, 2024 to 2034

Figure 89: Latin America Market Attractiveness by Distribution Channel, 2024 to 2034

Figure 90: Latin America Market Attractiveness by Country, 2024 to 2034

Figure 91: Europe Market Value (US$ million) by Product Type, 2024 to 2034

Figure 92: Europe Market Value (US$ million) by Source, 2024 to 2034

Figure 93: Europe Market Value (US$ million) by End-use Application, 2024 to 2034

Figure 94: Europe Market Value (US$ million) by Distribution Channel, 2024 to 2034

Figure 95: Europe Market Value (US$ million) by Country, 2024 to 2034

Figure 96: Europe Market Value (US$ million) Analysis by Country, 2019 to 2034

Figure 97: Europe Market Volume (MT) Analysis by Country, 2019 to 2034

Figure 98: Europe Market Value Share (%) and BPS Analysis by Country, 2024 to 2034

Figure 99: Europe Market Y-o-Y Growth (%) Projections by Country, 2024 to 2034

Figure 100: Europe Market Value (US$ million) Analysis by Product Type, 2019 to 2034

Figure 101: Europe Market Volume (MT) Analysis by Product Type, 2019 to 2034

Figure 102: Europe Market Value Share (%) and BPS Analysis by Product Type, 2024 to 2034

Figure 103: Europe Market Y-o-Y Growth (%) Projections by Product Type, 2024 to 2034

Figure 104: Europe Market Value (US$ million) Analysis by Source, 2019 to 2034

Figure 105: Europe Market Volume (MT) Analysis by Source, 2019 to 2034

Figure 106: Europe Market Value Share (%) and BPS Analysis by Source, 2024 to 2034

Figure 107: Europe Market Y-o-Y Growth (%) Projections by Source, 2024 to 2034

Figure 108: Europe Market Value (US$ million) Analysis by End-use Application, 2019 to 2034

Figure 109: Europe Market Volume (MT) Analysis by End-use Application, 2019 to 2034

Figure 110: Europe Market Value Share (%) and BPS Analysis by End-use Application, 2024 to 2034

Figure 111: Europe Market Y-o-Y Growth (%) Projections by End-use Application, 2024 to 2034

Figure 112: Europe Market Value (US$ million) Analysis by Distribution Channel, 2019 to 2034

Figure 113: Europe Market Volume (MT) Analysis by Distribution Channel, 2019 to 2034

Figure 114: Europe Market Value Share (%) and BPS Analysis by Distribution Channel, 2024 to 2034

Figure 115: Europe Market Y-o-Y Growth (%) Projections by Distribution Channel, 2024 to 2034

Figure 116: Europe Market Attractiveness by Product Type, 2024 to 2034

Figure 118: Europe Market Attractiveness by Source, 2024 to 2034

Figure 118: Europe Market Attractiveness by End-use Application, 2024 to 2034

Figure 119: Europe Market Attractiveness by Distribution Channel, 2024 to 2034

Figure 120: Europe Market Attractiveness by Country, 2024 to 2034

Figure 122: East Asia Market Value (US$ million) by Product Type, 2024 to 2034

Figure 123: East Asia Market Value (US$ million) by Source, 2024 to 2034

Figure 123: East Asia Market Value (US$ million) by End-use Application, 2024 to 2034

Figure 124: East Asia Market Value (US$ million) by Distribution Channel, 2024 to 2034

Figure 125: East Asia Market Value (US$ million) by Country, 2024 to 2034

Figure 126: East Asia Market Value (US$ million) Analysis by Country, 2019 to 2034

Figure 127: East Asia Market Volume (MT) Analysis by Country, 2019 to 2034

Figure 128: East Asia Market Value Share (%) and BPS Analysis by Country, 2024 to 2034

Figure 129: East Asia Market Y-o-Y Growth (%) Projections by Country, 2024 to 2034

Figure 130: East Asia Market Value (US$ million) Analysis by Product Type, 2019 to 2034

Figure 131: East Asia Market Volume (MT) Analysis by Product Type, 2019 to 2034

Figure 133: East Asia Market Value Share (%) and BPS Analysis by Product Type, 2024 to 2034

Figure 133: East Asia Market Y-o-Y Growth (%) Projections by Product Type, 2024 to 2034

Figure 134: East Asia Market Value (US$ million) Analysis by Source, 2019 to 2034

Figure 135: East Asia Market Volume (MT) Analysis by Source, 2019 to 2034

Figure 136: East Asia Market Value Share (%) and BPS Analysis by Source, 2024 to 2034

Figure 137: East Asia Market Y-o-Y Growth (%) Projections by Source, 2024 to 2034

Figure 138: East Asia Market Value (US$ million) Analysis by End-use Application, 2019 to 2034

Figure 139: East Asia Market Volume (MT) Analysis by End-use Application, 2019 to 2034

Figure 140: East Asia Market Value Share (%) and BPS Analysis by End-use Application, 2024 to 2034

Figure 141: East Asia Market Y-o-Y Growth (%) Projections by End-use Application, 2024 to 2034

Figure 142: East Asia Market Value (US$ million) Analysis by Distribution Channel, 2019 to 2034

Figure 143: East Asia Market Volume (MT) Analysis by Distribution Channel, 2019 to 2034

Figure 144: East Asia Market Value Share (%) and BPS Analysis by Distribution Channel, 2024 to 2034

Figure 145: East Asia Market Y-o-Y Growth (%) Projections by Distribution Channel, 2024 to 2034

Figure 146: East Asia Market Attractiveness by Product Type, 2024 to 2034

Figure 147: East Asia Market Attractiveness by Source, 2024 to 2034

Figure 148: East Asia Market Attractiveness by End-use Application, 2024 to 2034

Figure 149: East Asia Market Attractiveness by Distribution Channel, 2024 to 2034

Figure 150: East Asia Market Attractiveness by Country, 2024 to 2034

Figure 151: South Asia Market Value (US$ million) by Product Type, 2024 to 2034

Figure 152: South Asia Market Value (US$ million) by Source, 2024 to 2034

Figure 153: South Asia Market Value (US$ million) by End-use Application, 2024 to 2034

Figure 154: South Asia Market Value (US$ million) by Distribution Channel, 2024 to 2034

Figure 155: South Asia Market Value (US$ million) by Country, 2024 to 2034

Figure 156: South Asia Market Value (US$ million) Analysis by Country, 2019 to 2034

Figure 157: South Asia Market Volume (MT) Analysis by Country, 2019 to 2034

Figure 158: South Asia Market Value Share (%) and BPS Analysis by Country, 2024 to 2034

Figure 159: South Asia Market Y-o-Y Growth (%) Projections by Country, 2024 to 2034

Figure 160: South Asia Market Value (US$ million) Analysis by Product Type, 2019 to 2034

Figure 161: South Asia Market Volume (MT) Analysis by Product Type, 2019 to 2034

Figure 162: South Asia Market Value Share (%) and BPS Analysis by Product Type, 2024 to 2034

Figure 163: South Asia Market Y-o-Y Growth (%) Projections by Product Type, 2024 to 2034

Figure 164: South Asia Market Value (US$ million) Analysis by Source, 2019 to 2034

Figure 165: South Asia Market Volume (MT) Analysis by Source, 2019 to 2034

Figure 166: South Asia Market Value Share (%) and BPS Analysis by Source, 2024 to 2034

Figure 167: South Asia Market Y-o-Y Growth (%) Projections by Source, 2024 to 2034

Figure 168: South Asia Market Value (US$ million) Analysis by End-use Application, 2019 to 2034

Figure 169: South Asia Market Volume (MT) Analysis by End-use Application, 2019 to 2034

Figure 180: South Asia Market Value Share (%) and BPS Analysis by End-use Application, 2024 to 2034

Figure 181: South Asia Market Y-o-Y Growth (%) Projections by End-use Application, 2024 to 2034

Figure 182: South Asia Market Value (US$ million) Analysis by Distribution Channel, 2019 to 2034

Figure 183: South Asia Market Volume (MT) Analysis by Distribution Channel, 2019 to 2034

Figure 184: South Asia Market Value Share (%) and BPS Analysis by Distribution Channel, 2024 to 2034

Figure 185: South Asia Market Y-o-Y Growth (%) Projections by Distribution Channel, 2024 to 2034

Figure 186: South Asia Market Attractiveness by Product Type, 2024 to 2034

Figure 187: South Asia Market Attractiveness by Source, 2024 to 2034

Figure 188: South Asia Market Attractiveness by End-use Application, 2024 to 2034

Figure 189: South Asia Market Attractiveness by Distribution Channel, 2024 to 2034

Figure 180: South Asia Market Attractiveness by Country, 2024 to 2034

Figure 181: Oceania Market Value (US$ million) by Product Type, 2024 to 2034

Figure 182: Oceania Market Value (US$ million) by Source, 2024 to 2034

Figure 183: Oceania Market Value (US$ million) by End-use Application, 2024 to 2034

Figure 184: Oceania Market Value (US$ million) by Distribution Channel, 2024 to 2034

Figure 185: Oceania Market Value (US$ million) by Country, 2024 to 2034

Figure 186: Oceania Market Value (US$ million) Analysis by Country, 2019 to 2034

Figure 187: Oceania Market Volume (MT) Analysis by Country, 2019 to 2034

Figure 188: Oceania Market Value Share (%) and BPS Analysis by Country, 2024 to 2034

Figure 189: Oceania Market Y-o-Y Growth (%) Projections by Country, 2024 to 2034

Figure 190: Oceania Market Value (US$ million) Analysis by Product Type, 2019 to 2034

Figure 191: Oceania Market Volume (MT) Analysis by Product Type, 2019 to 2034

Figure 192: Oceania Market Value Share (%) and BPS Analysis by Product Type, 2024 to 2034

Figure 193: Oceania Market Y-o-Y Growth (%) Projections by Product Type, 2024 to 2034

Figure 194: Oceania Market Value (US$ million) Analysis by Source, 2019 to 2034

Figure 195: Oceania Market Volume (MT) Analysis by Source, 2019 to 2034

Figure 196: Oceania Market Value Share (%) and BPS Analysis by Source, 2024 to 2034

Figure 197: Oceania Market Y-o-Y Growth (%) Projections by Source, 2024 to 2034

Figure 198: Oceania Market Value (US$ million) Analysis by End-use Application, 2019 to 2034

Figure 199: Oceania Market Volume (MT) Analysis by End-use Application, 2019 to 2034

Figure 200: Oceania Market Value Share (%) and BPS Analysis by End-use Application, 2024 to 2034

Figure 201: Oceania Market Y-o-Y Growth (%) Projections by End-use Application, 2024 to 2034

Figure 202: Oceania Market Value (US$ million) Analysis by Distribution Channel, 2019 to 2034

Figure 203: Oceania Market Volume (MT) Analysis by Distribution Channel, 2019 to 2034

Figure 204: Oceania Market Value Share (%) and BPS Analysis by Distribution Channel, 2024 to 2034

Figure 205: Oceania Market Y-o-Y Growth (%) Projections by Distribution Channel, 2024 to 2034

Figure 206: Oceania Market Attractiveness by Product Type, 2024 to 2034

Figure 207: Oceania Market Attractiveness by Source, 2024 to 2034

Figure 208: Oceania Market Attractiveness by End-use Application, 2024 to 2034

Figure 209: Oceania Market Attractiveness by Distribution Channel, 2024 to 2034

Figure 220: Oceania Market Attractiveness by Country, 2024 to 2034

Figure 221: Middle East and Africa Market Value (US$ million) by Product Type, 2024 to 2034

Figure 222: Middle East and Africa Market Value (US$ million) by Source, 2024 to 2034

Figure 223: Middle East and Africa Market Value (US$ million) by End-use Application, 2024 to 2034

Figure 224: Middle East and Africa Market Value (US$ million) by Distribution Channel, 2024 to 2034

Figure 225: Middle East and Africa Market Value (US$ million) by Country, 2024 to 2034

Figure 226: Middle East and Africa Market Value (US$ million) Analysis by Country, 2019 to 2034

Figure 227: Middle East and Africa Market Volume (MT) Analysis by Country, 2019 to 2034

Figure 228: Middle East and Africa Market Value Share (%) and BPS Analysis by Country, 2024 to 2034

Figure 229: Middle East and Africa Market Y-o-Y Growth (%) Projections by Country, 2024 to 2034

Figure 230: Middle East and Africa Market Value (US$ million) Analysis by Product Type, 2019 to 2034

Figure 231: Middle East and Africa Market Volume (MT) Analysis by Product Type, 2019 to 2034

Figure 233: Middle East and Africa Market Value Share (%) and BPS Analysis by Product Type, 2024 to 2034

Figure 233: Middle East and Africa Market Y-o-Y Growth (%) Projections by Product Type, 2024 to 2034

Figure 234: Middle East and Africa Market Value (US$ million) Analysis by Source, 2019 to 2034

Figure 235: Middle East and Africa Market Volume (MT) Analysis by Source, 2019 to 2034

Figure 236: Middle East and Africa Market Value Share (%) and BPS Analysis by Source, 2024 to 2034

Figure 237: Middle East and Africa Market Y-o-Y Growth (%) Projections by Source, 2024 to 2034

Figure 238: Middle East and Africa Market Value (US$ million) Analysis by End-use Application, 2019 to 2034

Figure 239: Middle East and Africa Market Volume (MT) Analysis by End-use Application, 2019 to 2034

Figure 230: Middle East and Africa Market Value Share (%) and BPS Analysis by End-use Application, 2024 to 2034

Figure 231: Middle East and Africa Market Y-o-Y Growth (%) Projections by End-use Application, 2024 to 2034

Figure 233: Middle East and Africa Market Value (US$ million) Analysis by Distribution Channel, 2019 to 2034

Figure 233: Middle East and Africa Market Volume (MT) Analysis by Distribution Channel, 2019 to 2034

Figure 234: Middle East and Africa Market Value Share (%) and BPS Analysis by Distribution Channel, 2024 to 2034

Figure 235: Middle East and Africa Market Y-o-Y Growth (%) Projections by Distribution Channel, 2024 to 2034

Figure 236: Middle East and Africa Market Attractiveness by Product Type, 2024 to 2034

Figure 237: Middle East and Africa Market Attractiveness by Source, 2024 to 2034

Figure 238: Middle East and Africa Market Attractiveness by End-use Application, 2024 to 2034

Figure 239: Middle East and Africa Market Attractiveness by Distribution Channel, 2024 to 2034

Figure 240: Middle East and Africa Market Attractiveness by Country, 2024 to 2034

Recommendations

Food and Beverage

Almond Milk Market

Published : March 2024

Food and Beverage

Oat Milk Market

Published : June 2023

Food and Beverage

Goat Milk Products Market

Published : March 2023

Food and Beverage

Milk Ingredients Market

Published : October 2022

Explore Food and Beverage Insights

View Reports