The malonic acid market is valued at USD 62.6 million in 2025 and is projected to reach USD 109.0 million by 2035, rising at a 5.7% CAGR, with growth unfolding steadily over the forecast period. The shift is driven by increasing demand for pharmaceutical intermediates, particularly for active pharmaceutical ingredient (API) synthesis, and a growing emphasis on biodegradable polymers and sustainable resins in specialty chemical applications. Malonic acid serves as a crucial C3 building block, enabling efficient multi-step syntheses and chemical transformations in drug development. As demand for pharmaceutical-grade and bio-based malonic acid increases, the industry sees a move towards fermentation and biocatalytic production pathways, which are poised to contribute significantly to market expansion in the coming decade. The pharmaceutical intermediate segment, representing about 29.8% of demand, leads the charge, driven by its use in cardiovascular and antidiabetic drug precursors, and specialty APIs.
China and India lead market expansion with 6.3% and 6% CAGR, respectively, reflecting the growing pharmaceutical manufacturing capacity and generic drug production. The United States and Germany show steadier growth at 5.2% and 4.8%, supported by specialty chemical innovation, high-purity malonic acid demand, and regulatory compliance in pharmaceutical and polymer industries. Competition in the malonic acid market is shaped by established fine chemical manufacturers, with Hefei TNJ Chemical, Trace Zero LLC, and Shanghai Nanxiang Reagent maintaining a competitive edge through advanced purification technologies, bio-based production capabilities, and comprehensive regulatory documentation. The emerging competitive angle is not only based on price but also on bio-based technology development, purity advancements, and green chemistry practices.
A major driver of market expansion is the rising use of malonic acid in pharmaceutical applications. Malonic acid is an important intermediate in the synthesis of drugs such as barbiturates and various other compounds, including those used in the treatment of conditions like insomnia, anxiety, and epilepsy. As global healthcare demand rises and the need for efficient drug synthesis processes increases, pharmaceutical manufacturers are relying more on malonic acid as a versatile precursor in drug formulation. Its use in producing compounds with specific molecular structures makes it an essential building block for medicinal chemistry.
Malonic acid's role in the production of specialty chemicals and biopolymers further enhances its market potential. It is used in the production of high-performance materials such as biodegradable plastics and polymers, which are gaining traction due to their reduced environmental impact compared to conventional plastics. With growing concerns about plastic waste and a shift toward sustainable manufacturing, malonic acid is increasingly seen as a vital component in the development of eco-friendly biopolymers. These materials are widely used in packaging, medical products, and other consumer goods.
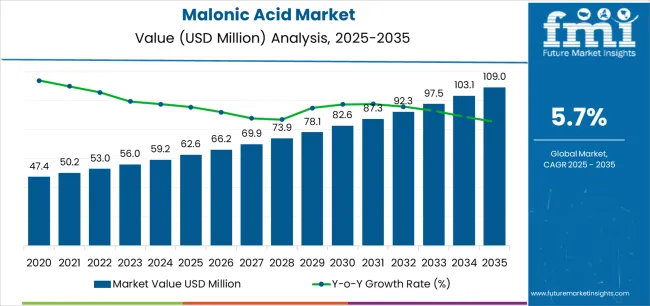
| Metric | Value |
|---|---|
| Estimated Value in (2025E) | USD 62.6 million |
| Forecast Value in (2035F) | USD 108.6 million |
| Forecast CAGR (2025 to 2035) | 5.7% |
Market expansion is being supported by the increasing global demand for pharmaceutical intermediates in active pharmaceutical ingredient synthesis and the corresponding need for versatile building blocks that can support diverse chemical transformations, enable efficient multi-step syntheses, and provide reliable quality across various drug development, generic manufacturing, and specialty pharmaceutical applications. Modern pharmaceutical synthesizers and fine chemical manufacturers are increasingly focused on implementing high-purity intermediates that can streamline synthetic routes, reduce reaction steps, and ensure consistent quality while meeting stringent pharmacopeial specifications. Malonic acid's proven ability to serve as a key building block in barbiturate synthesis, cardiovascular drug precursors, and specialty API production makes it an essential intermediate for contemporary pharmaceutical manufacturing.
The growing emphasis on sustainable materials and biodegradable polymers is driving demand for malonic acid in specialty resin production, polyester synthesis, and crosslinking applications that can support environmentally-friendly material development, reduce petroleum dependency, and provide performance characteristics suitable for specialty coatings and adhesives. Specialty polymer manufacturers' preference for renewable building blocks that combine functional versatility with sustainability credentials is creating opportunities for innovative malonic acid applications. The rising influence of green chemistry principles and bio-based production routes is also contributing to increased adoption of fermentation-derived malonic acid that can provide reduced carbon footprint without compromising chemical purity or synthetic utility in pharmaceutical and specialty chemical manufacturing.
The market is segmented by grade, application, material route, and region. By grade, the market is divided into technical grade (including standard technical, low-ash technical, and surface-treated technical), pharmaceutical grade (including API/intermediate qualified and high-purity), and food grade. Based on application, the market is categorized into pharmaceutical intermediate (including barbiturates/derivatives, cardiovascular/antidiabetic precursors, and specialty APIs), polymers & specialty resins, agrochemical synthesis, flavor & food additive, and others (including adhesives, corrosion inhibitors, electroplating, and lab reagents). By material route, the market covers synthetic (petro/acetyl cyanide routes) and bio-based (fermentation/biocatalytic). Regionally, the market is divided into Asia Pacific, North America, Europe, Latin America, and the Middle East & Africa.
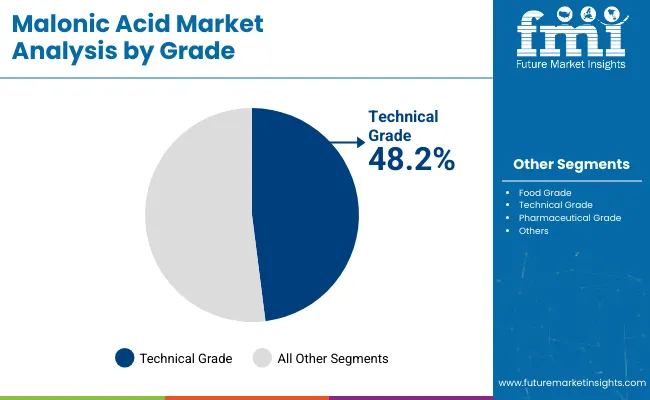
The technical grade segment is projected to maintain its leading position in the malonic acid market in 2025 with a commanding 48.2% market share, reaffirming its role as the preferred quality tier for industrial chemical synthesis, polymer production, and non-pharmaceutical applications requiring reliable chemical properties without ultra-high purity specifications.
Chemical manufacturers and polymer producers increasingly utilize technical grade malonic acid for its cost-effectiveness, consistent reactivity, and suitable quality standards across various specialty resin synthesis, agrochemical intermediate production, and industrial chemical applications where pharmaceutical-grade specifications are not mandated. Technical grade malonic acid's proven effectiveness in delivering reliable synthetic building block functionality directly addresses industrial requirements for efficient chemical processing and consistent performance in diverse manufacturing applications.
Within the technical grade segment, standard technical grade commands 33% of the total market, representing the mainstream specification for industrial synthesis and polymer applications. Low-ash technical accounts for 9.6% of the total market, serving applications requiring reduced inorganic content for specialized polymer and electronic materials. Surface-treated technical holds 5.6% of the total market, addressing specific handling and dispersion requirements. This grade segment forms the foundation of industrial malonic acid consumption across specialty chemicals, providing economical access to malonic acid chemistry for cost-sensitive applications while maintaining sufficient quality for industrial synthesis requirements.
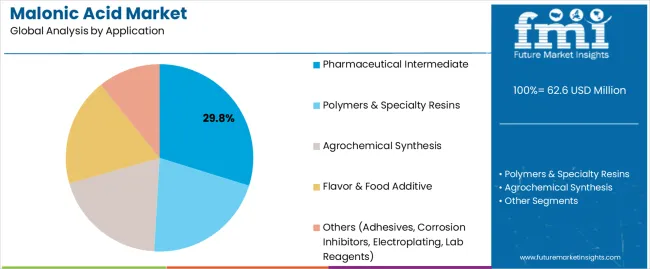
The pharmaceutical intermediate application segment is projected to represent the largest share of malonic acid demand in 2025 with 29.8% market share, underscoring its critical role as the primary driver for high-purity malonic acid adoption across active pharmaceutical ingredient synthesis, drug precursor production, and specialty pharmaceutical manufacturing. Pharmaceutical synthesizers prefer malonic acid for its versatile reactivity as a C3 building block, ability to participate in diverse synthetic transformations including condensations and alkylations, and well-established use in pharmaceutical chemistry supporting regulatory acceptance and synthetic pathway optimization. Positioned as an essential intermediate for pharmaceutical synthesis, malonic acid offers both synthetic utility advantages and quality assurance benefits.
Within the pharmaceutical intermediate segment, barbiturates and derivatives account for 12.8% of the total market, representing established pharmaceutical products requiring malonic acid as a key starting material. Cardiovascular and antidiabetic precursors hold 9.7% of the total market, addressing growing therapeutic areas with significant generic and specialty drug production. Specialty APIs command 7.3% of the total market, encompassing diverse pharmaceutical products utilizing malonic acid in synthetic routes. The segment is supported by continuous pharmaceutical innovation and growing availability of compendial-grade malonic acid meeting EP, USP, and BP specifications. As pharmaceutical manufacturing capacity expands globally and generic production increases, the pharmaceutical intermediate application will continue to dominate the market.
The synthetic material route segment commands the largest market share at 86% in 2025, reflecting its established position as the primary production pathway for malonic acid offering mature manufacturing processes, reliable supply, cost competitiveness, and scalable production capacity through well-established petrochemical and acetyl cyanide synthesis routes. Synthetic malonic acid production benefits from decades of process optimization, established manufacturing infrastructure, comprehensive quality control systems, and proven economics enabling competitive pricing across pharmaceutical, industrial, and specialty chemical applications. The widespread availability of raw materials, established supply chains, and technical expertise support synthetic pathway dominance across global markets.
Bio-based malonic acid accounts for 14% share, representing emerging fermentation and biocatalytic production pathways gaining traction among sustainability-focused customers and specialty applications seeking renewable carbon sourcing and reduced environmental footprint. The synthetic segment's leadership is reinforced by manufacturing scale advantages, comprehensive regulatory documentation, extensive application development, and economic competitiveness that enable broad market penetration. Major malonic acid suppliers maintain synthetic production as their core platform while selectively developing bio-based capabilities to address premium sustainability-focused segments and anticipate potential future regulatory drivers favoring renewable chemistry approaches in pharmaceutical and chemical manufacturing.
The malonic acid market is advancing steadily due to increasing pharmaceutical intermediate demand supporting active pharmaceutical ingredient synthesis and growing adoption of specialty chemical building blocks that provide synthetic versatility and reliable quality across diverse pharmaceutical, agrochemical, and polymer applications. However, the market faces challenges, including competition from alternative C3 building blocks and synthetic intermediates offering specialized functionality, price volatility of petrochemical feedstocks affecting synthetic route economics, and relatively small market size limiting investment in large-scale production capacity expansion and novel application development. Innovation in bio-based production technologies and ultra-high purity grades continues to influence product development and market expansion patterns.
The growing adoption of fermentation-based and biocatalytic production technologies is enabling malonic acid manufacturers to develop renewable alternatives to conventional petrochemical synthesis routes, supporting sustainability objectives, reducing carbon footprint, and addressing increasing customer preferences for bio-based chemical intermediates in pharmaceutical and specialty chemical applications. Advanced fermentation processes utilizing engineered microorganisms provide improved yields and selectivity while enabling valorization of renewable feedstocks including glucose, glycerol, and agricultural residues. Chemical companies are increasingly recognizing the strategic advantages of bio-based malonic acid for sustainability differentiation, regulatory positioning, and long-term feedstock security as renewable chemistry gains prominence across pharmaceutical and specialty chemical value chains.
Modern malonic acid manufacturers are incorporating advanced crystallization techniques, stringent heavy metal control systems, and comprehensive analytical validation programs to enhance product purity, meet evolving pharmacopeial specifications, and support pharmaceutical quality-by-design principles through optimized manufacturing controls and process analytical technology implementation. These technologies improve pharmaceutical-grade product quality while enabling compliance with EP, USP, BP, and other compendial standards requiring low impurity levels, controlled residual solvents, and comprehensive documentation. Advanced purification also allows manufacturers to serve comprehensive pharmaceutical quality requirements and differentiate products beyond commodity technical grades, creating competitive advantages in pharmaceutical intermediate markets and supporting premium pricing for ultra-high purity specifications addressing stringent pharmaceutical synthesis requirements.
The emergence of biodegradable polyester applications, specialty crosslinking agents, and advanced material formulations is creating new demand for malonic acid in sustainable polymer development, functional coatings, and specialty chemical applications requiring specific molecular structure and reactivity characteristics. These innovations enable materials scientists to develop environmentally-friendly alternatives to conventional petroleum-based polymers, create novel crosslinking systems for advanced coatings, and design specialty chemicals addressing emerging industrial requirements. Leading chemical companies are investing in application development programs that expand malonic acid utilization beyond traditional pharmaceutical intermediates, supporting market growth through diversification, enabling premium pricing in specialty applications, and building technical partnerships with innovative materials developers addressing sustainability-driven product development across coatings, adhesives, and specialty polymer markets.
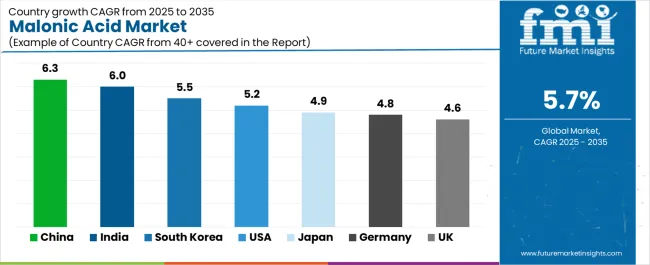
| Country | CAGR (2025-2035) |
|---|---|
| China | 6.3% |
| India | 6% |
| South Korea | 5.5% |
| USA | 5.2% |
| Japan | 4.9% |
| Germany | 4.8% |
| UK | 4.6% |
The malonic acid market is experiencing solid growth globally, with China leading at a 6.3% CAGR through 2035, driven by capacity additions for pharmaceutical and fine chemical manufacturing, expanding intermediate production serving domestic drug synthesis, and export-oriented chemical manufacturing supporting global pharmaceutical supply chains. India follows at 6%, supported by active pharmaceutical ingredient backward integration initiatives, cost-competitive toll manufacturing attracting international pharmaceutical companies, and expanding domestic generic pharmaceutical production. South Korea shows growth at 5.5%, emphasizing electronics materials development and polymer science research with specialty chemical innovation.
The United States records 5.2%, focusing on steady pharmaceutical research and development activity and specialty polymer pilot programs supporting sustainable materials development. Japan demonstrates 4.9% growth, supported by high-purity intermediates demand for pharmaceutical and electronics applications with stringent quality specifications. Germany exhibits 4.8% growth, emphasizing fine chemical manufacturing clusters and green chemistry adoption supporting sustainable synthesis. The United Kingdom shows 4.6% growth, supported by strong academic-industry collaboration pipelines in green synthesis and pharmaceutical innovation.
The report covers an in-depth analysis of 40+ countries, the top-performing countries are highlighted below.
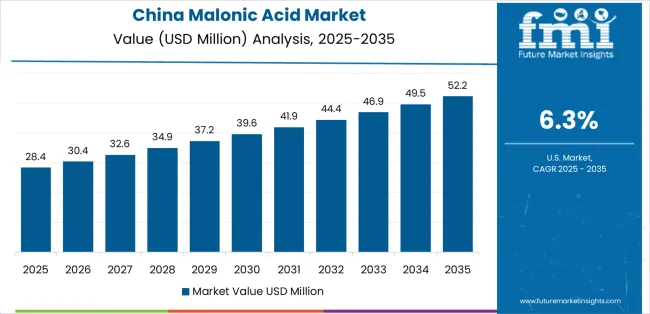
Revenue from malonic acid in China is projected to exhibit exceptional growth with a CAGR of 6.3% through 2035, driven by expanding pharmaceutical and fine chemical manufacturing capacity supporting domestic active pharmaceutical ingredient production and intermediate exports, growing domestic pharmaceutical market demanding diverse drug intermediates, and established chemical manufacturing infrastructure providing cost-competitive production platforms serving global customers.
The country's position as a major pharmaceutical intermediate supplier and expanding specialty chemical sector are creating substantial demand for malonic acid across pharmaceutical synthesis and industrial applications. Major Chinese chemical manufacturers and pharmaceutical intermediate producers are establishing comprehensive malonic acid production capabilities to serve both domestic pharmaceutical markets and international export opportunities.
Revenue from malonic acid in India is expanding at a CAGR of 6%, supported by the country's active pharmaceutical ingredient backward integration strategies reducing import dependency and strengthening domestic pharmaceutical supply chains, cost-competitive toll manufacturing infrastructure attracting international pharmaceutical development and production, and expanding generic pharmaceutical manufacturing serving domestic healthcare needs and global export markets. The country's established pharmaceutical industry and growing fine chemical capabilities are driving demand for pharmaceutical-grade malonic acid. International pharmaceutical companies and domestic chemical manufacturers are establishing extensive sourcing and production capabilities to address growing malonic acid demand.
Revenue from malonic acid in the United States is expanding at a CAGR of 5.2%, supported by the country's robust pharmaceutical research and development activity driving demand for specialty intermediates and chemical building blocks, specialty polymer pilot programs exploring biodegradable polyester applications and sustainable material development, and established fine chemical manufacturing infrastructure serving pharmaceutical and specialty chemical industries. The nation's innovation-driven pharmaceutical sector and advanced materials research are driving demand for high-purity malonic acid grades. Leading pharmaceutical companies and specialty chemical manufacturers are investing in comprehensive malonic acid supply chains to serve both pharmaceutical synthesis and materials innovation programs.
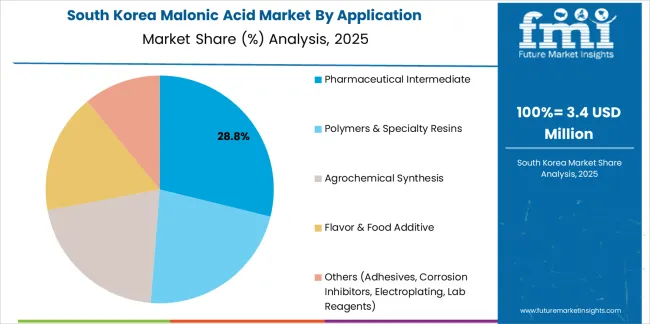
Revenue from malonic acid in South Korea is growing at a CAGR of 5.5%, driven by the country's advanced electronics materials development requiring high-purity chemical intermediates, polymer science research supporting specialty resin innovation and functional material development, and sophisticated fine chemical manufacturing capabilities serving pharmaceutical and specialty chemical applications. The country's technology-driven chemical sector and materials science expertise are supporting demand for specialized malonic acid applications. Korean chemical companies and research institutions are establishing comprehensive malonic acid application development capabilities to support materials innovation and pharmaceutical synthesis.
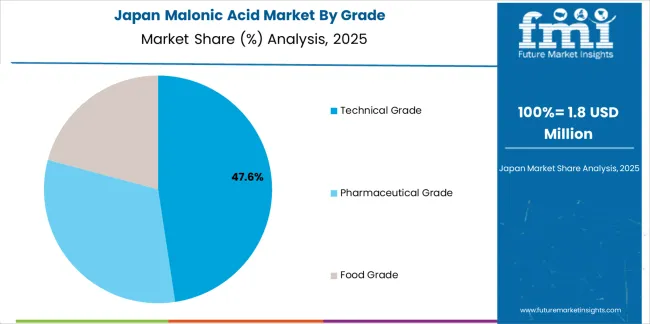
Revenue from malonic acid in Japan is expanding at a CAGR of 4.9%, supported by the country's demand for high-purity pharmaceutical intermediates meeting stringent quality specifications, electronics applications requiring ultra-clean chemical materials, and premium quality standards throughout pharmaceutical and specialty chemical supply chains. Japan's quality-focused pharmaceutical and electronics industries are driving demand for specialized malonic acid grades. Japanese pharmaceutical companies and fine chemical suppliers are investing in ultra-high purity malonic acid capabilities to serve domestic quality requirements.
Revenue from malonic acid in Germany is expanding at a CAGR of 4.8%, supported by the country's established fine chemical manufacturing clusters in Rhine-Ruhr and other regions, green chemistry adoption driving sustainable synthesis pathway development, and comprehensive pharmaceutical intermediate manufacturing serving European pharmaceutical industry. Germany's advanced chemical industry and sustainability focus are driving demand for pharmaceutical and technical grade malonic acid. Leading German chemical companies and pharmaceutical intermediate suppliers are investing in sustainable malonic acid production capabilities to serve European markets.
Revenue from malonic acid in the United Kingdom is growing at a CAGR of 4.6%, driven by the country's strong academic-industry collaboration pipelines supporting green synthesis research and sustainable chemistry development, pharmaceutical innovation activity across branded pharmaceuticals and specialty generics, and established fine chemical infrastructure serving pharmaceutical and specialty chemical sectors. The UK's research-intensive pharmaceutical sector and sustainability focus are supporting investment in advanced malonic acid applications. British pharmaceutical companies and research institutions are establishing collaborative programs advancing sustainable malonic acid utilization and novel synthetic applications.
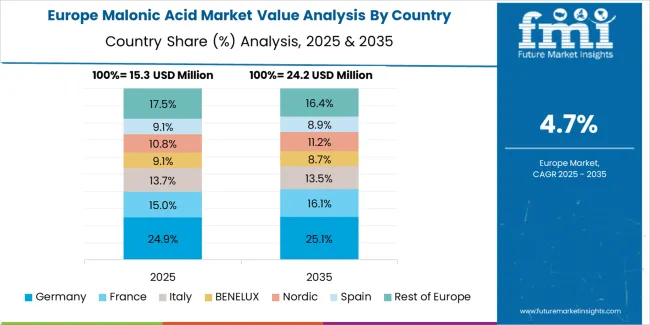
The malonic acid market in Europe is projected to grow from USD 17.5 million in 2025 to USD 28.2 million by 2035, registering a CAGR of 4.9% over the forecast period. Germany is expected to maintain its leadership position with a 24% market share in 2025, holding at 23.8% by 2035, supported by its pharmaceutical and fine chemical manufacturing hubs in Rhine-Ruhr region, strict EP/BP compliance requirements, and green synthesis pilot programs advancing bio-based production routes.
France follows with 16% in 2025, projected to reach 16.2% by 2035, driven by pharmaceutical intermediate production in Île-de-France region and specialty chemical manufacturing capabilities. The United Kingdom holds 14% in 2025, rising to 14.3% by 2035, supported by academic-industry collaboration in green chemistry and pharmaceutical innovation activity. Italy commands 12% in 2025, projected to reach 12.2% by 2035, driven by pharmaceutical manufacturing clusters in Lombardy and Emilia-Romagna regions. Spain accounts for 8% in 2025, expected to reach 8.2% by 2035, supported by growing pharmaceutical intermediate production.
Benelux maintains 7% in 2025, growing to 7.1% by 2035, driven by chemical distribution expertise and specialty chemical manufacturing. Nordic countries hold 6% in 2025, reaching 6.1% by 2035, supported by pharmaceutical research and sustainable chemistry initiatives. Central & Eastern Europe commands 9% in 2025, projected to reach 9.3% by 2035, driven by expanding pharmaceutical manufacturing and cost-competitive production capabilities. Rest of Europe holds 4% in 2025, moderating to 2.8% by 2035, attributed to diversified pharmaceutical and specialty chemical demand across emerging markets implementing advanced synthetic chemistry capabilities and pharmaceutical quality standards.
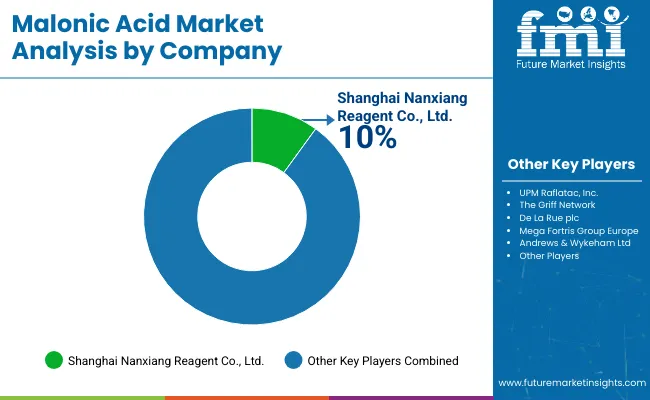
The malonic acid market is characterized by competition among established fine chemical manufacturers, pharmaceutical intermediate suppliers, and specialty chemical producers. Companies are investing in advanced purification technology research, quality assurance excellence, green chemistry development, and comprehensive product portfolios to deliver high-purity, consistent, and certified malonic acid solutions. Innovation in bio-based production routes, ultra-high purity pharmaceutical grades, and specialty application development is central to strengthening market position and competitive advantage.
Hefei TNJ Chemical Industry leads the market with a commanding 12% market share, offering comprehensive malonic acid solutions with advanced manufacturing capabilities, emphasizing pharmaceutical-grade production with stringent purity control and technical support across pharmaceutical intermediate, specialty chemical, and polymer applications. The company recently commissioned a new crystallization and purification train for pharmaceutical-grade malonic acid in 2025, enhancing high-purity output capacity and tightening heavy metal specifications to meet evolving pharmaceutical quality requirements. Trace Zero LLC provides innovative bio-based malonic acid through fermentation routes, having started a pilot program in 2024 to supply low-carbon intermediates for USA specialty polymer applications.
Shanghai Nanxiang Reagent Co., Ltd. specializes in multi-compendial malonic acid production, launching EP/USP compliant product lines in 2024 with validated residual solvent controls for API synthesis applications. TATEYAMA KASEI Co., Ltd. offers high-quality Japanese pharmaceutical-grade malonic acid with stringent quality specifications. Columbus Chemical Industries, Inc. provides North American specialty chemical supply with technical service capabilities.
Medical Chem Yancheng Manuf Co., Ltd. focuses on pharmaceutical intermediate manufacturing serving Asian markets. HeBei ChengXin delivers cost-competitive Chinese production for industrial applications. Shandong Xinhua Pharma specializes in pharmaceutical intermediates and fine chemicals. Merck KGaA (Sigma-Aldrich) offers laboratory-grade and analytical standards with global distribution. TCI (Tokyo Chemical Industry) provides research-grade chemicals and specialty intermediates.
Malonic acid represents a specialized C3 building block segment within pharmaceutical intermediates and specialty chemicals, projected to grow from USD 62.6 million in 2025 to USD 108.6 million by 2035 at a 5.7% CAGR. This dicarboxylic acid-primarily technical and pharmaceutical grades for synthesis applications-is produced through synthetic petrochemical routes and emerging bio-based fermentation pathways to serve as a versatile intermediate in barbiturate synthesis, cardiovascular drug precursors, biodegradable polyester production, agrochemical synthesis, and specialty chemical applications. Market expansion is driven by increasing pharmaceutical intermediate demand, growing specialty polymer development, expanding generic drug manufacturing, and rising emphasis on green chemistry approaches across pharmaceutical, agrochemical, and specialty chemical sectors.
How Chemical Regulators Could Strengthen Quality Standards and Supply Chain Security?
How Industry Associations Could Advance Technical Standards and Market Development?
How Malonic Acid Manufacturers Could Drive Innovation and Quality Excellence?
How Pharmaceutical Manufacturers Could Optimize Synthesis and Supply Chain Management?
How Specialty Chemical Developers Could Enhance Innovation and Market Expansion?
How Investors and Financial Enablers Could Support Market Growth and Technology Development?
| Items | Values |
|---|---|
| Quantitative Units (2025) | USD 62.6 million |
| Grade | Technical Grade (Standard Technical, Low-ash Technical, Surface-treated Technical), Pharmaceutical Grade (API/Intermediate Qualified, High-purity), Food Grade |
| Application | Pharmaceutical Intermediate (Barbiturates/Derivatives, Cardiovascular/Antidiabetic Precursors, Specialty APIs), Polymers & Specialty Resins, Agrochemical Synthesis, Flavor & Food Additive, Others (Adhesives, Corrosion Inhibitors, Electroplating, Lab Reagents) |
| Material Route | Synthetic (Petro/Acetyl Cyanide Routes), Bio-based (Fermentation/Biocatalytic) |
| Regions Covered | Asia Pacific, North America, Europe, Latin America, Middle East & Africa |
| Countries Covered | China, India, South Korea, United States, Japan, Germany, United Kingdom, and 40+ countries |
| Key Companies Profiled | Hefei TNJ Chemical, Trace Zero LLC, Shanghai Nanxiang Reagent, TATEYAMA KASEI, Columbus Chemical Industries |
| Additional Attributes | Dollar sales by grade, application, and material route categories, regional demand trends, competitive landscape, technological advancements in purification systems, bio-based production development, pharmaceutical quality optimization, and specialty application expansion |
The global malonic acid market is estimated to be valued at USD 62.6 million in 2025.
The market size for the malonic acid market is projected to reach USD 109.0 million by 2035.
The malonic acid market is expected to grow at a 5.7% CAGR between 2025 and 2035.
The key product types in malonic acid market are technical grade, pharmaceutical grade and food grade.
In terms of application, pharmaceutical intermediate segment to command 29.8% share in the malonic acid market in 2025.


Our Research Products

The "Full Research Suite" delivers actionable market intel, deep dives on markets or technologies, so clients act faster, cut risk, and unlock growth.

The Leaderboard benchmarks and ranks top vendors, classifying them as Established Leaders, Leading Challengers, or Disruptors & Challengers.

Locates where complements amplify value and substitutes erode it, forecasting net impact by horizon

We deliver granular, decision-grade intel: market sizing, 5-year forecasts, pricing, adoption, usage, revenue, and operational KPIs—plus competitor tracking, regulation, and value chains—across 60 countries broadly.

Spot the shifts before they hit your P&L. We track inflection points, adoption curves, pricing moves, and ecosystem plays to show where demand is heading, why it is changing, and what to do next across high-growth markets and disruptive tech

Real-time reads of user behavior. We track shifting priorities, perceptions of today’s and next-gen services, and provider experience, then pace how fast tech moves from trial to adoption, blending buyer, consumer, and channel inputs with social signals (#WhySwitch, #UX).

Partner with our analyst team to build a custom report designed around your business priorities. From analysing market trends to assessing competitors or crafting bespoke datasets, we tailor insights to your needs.
Supplier Intelligence
Discovery & Profiling
Capacity & Footprint
Performance & Risk
Compliance & Governance
Commercial Readiness
Who Supplies Whom
Scorecards & Shortlists
Playbooks & Docs
Category Intelligence
Definition & Scope
Demand & Use Cases
Cost Drivers
Market Structure
Supply Chain Map
Trade & Policy
Operating Norms
Deliverables
Buyer Intelligence
Account Basics
Spend & Scope
Procurement Model
Vendor Requirements
Terms & Policies
Entry Strategy
Pain Points & Triggers
Outputs
Pricing Analysis
Benchmarks
Trends
Should-Cost
Indexation
Landed Cost
Commercial Terms
Deliverables
Brand Analysis
Positioning & Value Prop
Share & Presence
Customer Evidence
Go-to-Market
Digital & Reputation
Compliance & Trust
KPIs & Gaps
Outputs
Full Research Suite comprises of:
Market outlook & trends analysis
Interviews & case studies
Strategic recommendations
Vendor profiles & capabilities analysis
5-year forecasts
8 regions and 60+ country-level data splits
Market segment data splits
12 months of continuous data updates
DELIVERED AS:
PDF EXCEL ONLINE
Acid Resistant Pipe Market Forecast and Outlook 2025 to 2035
Acid Coil Cleaner Market Size and Share Forecast Outlook 2025 to 2035
Acid Filling and Leveling Machine Market Size and Share Forecast Outlook 2025 to 2035
Acid Chlorides Market Size and Share Forecast Outlook 2025 to 2035
Acid-Sensitive APIs Market Analysis - Size, Share, and Forecast Outlook 2025 to 2035
Acidified Whey Protein Market Analysis - Size, Share & Trends 2025 to 2035
Acid Dyes Market Growth - Trends & Forecast 2025 to 2035
Acidity Regulator Market Growth - Trends & Forecast 2025 to 2035
Acid Proof Lining Market Trends 2025 to 2035
Acid Citrate Dextrose Tube Market Trends – Growth & Industry Outlook 2024-2034
Acid Orange Market
Antacids Market Analysis – Size, Trends & Forecast 2025 to 2035
Lead Acid Battery Market Size and Share Forecast Outlook 2025 to 2035
Lead Acid Battery Recycling Market Size and Share Forecast Outlook 2025 to 2035
Feed Acidifier Market Analysis Size Share and Forecast Outlook 2025 to 2035
Food Acidulants Market Growth - Key Trends, Size & Forecast 2024 to 2034
Nylon Acid Dye Fixing Agent Market Size and Share Forecast Outlook 2025 to 2035
Boric Acid Market Forecast and Outlook 2025 to 2035
Folic Acid Market Size and Share Forecast Outlook 2025 to 2035
Oleic Acid Market Size and Share Forecast Outlook 2025 to 2035

Thank you!
You will receive an email from our Business Development Manager. Please be sure to check your SPAM/JUNK folder too.
Chat With
MaRIA