Men's Grooming Products Market
Market Insights on Men's Grooming Products covering sales outlook, demand forecast & up-to-date key trends
Men's Grooming Products Market by Product Type, Distribution Channel & Region - Forecast 2022 - 2032
Men's Grooming Products Market Overview (2022-2032)
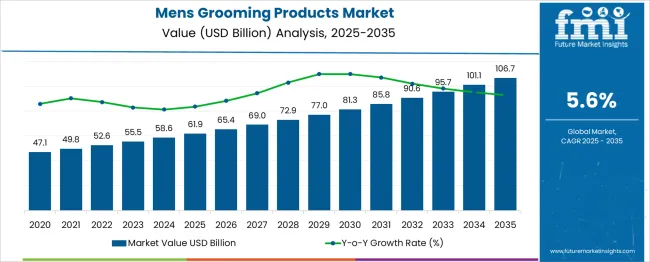
[250 Pages Report] The men's grooming products market is projected to witness a CAGR of 4.5% during the forecast period.
Revenue from the sales of men’s grooming products across the world is likely to become twice by 2032 from the present valuation of US$ 55.5 Bn.
Attributes |
Details |
Men's Grooming Products Market (CAGR) |
4.5% |
Men's Grooming Products Market (2021) |
US$ 55.5 Bn |
Let us know your requirement to get
100% FREE customization
What is the Impact of COVID-19 on Men's Grooming Products Market?
The men's grooming products market has been moderately affected by the COVID-19 pandemic since many social arrangement facilities and offices were closed.
Consequently, these factors have reduced the demand for men's grooming products, particularly shaving products. Another consequential trend in the men's grooming products market is the rise of do-it-yourself (DIY) grooming.
Many beauty salons have closed, and even in places where they have not, consumers are forgoing services because of concerns about close physical contact.
As a result, men are experimenting with their looks during the lockdown regime, which has marginally increased the sales of men's grooming products.
Which Factors are Driving Sales of Men’s Grooming Products?
The demand for natural, clean-label and organic goods in the men's grooming products market has surged as public awareness of the detrimental effects of chemical compounds often used in grooming items, such as shaving creams, has grown.
Males increasingly prefer natural grooming products to chemical-based grooming products. This has led to a rise in demand for men's grooming products and sales of products that are safe, natural, organic, and cruelty-free in recent years.
The rise in the trend of premiumization in demand for men's grooming products, with an increased impact of clean-label ingredients, has led to the high price of organic men's grooming products which may affect the sales of men's grooming products.
Furthermore, a rising number of primary producers in the men's grooming products market are hiring various celebrities from the domains of sports and entertainment to advocate their goods to persuade consumers to use these endorsed items and increase demand for men's grooming products as well as sales of men's grooming products.
P&G's Gillette, for example, used a variety of promotional techniques, including celebrity endorsement arrangements with Ashton Eaton, Neymar Jr., David Beckham, Roger Federer, and Ryan Lochte.
Find your sweet spots for generating winning opportunities in this market.
Talk to AnalystWhat is the Regional Outlook of the Men's Grooming Products Market?
Men in the Asia-Pacific area are growing more mindful of their appearance and anxious that an untidy, ungroomed look may harm their prospects of social and career success, resulting in increased demand for men's grooming goods and increased sales of men's grooming products.
The men's grooming products market, ranging from essential personal grooming items to skincare and cosmetics, has continued to witness a significant rise in demand for men's grooming products in China over the last several years.
Chinese millennials and the younger generation mainly drive the men's grooming products market; thus, the market is expected to increase significantly throughout the projection period.
In recent years, demand for men's grooming products has grown as Indian men have become more conscious of their appearance as a result of the rise of social media platforms such as Instagram and Facebook, where they are exposed to celebrity grooming routines and a plethora of new products that offer targeted solutions for escalated demand for men's grooming products as well as sales of men's grooming products.
The retail men's grooming products market has benefited from the growth in disposable income in the hands of the youth. Furthermore, due to the vast range in men's grooming products market available in various online retail shops such as Amazon, Flipkart (by Walmart), Nykaa, JioMart, and others, E-commerce helped raise sales of men's grooming products in India throughout 2020.
Which Region Offers the Largest Opportunity for Sales of Men’s Grooming Products?
North America is predicted to be the most attractive men's grooming products market producer, with an absolute dollar opportunity of roughly US$ 14,097.4 Mn.
The region's men's grooming products market has moved from a traditional concentration on shaving to a broader view of personal care in recent years.
As a consequence of the rising demand for a trimmed beard over a shaven look, consumers are adopting a variety of shaving practices, increasing sales of men's grooming products across the area.

A unified Market Research Subscription Platform, built for today's disparate research needs.
What is the Competitive Landscape of Men's Grooming Products Market?
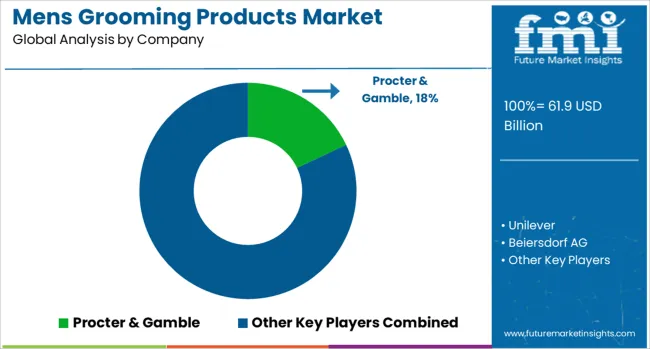
The men's grooming products market is highly competitive, with numerous regional players, small- and medium-scale players, and key international players such as Procter & Gamble Co., Beiersdorf AG, and L'Oréal SA.
The emergence of small-scale, private-label brands resulted from men having envisaged a connection with grooming products and having become more health-conscious than before. New product innovations and expansions are the key strategies the prominent men's grooming products market players adopt.
In January 2022, L'Oréal acquired the United States superfood skincare specialist Youth to the People in a move set to deepen ethical offerings in a very competitive men's grooming products market offerings.
In May 2020, Gillette launched King C. Gillette, a complete range of grooming and beard care products for men. The range was categorized into three sections such as shave and edge, trim, and care.
Scope Of Report
Report Attribute |
Details |
Growth rate |
CAGR of 4.5% from 2022 to 2032 |
Base year for estimation |
2021 |
Historical data |
2015 - 2020 |
Forecast period |
2022 - 2032 |
Quantitative units |
Revenue in USD million, volume in kilotons, and CAGR from 2022 to 2032 |
Report coverage |
Revenue forecast, volume forecast, company ranking, competitive landscape, growth factors, and trends, Pricing Analysis, |
Segments covered |
Product Type, Distribution Channel, Region |
Regional scope |
North America; Western Europe, Eastern Europe, Middle East, Africa, ASEAN, South Asia, Rest of Asia, Australia and New Zealand |
Country scope |
U.S.; Canada; Mexico; Germany; U.K.; France; Italy; Spain; Russia; Belgium; Poland; Czech Republic; China; India; Japan; Australia; Brazil; Argentina; Colombia; Saudi Arabia; UAE; Iran; South Africa |
Key companies profiled |
Edgewell Personal Care Co, The Estée Lauder Companies Inc., The Kroger Co, Coty, Inc., L'Oréal S.A., Johnson & Johnson Consumer Inc., and Koninklijke Philips N.V. |
Customization scope |
Free report customization (equivalent to up to 8 analysts working days) with purchase. Addition or alteration to country, regional & segment scope. |
Pricing and purchase options |
Avail customized purchase options to meet your exact research needs. |
Frequently Asked Questions
What is the Growth Outlook for the Men’s Grooming Products Market?
The men’s grooming products market is forecasted to register a CAGR of 4.5% during the forecast period.
Who are the Key Players in the Men’s Grooming Products Market?
Edgewell Personal Care Co, The Estée Lauder Companies Inc., The Kroger Co, Coty, Inc., L'Oréal S.A., Johnson & Johnson Consumer Inc., and Koninklijke Philips N.V.
Which Region Offers the Largest Opportunity for Sales of Men’s Grooming Products?
With an absolute dollar opportunity US$ 14,097.4 Mn, North America is expected to be lucrative for men’s grooming products market.
Will Online Retailing become the Most Prominent Sales Channel for Men’s Grooming Products?
Online retailing is expected to dominate over the men’s grooming products market at a high CAGR of 8.4%.
Table of Content
1. Executive Summary 1.1. Global Market Outlook 1.2. Demand-side Trends 1.3. Supply-side Trends 1.4. Technology Roadmap Analysis 1.5. Analysis and Recommendations 2. Market Overview 2.1. Market Coverage / Taxonomy 2.2. Market Definition / Scope / Limitations 3. Market Background 3.1. Market Dynamics 3.1.1. Drivers 3.1.2. Restraints 3.1.3. Opportunity 3.1.4. Trends 3.2. Scenario Forecast 3.2.1. Demand in Optimistic Scenario 3.2.2. Demand in Likely Scenario 3.2.3. Demand in Conservative Scenario 3.3. Opportunity Map Analysis 3.4. Investment Feasibility Matrix 3.5. PESTLE and Porter’s Analysis 3.6. Regulatory Landscape 3.6.1. By Key Regions 3.6.2. By Key Countries 4. Global Market Analysis 2017-2021 and Forecast, 2022-2032 4.1. Historical Market Size Value (US$ Mn) & Volume (Units) Analysis, 2017-2021 4.2. Current and Future Market Size Value (US$ Mn) & Volume (Units) Projections, 2022-2032 4.2.1. Y-o-Y Growth Trend Analysis 4.2.2. Absolute $ Opportunity Analysis 5. Global Market Analysis 2017-2021 and Forecast 2022-2032, By Product Type 5.1. Introduction / Key Findings 5.2. Historical Market Size Value (US$ Mn) & Volume (Units) Analysis By Product Type, 2017-2021 5.3. Current and Future Market Size Value (US$ Mn) & Volume (Units) Analysis and Forecast By Product Type, 2022-2032 5.3.1. Shave Care 5.3.2. Skin Care 5.3.3. Hair Care 5.3.4. Toiletries 5.3.5. Fragrance 5.3.6. Color Cosmetics 5.4. Y-o-Y Growth Trend Analysis By Product Type, 2017-2021 5.5. Absolute $ Opportunity Analysis By Product Type, 2022-2032 6. Global Market Analysis 2017-2021 and Forecast 2022-2032, By Nature 6.1. Introduction / Key Findings 6.2. Historical Market Size Value (US$ Mn) & Volume (Units) Analysis By Nature , 2017-2021 6.3. Current and Future Market Size Value (US$ Mn) & Volume (Units) Analysis and Forecast By Nature , 2022-2032 6.3.1. Natural/Organic 6.3.2. Conventional 6.4. Y-o-Y Growth Trend Analysis By Nature , 2017-2021 6.5. Absolute $ Opportunity Analysis By Nature , 2022-2032 7. Global Market Analysis 2017-2021 and Forecast 2022-2032, By Price Range 7.1. Introduction / Key Findings 7.2. Historical Market Size Value (US$ Mn) & Volume (Units) Analysis By Price Range , 2017-2021 7.3. Current and Future Market Size Value (US$ Mn) & Volume (Units) Analysis and Forecast By Price Range , 2022-2032 7.3.1. Economy 7.3.2. Mid-Range 7.3.3. Premium 7.4. Y-o-Y Growth Trend Analysis By Price Range , 2017-2021 7.5. Absolute $ Opportunity Analysis By Price Range , 2022-2032 8. Global Market Analysis 2017-2021 and Forecast 2022-2032, By Packaging Type 8.1. Introduction / Key Findings 8.2. Historical Market Size Value (US$ Mn) & Volume (Units) Analysis By Packaging Type , 2017-2021 8.3. Current and Future Market Size Value (US$ Mn) & Volume (Units) Analysis and Forecast By Packaging Type , 2022-2032 8.3.1. Jars 8.3.2. Tubes 8.3.3. Bottles 8.3.4. Pumps & Dispensers 8.3.5. Airless 8.3.6. Sachets 8.3.7. Others 8.4. Y-o-Y Growth Trend Analysis By Packaging Type , 2017-2021 8.5. Absolute $ Opportunity Analysis By Packaging Type , 2022-2032 9. Global Market Analysis 2017-2021 and Forecast 2022-2032, By Sales Channels 9.1. Introduction / Key Findings 9.2. Historical Market Size Value (US$ Mn) & Volume (Units) Analysis By Sales Channels , 2017-2021 9.3. Current and Future Market Size Value (US$ Mn) & Volume (Units) Analysis and Forecast By Sales Channels , 2022-2032 9.3.1. Wholesalers/Distributors 9.3.2. Hypermarkets/Supermarkets 9.3.3. Multi-Brand Stores 9.3.4. Exclusive Stores/ Franchise Outlets 9.3.5. Beauty Specialist Salons 9.3.6. Independent Small Stores 9.3.7. Online Retailer 9.3.8. Others 9.4. Y-o-Y Growth Trend Analysis By Sales Channels , 2017-2021 9.5. Absolute $ Opportunity Analysis By Sales Channels , 2022-2032 10. Global Market Analysis 2017-2021 and Forecast 2022-2032, By Region 10.1. Introduction 10.2. Historical Market Size Value (US$ Mn) & Volume (Units) Analysis By Region, 2017-2021 10.3. Current Market Size Value (US$ Mn) & Volume (Units) Analysis and Forecast By Region, 2022-2032 10.3.1. North America 10.3.2. Latin America 10.3.3. Europe 10.3.4. Asia Pacific 10.3.5. MEA 10.4. Market Attractiveness Analysis By Region 11. North America Market Analysis 2017-2021 and Forecast 2022-2032, By Country 11.1. Historical Market Size Value (US$ Mn) & Volume (Units) Trend Analysis By Market Taxonomy, 2017-2021 11.2. Market Size Value (US$ Mn) & Volume (Units) Forecast By Market Taxonomy, 2022-2032 11.2.1. By Country 11.2.1.1. U.S. 11.2.1.2. Canada 11.2.2. By Product Type 11.2.3. By Nature 11.2.4. By Price Range 11.2.5. By Packaging Type 11.2.6. By Sales Channels 11.3. Market Attractiveness Analysis 11.3.1. By Country 11.3.2. By Product Type 11.3.3. By Nature 11.3.4. By Price Range 11.3.5. By Packaging Type 11.3.6. By Sales Channels 11.4. Key Takeaways 12. Latin America Market Analysis 2017-2021 and Forecast 2022-2032, By Country 12.1. Historical Market Size Value (US$ Mn) & Volume (Units) Trend Analysis By Market Taxonomy, 2017-2021 12.2. Market Size Value (US$ Mn) & Volume (Units) Forecast By Market Taxonomy, 2022-2032 12.2.1. By Country 12.2.1.1. Brazil 12.2.1.2. Mexico 12.2.1.3. Rest of Latin America 12.2.2. By Product Type 12.2.3. By Nature 12.2.4. By Price Range 12.2.5. By Packaging Type 12.2.6. By Sales Channels 12.3. Market Attractiveness Analysis 12.3.1. By Country 12.3.2. By Product Type 12.3.3. By Nature 12.3.4. By Price Range 12.3.5. By Packaging Type 12.3.6. By Sales Channels 12.4. Key Takeaways 13. Europe Market Analysis 2017-2021 and Forecast 2022-2032, By Country 13.1. Historical Market Size Value (US$ Mn) & Volume (Units) Trend Analysis By Market Taxonomy, 2017-2021 13.2. Market Size Value (US$ Mn) & Volume (Units) Forecast By Market Taxonomy, 2022-2032 13.2.1. By Country 13.2.1.1. Germany 13.2.1.2. Italy 13.2.1.3. France 13.2.1.4. U.K. 13.2.1.5. Spain 13.2.1.6. Russia 13.2.1.7. BENELUX 13.2.1.8. Rest of Europe 13.2.2. By Product Type 13.2.3. By Nature 13.2.4. By Price Range 13.2.5. By Packaging Type 13.2.6. By Sales Channels 13.3. Market Attractiveness Analysis 13.3.1. By Country 13.3.2. By Product Type 13.3.3. By Nature 13.3.4. By Price Range 13.3.5. By Packaging Type 13.3.6. By Sales Channels 13.4. Key Takeaways 14. Asia Pacific Market Analysis 2017-2021 and Forecast 2022-2032, By Country 14.1. Historical Market Size Value (US$ Mn) & Volume (Units) Trend Analysis By Market Taxonomy, 2017-2021 14.2. Market Size Value (US$ Mn) & Volume (Units) Forecast By Market Taxonomy, 2022-2032 14.2.1. By Country 14.2.1.1. China 14.2.1.2. Japan 14.2.1.3. South Korea 14.2.1.4. India 14.2.1.5. Rest of Asia Pacific 14.2.2. By Product Type 14.2.3. By Nature 14.2.4. By Price Range 14.2.5. By Packaging Type 14.2.6. By Sales Channels 14.3. Market Attractiveness Analysis 14.3.1. By Country 14.3.2. By Product Type 14.3.3. By Nature 14.3.4. By Price Range 14.3.5. By Packaging Type 14.3.6. By Sales Channels 14.4. Key Takeaways 15. MEA Market Analysis 2017-2021 and Forecast 2022-2032, By Country 15.1. Historical Market Size Value (US$ Mn) & Volume (Units) Trend Analysis By Market Taxonomy, 2017-2021 15.2. Market Size Value (US$ Mn) & Volume (Units) Forecast By Market Taxonomy, 2022-2032 15.2.1. By Country 15.2.1.1. GCC 15.2.1.2. Rest of MEA 15.2.2. By Product Type 15.2.3. By Nature 15.2.4. By Price Range 15.2.5. By Packaging Type 15.2.6. By Sales Channels 15.3. Market Attractiveness Analysis 15.3.1. By Country 15.3.2. By Product Type 15.3.3. By Nature 15.3.4. By Price Range 15.3.5. By Packaging Type 15.3.6. By Sales Channels 15.4. Key Takeaways 16. Key Countries Market Analysis 16.1. U.S. 16.1.1. Pricing Analysis 16.1.2. Market Share Analysis, 2021 16.1.2.1. By Product Type 16.1.2.2. By Nature 16.1.2.3. By Price Range 16.1.2.4. By Packaging Type 16.1.2.5. By Sales Channels 16.2. Canada 16.2.1. Pricing Analysis 16.2.2. Market Share Analysis, 2021 16.2.2.1. By Product Type 16.2.2.2. By Nature 16.2.2.3. By Price Range 16.2.2.4. By Packaging Type 16.2.2.5. By Sales Channels 16.3. Brazil 16.3.1. Pricing Analysis 16.3.2. Market Share Analysis, 2021 16.3.2.1. By Product Type 16.3.2.2. By Nature 16.3.2.3. By Price Range 16.3.2.4. By Packaging Type 16.3.2.5. By Sales Channels 16.4. Mexico 16.4.1. Pricing Analysis 16.4.2. Market Share Analysis, 2021 16.4.2.1. By Product Type 16.4.2.2. By Nature 16.4.2.3. By Price Range 16.4.2.4. By Packaging Type 16.4.2.5. By Sales Channels 16.5. Argentina 16.5.1. Pricing Analysis 16.5.2. Market Share Analysis, 2021 16.5.2.1. By Product Type 16.5.2.2. By Nature 16.5.2.3. By Price Range 16.5.2.4. By Packaging Type 16.5.2.5. By Sales Channels 16.6. Germany 16.6.1. Pricing Analysis 16.6.2. Market Share Analysis, 2021 16.6.2.1. By Product Type 16.6.2.2. By Nature 16.6.2.3. By Price Range 16.6.2.4. By Packaging Type 16.6.2.5. By Sales Channels 16.7. Italy 16.7.1. Pricing Analysis 16.7.2. Market Share Analysis, 2021 16.7.2.1. By Product Type 16.7.2.2. By Nature 16.7.2.3. By Price Range 16.7.2.4. By Packaging Type 16.7.2.5. By Sales Channels 16.8. France 16.8.1. Pricing Analysis 16.8.2. Market Share Analysis, 2021 16.8.2.1. By Product Type 16.8.2.2. By Nature 16.8.2.3. By Price Range 16.8.2.4. By Packaging Type 16.8.2.5. By Sales Channels 16.9. U.K. 16.9.1. Pricing Analysis 16.9.2. Market Share Analysis, 2021 16.9.2.1. By Product Type 16.9.2.2. By Nature 16.9.2.3. By Price Range 16.9.2.4. By Packaging Type 16.9.2.5. By Sales Channels 16.10. Spain 16.10.1. Pricing Analysis 16.10.2. Market Share Analysis, 2021 16.10.2.1. By Product Type 16.10.2.2. By Nature 16.10.2.3. By Price Range 16.10.2.4. By Packaging Type 16.10.2.5. By Sales Channels 16.11. Russia 16.11.1. Pricing Analysis 16.11.2. Market Share Analysis, 2021 16.11.2.1. By Product Type 16.11.2.2. By Nature 16.11.2.3. By Price Range 16.11.2.4. By Packaging Type 16.11.2.5. By Sales Channels 16.12. BENELUX 16.12.1. Pricing Analysis 16.12.2. Market Share Analysis, 2021 16.12.2.1. By Product Type 16.12.2.2. By Nature 16.12.2.3. By Price Range 16.12.2.4. By Packaging Type 16.12.2.5. By Sales Channels 16.13. China 16.13.1. Pricing Analysis 16.13.2. Market Share Analysis, 2021 16.13.2.1. By Product Type 16.13.2.2. By Nature 16.13.2.3. By Price Range 16.13.2.4. By Packaging Type 16.13.2.5. By Sales Channels 16.14. Japan 16.14.1. Pricing Analysis 16.14.2. Market Share Analysis, 2021 16.14.2.1. By Product Type 16.14.2.2. By Nature 16.14.2.3. By Price Range 16.14.2.4. By Packaging Type 16.14.2.5. By Sales Channels 16.15. South Korea 16.15.1. Pricing Analysis 16.15.2. Market Share Analysis, 2021 16.15.2.1. By Product Type 16.15.2.2. By Nature 16.15.2.3. By Price Range 16.15.2.4. By Packaging Type 16.15.2.5. By Sales Channels 16.16. India 16.16.1. Pricing Analysis 16.16.2. Market Share Analysis, 2021 16.16.2.1. By Product Type 16.16.2.2. By Nature 16.16.2.3. By Price Range 16.16.2.4. By Packaging Type 16.16.2.5. By Sales Channels 16.17. GCC Countries 16.17.1. Pricing Analysis 16.17.2. Market Share Analysis, 2021 16.17.2.1. By Product Type 16.17.2.2. By Nature 16.17.2.3. By Price Range 16.17.2.4. By Packaging Type 16.17.2.5. By Sales Channels 17. Market Structure Analysis 17.1. Competition Dashboard 17.2. Competition Benchmarking 17.3. Market Share Analysis of Top Players 17.3.1. By Regional 17.3.2. By Product Type 17.3.3. By Nature 17.3.4. By Price Range 17.3.5. By Packaging Type 17.3.6. By Sales Channels 18. Competition Analysis 18.1. Competition Deep Dive 18.1.1. Coty, Inc. 18.1.1.1. Overview 18.1.1.2. Product Portfolio 18.1.1.3. Profitability by Market Segment 18.1.1.4. Sales Footprint 18.1.1.5. Strategy Overview 18.1.1.5.1. Marketing Strategy 18.1.1.5.2. Product Strategy 18.1.2. Procter & Gamble Co. 18.1.2.1. Overview 18.1.2.2. Product Portfolio 18.1.2.3. Profitability by Market Segment 18.1.2.4. Sales Footprint 18.1.2.5. Strategy Overview 18.1.2.5.1. Marketing Strategy 18.1.2.5.2. Product Strategy 18.1.3. Koninklijke Philips N.V. 18.1.3.1. Overview 18.1.3.2. Product Portfolio 18.1.3.3. Profitability by Market Segment 18.1.3.4. Sales Footprint 18.1.3.5. Strategy Overview 18.1.3.5.1. Marketing Strategy 18.1.3.5.2. Product Strategy 18.1.4. Panasonic Corporation 18.1.4.1. Overview 18.1.4.2. Product Portfolio 18.1.4.3. Profitability by Market Segment 18.1.4.4. Sales Footprint 18.1.4.5. Strategy Overview 18.1.4.5.1. Marketing Strategy 18.1.4.5.2. Product Strategy 18.1.5. Johnson & Johnson Consumer Inc. 18.1.5.1. Overview 18.1.5.2. Product Portfolio 18.1.5.3. Profitability by Market Segment 18.1.5.4. Sales Footprint 18.1.5.5. Strategy Overview 18.1.5.5.1. Marketing Strategy 18.1.5.5.2. Product Strategy 18.1.6. Beiersdorf AG 18.1.6.1. Overview 18.1.6.2. Product Portfolio 18.1.6.3. Profitability by Market Segment 18.1.6.4. Sales Footprint 18.1.6.5. Strategy Overview 18.1.6.5.1. Marketing Strategy 18.1.6.5.2. Product Strategy 18.1.7. Revlon Group 18.1.7.1. Overview 18.1.7.2. Product Portfolio 18.1.7.3. Profitability by Market Segment 18.1.7.4. Sales Footprint 18.1.7.5. Strategy Overview 18.1.7.5.1. Marketing Strategy 18.1.7.5.2. Product Strategy 18.1.8. Benefit Cosmetics LLC 18.1.8.1. Overview 18.1.8.2. Product Portfolio 18.1.8.3. Profitability by Market Segment 18.1.8.4. Sales Footprint 18.1.8.5. Strategy Overview 18.1.8.5.1. Marketing Strategy 18.1.8.5.2. Product Strategy 18.1.9. L'Oréal S.A. 18.1.9.1. Overview 18.1.9.2. Product Portfolio 18.1.9.3. Profitability by Market Segment 18.1.9.4. Sales Footprint 18.1.9.5. Strategy Overview 18.1.9.5.1. Marketing Strategy 18.1.9.5.2. Product Strategy 18.1.10. Edgewell Personal Care Co. 18.1.10.1. Overview 18.1.10.2. Product Portfolio 18.1.10.3. Profitability by Market Segment 18.1.10.4. Sales Footprint 18.1.10.5. Strategy Overview 18.1.10.5.1. Marketing Strategy 18.1.10.5.2. Product Strategy 18.1.11. MAC cosmetics 18.1.11.1. Overview 18.1.11.2. Product Portfolio 18.1.11.3. Profitability by Market Segment 18.1.11.4. Sales Footprint 18.1.11.5. Strategy Overview 18.1.11.5.1. Marketing Strategy 18.1.11.5.2. Product Strategy 18.1.12. Chanel S.A. 18.1.12.1. Overview 18.1.12.2. Product Portfolio 18.1.12.3. Profitability by Market Segment 18.1.12.4. Sales Footprint 18.1.12.5. Strategy Overview 18.1.12.5.1. Marketing Strategy 18.1.12.5.2. Product Strategy 18.1.13. Shiseido Company Limited 18.1.13.1. Overview 18.1.13.2. Product Portfolio 18.1.13.3. Profitability by Market Segment 18.1.13.4. Sales Footprint 18.1.13.5. Strategy Overview 18.1.13.5.1. Marketing Strategy 18.1.13.5.2. Product Strategy 18.1.14. Beiersdorf AG 18.1.14.1. Overview 18.1.14.2. Product Portfolio 18.1.14.3. Profitability by Market Segment 18.1.14.4. Sales Footprint 18.1.14.5. Strategy Overview 18.1.14.5.1. Marketing Strategy 18.1.14.5.2. Product Strategy 18.1.15. Unilever N.V. 18.1.15.1. Overview 18.1.15.2. Product Portfolio 18.1.15.3. Profitability by Market Segment 18.1.15.4. Sales Footprint 18.1.15.5. Strategy Overview 18.1.15.5.1. Marketing Strategy 18.1.15.5.2. Product Strategy 18.1.16. ITC Limited 18.1.16.1. Overview 18.1.16.2. Product Portfolio 18.1.16.3. Profitability by Market Segment 18.1.16.4. Sales Footprint 18.1.16.5. Strategy Overview 18.1.16.5.1. Marketing Strategy 18.1.16.5.2. Product Strategy 18.1.17. Clarins Group 18.1.17.1. Overview 18.1.17.2. Product Portfolio 18.1.17.3. Profitability by Market Segment 18.1.17.4. Sales Footprint 18.1.17.5. Strategy Overview 18.1.17.5.1. Marketing Strategy 18.1.17.5.2. Product Strategy 18.1.18. Kao Corporation 18.1.18.1. Overview 18.1.18.2. Product Portfolio 18.1.18.3. Profitability by Market Segment 18.1.18.4. Sales Footprint 18.1.18.5. Strategy Overview 18.1.18.5.1. Marketing Strategy 18.1.18.5.2. Product Strategy 18.1.19. AmorePacific Corporation 18.1.19.1. Overview 18.1.19.2. Product Portfolio 18.1.19.3. Profitability by Market Segment 18.1.19.4. Sales Footprint 18.1.19.5. Strategy Overview 18.1.19.5.1. Marketing Strategy 18.1.19.5.2. Product Strategy 18.1.20. LVMH Moët Hennessy Louis Vuitton SE 18.1.20.1. Overview 18.1.20.2. Product Portfolio 18.1.20.3. Profitability by Market Segment 18.1.20.4. Sales Footprint 18.1.20.5. Strategy Overview 18.1.20.5.1. Marketing Strategy 18.1.20.5.2. Product Strategy 19. Assumptions & Acronyms Used 20. Research Methodology
Let us know your requirement to get
100% FREE customization
List of Tables
Table 1: Global Market Value (US$ Mn) Forecast by Region, 2017-2032 Table 2: Global Market Volume (Units) Forecast by Region, 2017-2032 Table 3: Global Market Value (US$ Mn) Forecast by Product Type, 2017-2032 Table 4: Global Market Volume (Units) Forecast by Product Type, 2017-2032 Table 5: Global Market Value (US$ Mn) Forecast by Nature , 2017-2032 Table 6: Global Market Volume (Units) Forecast by Nature , 2017-2032 Table 7: Global Market Value (US$ Mn) Forecast by Price Range , 2017-2032 Table 8: Global Market Volume (Units) Forecast by Price Range , 2017-2032 Table 9: Global Market Value (US$ Mn) Forecast by Packaging Type , 2017-2032 Table 10: Global Market Volume (Units) Forecast by Packaging Type , 2017-2032 Table 11: Global Market Value (US$ Mn) Forecast by Sales Channels , 2017-2032 Table 12: Global Market Volume (Units) Forecast by Sales Channels , 2017-2032 Table 13: North America Market Value (US$ Mn) Forecast by Country, 2017-2032 Table 14: North America Market Volume (Units) Forecast by Country, 2017-2032 Table 15: North America Market Value (US$ Mn) Forecast by Product Type, 2017-2032 Table 16: North America Market Volume (Units) Forecast by Product Type, 2017-2032 Table 17: North America Market Value (US$ Mn) Forecast by Nature , 2017-2032 Table 18: North America Market Volume (Units) Forecast by Nature , 2017-2032 Table 19: North America Market Value (US$ Mn) Forecast by Price Range , 2017-2032 Table 20: North America Market Volume (Units) Forecast by Price Range , 2017-2032 Table 21: North America Market Value (US$ Mn) Forecast by Packaging Type , 2017-2032 Table 22: North America Market Volume (Units) Forecast by Packaging Type , 2017-2032 Table 23: North America Market Value (US$ Mn) Forecast by Sales Channels , 2017-2032 Table 24: North America Market Volume (Units) Forecast by Sales Channels , 2017-2032 Table 25: Latin America Market Value (US$ Mn) Forecast by Country, 2017-2032 Table 26: Latin America Market Volume (Units) Forecast by Country, 2017-2032 Table 27: Latin America Market Value (US$ Mn) Forecast by Product Type, 2017-2032 Table 28: Latin America Market Volume (Units) Forecast by Product Type, 2017-2032 Table 29: Latin America Market Value (US$ Mn) Forecast by Nature , 2017-2032 Table 30: Latin America Market Volume (Units) Forecast by Nature , 2017-2032 Table 31: Latin America Market Value (US$ Mn) Forecast by Price Range , 2017-2032 Table 32: Latin America Market Volume (Units) Forecast by Price Range , 2017-2032 Table 33: Latin America Market Value (US$ Mn) Forecast by Packaging Type , 2017-2032 Table 34: Latin America Market Volume (Units) Forecast by Packaging Type , 2017-2032 Table 35: Latin America Market Value (US$ Mn) Forecast by Sales Channels , 2017-2032 Table 36: Latin America Market Volume (Units) Forecast by Sales Channels , 2017-2032 Table 37: Europe Market Value (US$ Mn) Forecast by Country, 2017-2032 Table 38: Europe Market Volume (Units) Forecast by Country, 2017-2032 Table 39: Europe Market Value (US$ Mn) Forecast by Product Type, 2017-2032 Table 40: Europe Market Volume (Units) Forecast by Product Type, 2017-2032 Table 41: Europe Market Value (US$ Mn) Forecast by Nature , 2017-2032 Table 42: Europe Market Volume (Units) Forecast by Nature , 2017-2032 Table 43: Europe Market Value (US$ Mn) Forecast by Price Range , 2017-2032 Table 44: Europe Market Volume (Units) Forecast by Price Range , 2017-2032 Table 45: Europe Market Value (US$ Mn) Forecast by Packaging Type , 2017-2032 Table 46: Europe Market Volume (Units) Forecast by Packaging Type , 2017-2032 Table 47: Europe Market Value (US$ Mn) Forecast by Sales Channels , 2017-2032 Table 48: Europe Market Volume (Units) Forecast by Sales Channels , 2017-2032 Table 49: Asia Pacific Market Value (US$ Mn) Forecast by Country, 2017-2032 Table 50: Asia Pacific Market Volume (Units) Forecast by Country, 2017-2032 Table 51: Asia Pacific Market Value (US$ Mn) Forecast by Product Type, 2017-2032 Table 52: Asia Pacific Market Volume (Units) Forecast by Product Type, 2017-2032 Table 53: Asia Pacific Market Value (US$ Mn) Forecast by Nature , 2017-2032 Table 54: Asia Pacific Market Volume (Units) Forecast by Nature , 2017-2032 Table 55: Asia Pacific Market Value (US$ Mn) Forecast by Price Range , 2017-2032 Table 56: Asia Pacific Market Volume (Units) Forecast by Price Range , 2017-2032 Table 57: Asia Pacific Market Value (US$ Mn) Forecast by Packaging Type , 2017-2032 Table 58: Asia Pacific Market Volume (Units) Forecast by Packaging Type , 2017-2032 Table 59: Asia Pacific Market Value (US$ Mn) Forecast by Sales Channels , 2017-2032 Table 60: Asia Pacific Market Volume (Units) Forecast by Sales Channels , 2017-2032 Table 61: MEA Market Value (US$ Mn) Forecast by Country, 2017-2032 Table 62: MEA Market Volume (Units) Forecast by Country, 2017-2032 Table 63: MEA Market Value (US$ Mn) Forecast by Product Type, 2017-2032 Table 64: MEA Market Volume (Units) Forecast by Product Type, 2017-2032 Table 65: MEA Market Value (US$ Mn) Forecast by Nature , 2017-2032 Table 66: MEA Market Volume (Units) Forecast by Nature , 2017-2032 Table 67: MEA Market Value (US$ Mn) Forecast by Price Range , 2017-2032 Table 68: MEA Market Volume (Units) Forecast by Price Range , 2017-2032 Table 69: MEA Market Value (US$ Mn) Forecast by Packaging Type , 2017-2032 Table 70: MEA Market Volume (Units) Forecast by Packaging Type , 2017-2032 Table 71: MEA Market Value (US$ Mn) Forecast by Sales Channels , 2017-2032 Table 72: MEA Market Volume (Units) Forecast by Sales Channels , 2017-2032
Find your sweet spots for generating winning opportunities in this market.
Talk to AnalystList of Charts
Figure 1: Global Market Value (US$ Mn) by Product Type, 2022-2032 Figure 2: Global Market Value (US$ Mn) by Nature , 2022-2032 Figure 3: Global Market Value (US$ Mn) by Price Range , 2022-2032 Figure 4: Global Market Value (US$ Mn) by Packaging Type , 2022-2032 Figure 5: Global Market Value (US$ Mn) by Sales Channels , 2022-2032 Figure 6: Global Market Value (US$ Mn) by Region, 2022-2032 Figure 7: Global Market Value (US$ Mn) Analysis by Region, 2017-2032 Figure 8: Global Market Volume (Units) Analysis by Region, 2017-2032 Figure 9: Global Market Value Share (%) and BPS Analysis by Region, 2022-2032 Figure 10: Global Market Y-o-Y Growth (%) Projections by Region, 2022-2032 Figure 11: Global Market Value (US$ Mn) Analysis by Product Type, 2017-2032 Figure 12: Global Market Volume (Units) Analysis by Product Type, 2017-2032 Figure 13: Global Market Value Share (%) and BPS Analysis by Product Type, 2022-2032 Figure 14: Global Market Y-o-Y Growth (%) Projections by Product Type, 2022-2032 Figure 15: Global Market Value (US$ Mn) Analysis by Nature , 2017-2032 Figure 16: Global Market Volume (Units) Analysis by Nature , 2017-2032 Figure 17: Global Market Value Share (%) and BPS Analysis by Nature , 2022-2032 Figure 18: Global Market Y-o-Y Growth (%) Projections by Nature , 2022-2032 Figure 19: Global Market Value (US$ Mn) Analysis by Price Range , 2017-2032 Figure 20: Global Market Volume (Units) Analysis by Price Range , 2017-2032 Figure 21: Global Market Value Share (%) and BPS Analysis by Price Range , 2022-2032 Figure 22: Global Market Y-o-Y Growth (%) Projections by Price Range , 2022-2032 Figure 23: Global Market Value (US$ Mn) Analysis by Packaging Type , 2017-2032 Figure 24: Global Market Volume (Units) Analysis by Packaging Type , 2017-2032 Figure 25: Global Market Value Share (%) and BPS Analysis by Packaging Type , 2022-2032 Figure 26: Global Market Y-o-Y Growth (%) Projections by Packaging Type , 2022-2032 Figure 27: Global Market Value (US$ Mn) Analysis by Sales Channels , 2017-2032 Figure 28: Global Market Volume (Units) Analysis by Sales Channels , 2017-2032 Figure 29: Global Market Value Share (%) and BPS Analysis by Sales Channels , 2022-2032 Figure 30: Global Market Y-o-Y Growth (%) Projections by Sales Channels , 2022-2032 Figure 31: Global Market Attractiveness by Product Type, 2022-2032 Figure 32: Global Market Attractiveness by Nature , 2022-2032 Figure 33: Global Market Attractiveness by Price Range , 2022-2032 Figure 34: Global Market Attractiveness by Packaging Type , 2022-2032 Figure 35: Global Market Attractiveness by Sales Channels , 2022-2032 Figure 36: Global Market Attractiveness by Region, 2022-2032 Figure 37: North America Market Value (US$ Mn) by Product Type, 2022-2032 Figure 38: North America Market Value (US$ Mn) by Nature , 2022-2032 Figure 39: North America Market Value (US$ Mn) by Price Range , 2022-2032 Figure 40: North America Market Value (US$ Mn) by Packaging Type , 2022-2032 Figure 41: North America Market Value (US$ Mn) by Sales Channels , 2022-2032 Figure 42: North America Market Value (US$ Mn) by Country, 2022-2032 Figure 43: North America Market Value (US$ Mn) Analysis by Country, 2017-2032 Figure 44: North America Market Volume (Units) Analysis by Country, 2017-2032 Figure 45: North America Market Value Share (%) and BPS Analysis by Country, 2022-2032 Figure 46: North America Market Y-o-Y Growth (%) Projections by Country, 2022-2032 Figure 47: North America Market Value (US$ Mn) Analysis by Product Type, 2017-2032 Figure 48: North America Market Volume (Units) Analysis by Product Type, 2017-2032 Figure 49: North America Market Value Share (%) and BPS Analysis by Product Type, 2022-2032 Figure 50: North America Market Y-o-Y Growth (%) Projections by Product Type, 2022-2032 Figure 51: North America Market Value (US$ Mn) Analysis by Nature , 2017-2032 Figure 52: North America Market Volume (Units) Analysis by Nature , 2017-2032 Figure 53: North America Market Value Share (%) and BPS Analysis by Nature , 2022-2032 Figure 54: North America Market Y-o-Y Growth (%) Projections by Nature , 2022-2032 Figure 55: North America Market Value (US$ Mn) Analysis by Price Range , 2017-2032 Figure 56: North America Market Volume (Units) Analysis by Price Range , 2017-2032 Figure 57: North America Market Value Share (%) and BPS Analysis by Price Range , 2022-2032 Figure 58: North America Market Y-o-Y Growth (%) Projections by Price Range , 2022-2032 Figure 59: North America Market Value (US$ Mn) Analysis by Packaging Type , 2017-2032 Figure 60: North America Market Volume (Units) Analysis by Packaging Type , 2017-2032 Figure 61: North America Market Value Share (%) and BPS Analysis by Packaging Type , 2022-2032 Figure 62: North America Market Y-o-Y Growth (%) Projections by Packaging Type , 2022-2032 Figure 63: North America Market Value (US$ Mn) Analysis by Sales Channels , 2017-2032 Figure 64: North America Market Volume (Units) Analysis by Sales Channels , 2017-2032 Figure 65: North America Market Value Share (%) and BPS Analysis by Sales Channels , 2022-2032 Figure 66: North America Market Y-o-Y Growth (%) Projections by Sales Channels , 2022-2032 Figure 67: North America Market Attractiveness by Product Type, 2022-2032 Figure 68: North America Market Attractiveness by Nature , 2022-2032 Figure 69: North America Market Attractiveness by Price Range , 2022-2032 Figure 70: North America Market Attractiveness by Packaging Type , 2022-2032 Figure 71: North America Market Attractiveness by Sales Channels , 2022-2032 Figure 72: North America Market Attractiveness by Country, 2022-2032 Figure 73: Latin America Market Value (US$ Mn) by Product Type, 2022-2032 Figure 74: Latin America Market Value (US$ Mn) by Nature , 2022-2032 Figure 75: Latin America Market Value (US$ Mn) by Price Range , 2022-2032 Figure 76: Latin America Market Value (US$ Mn) by Packaging Type , 2022-2032 Figure 77: Latin America Market Value (US$ Mn) by Sales Channels , 2022-2032 Figure 78: Latin America Market Value (US$ Mn) by Country, 2022-2032 Figure 79: Latin America Market Value (US$ Mn) Analysis by Country, 2017-2032 Figure 80: Latin America Market Volume (Units) Analysis by Country, 2017-2032 Figure 81: Latin America Market Value Share (%) and BPS Analysis by Country, 2022-2032 Figure 82: Latin America Market Y-o-Y Growth (%) Projections by Country, 2022-2032 Figure 83: Latin America Market Value (US$ Mn) Analysis by Product Type, 2017-2032 Figure 84: Latin America Market Volume (Units) Analysis by Product Type, 2017-2032 Figure 85: Latin America Market Value Share (%) and BPS Analysis by Product Type, 2022-2032 Figure 86: Latin America Market Y-o-Y Growth (%) Projections by Product Type, 2022-2032 Figure 87: Latin America Market Value (US$ Mn) Analysis by Nature , 2017-2032 Figure 88: Latin America Market Volume (Units) Analysis by Nature , 2017-2032 Figure 89: Latin America Market Value Share (%) and BPS Analysis by Nature , 2022-2032 Figure 90: Latin America Market Y-o-Y Growth (%) Projections by Nature , 2022-2032 Figure 91: Latin America Market Value (US$ Mn) Analysis by Price Range , 2017-2032 Figure 92: Latin America Market Volume (Units) Analysis by Price Range , 2017-2032 Figure 93: Latin America Market Value Share (%) and BPS Analysis by Price Range , 2022-2032 Figure 94: Latin America Market Y-o-Y Growth (%) Projections by Price Range , 2022-2032 Figure 95: Latin America Market Value (US$ Mn) Analysis by Packaging Type , 2017-2032 Figure 96: Latin America Market Volume (Units) Analysis by Packaging Type , 2017-2032 Figure 97: Latin America Market Value Share (%) and BPS Analysis by Packaging Type , 2022-2032 Figure 98: Latin America Market Y-o-Y Growth (%) Projections by Packaging Type , 2022-2032 Figure 99: Latin America Market Value (US$ Mn) Analysis by Sales Channels , 2017-2032 Figure 100: Latin America Market Volume (Units) Analysis by Sales Channels , 2017-2032 Figure 101: Latin America Market Value Share (%) and BPS Analysis by Sales Channels , 2022-2032 Figure 102: Latin America Market Y-o-Y Growth (%) Projections by Sales Channels , 2022-2032 Figure 103: Latin America Market Attractiveness by Product Type, 2022-2032 Figure 104: Latin America Market Attractiveness by Nature , 2022-2032 Figure 105: Latin America Market Attractiveness by Price Range , 2022-2032 Figure 106: Latin America Market Attractiveness by Packaging Type , 2022-2032 Figure 107: Latin America Market Attractiveness by Sales Channels , 2022-2032 Figure 108: Latin America Market Attractiveness by Country, 2022-2032 Figure 109: Europe Market Value (US$ Mn) by Product Type, 2022-2032 Figure 110: Europe Market Value (US$ Mn) by Nature , 2022-2032 Figure 111: Europe Market Value (US$ Mn) by Price Range , 2022-2032 Figure 112: Europe Market Value (US$ Mn) by Packaging Type , 2022-2032 Figure 113: Europe Market Value (US$ Mn) by Sales Channels , 2022-2032 Figure 114: Europe Market Value (US$ Mn) by Country, 2022-2032 Figure 115: Europe Market Value (US$ Mn) Analysis by Country, 2017-2032 Figure 116: Europe Market Volume (Units) Analysis by Country, 2017-2032 Figure 117: Europe Market Value Share (%) and BPS Analysis by Country, 2022-2032 Figure 118: Europe Market Y-o-Y Growth (%) Projections by Country, 2022-2032 Figure 119: Europe Market Value (US$ Mn) Analysis by Product Type, 2017-2032 Figure 120: Europe Market Volume (Units) Analysis by Product Type, 2017-2032 Figure 121: Europe Market Value Share (%) and BPS Analysis by Product Type, 2022-2032 Figure 122: Europe Market Y-o-Y Growth (%) Projections by Product Type, 2022-2032 Figure 123: Europe Market Value (US$ Mn) Analysis by Nature , 2017-2032 Figure 124: Europe Market Volume (Units) Analysis by Nature , 2017-2032 Figure 125: Europe Market Value Share (%) and BPS Analysis by Nature , 2022-2032 Figure 126: Europe Market Y-o-Y Growth (%) Projections by Nature , 2022-2032 Figure 127: Europe Market Value (US$ Mn) Analysis by Price Range , 2017-2032 Figure 128: Europe Market Volume (Units) Analysis by Price Range , 2017-2032 Figure 129: Europe Market Value Share (%) and BPS Analysis by Price Range , 2022-2032 Figure 130: Europe Market Y-o-Y Growth (%) Projections by Price Range , 2022-2032 Figure 131: Europe Market Value (US$ Mn) Analysis by Packaging Type , 2017-2032 Figure 132: Europe Market Volume (Units) Analysis by Packaging Type , 2017-2032 Figure 133: Europe Market Value Share (%) and BPS Analysis by Packaging Type , 2022-2032 Figure 134: Europe Market Y-o-Y Growth (%) Projections by Packaging Type , 2022-2032 Figure 135: Europe Market Value (US$ Mn) Analysis by Sales Channels , 2017-2032 Figure 136: Europe Market Volume (Units) Analysis by Sales Channels , 2017-2032 Figure 137: Europe Market Value Share (%) and BPS Analysis by Sales Channels , 2022-2032 Figure 138: Europe Market Y-o-Y Growth (%) Projections by Sales Channels , 2022-2032 Figure 139: Europe Market Attractiveness by Product Type, 2022-2032 Figure 140: Europe Market Attractiveness by Nature , 2022-2032 Figure 141: Europe Market Attractiveness by Price Range , 2022-2032 Figure 142: Europe Market Attractiveness by Packaging Type , 2022-2032 Figure 143: Europe Market Attractiveness by Sales Channels , 2022-2032 Figure 144: Europe Market Attractiveness by Country, 2022-2032 Figure 145: Asia Pacific Market Value (US$ Mn) by Product Type, 2022-2032 Figure 146: Asia Pacific Market Value (US$ Mn) by Nature , 2022-2032 Figure 147: Asia Pacific Market Value (US$ Mn) by Price Range , 2022-2032 Figure 148: Asia Pacific Market Value (US$ Mn) by Packaging Type , 2022-2032 Figure 149: Asia Pacific Market Value (US$ Mn) by Sales Channels , 2022-2032 Figure 150: Asia Pacific Market Value (US$ Mn) by Country, 2022-2032 Figure 151: Asia Pacific Market Value (US$ Mn) Analysis by Country, 2017-2032 Figure 152: Asia Pacific Market Volume (Units) Analysis by Country, 2017-2032 Figure 153: Asia Pacific Market Value Share (%) and BPS Analysis by Country, 2022-2032 Figure 154: Asia Pacific Market Y-o-Y Growth (%) Projections by Country, 2022-2032 Figure 155: Asia Pacific Market Value (US$ Mn) Analysis by Product Type, 2017-2032 Figure 156: Asia Pacific Market Volume (Units) Analysis by Product Type, 2017-2032 Figure 157: Asia Pacific Market Value Share (%) and BPS Analysis by Product Type, 2022-2032 Figure 158: Asia Pacific Market Y-o-Y Growth (%) Projections by Product Type, 2022-2032 Figure 159: Asia Pacific Market Value (US$ Mn) Analysis by Nature , 2017-2032 Figure 160: Asia Pacific Market Volume (Units) Analysis by Nature , 2017-2032 Figure 161: Asia Pacific Market Value Share (%) and BPS Analysis by Nature , 2022-2032 Figure 162: Asia Pacific Market Y-o-Y Growth (%) Projections by Nature , 2022-2032 Figure 163: Asia Pacific Market Value (US$ Mn) Analysis by Price Range , 2017-2032 Figure 164: Asia Pacific Market Volume (Units) Analysis by Price Range , 2017-2032 Figure 165: Asia Pacific Market Value Share (%) and BPS Analysis by Price Range , 2022-2032 Figure 166: Asia Pacific Market Y-o-Y Growth (%) Projections by Price Range , 2022-2032 Figure 167: Asia Pacific Market Value (US$ Mn) Analysis by Packaging Type , 2017-2032 Figure 168: Asia Pacific Market Volume (Units) Analysis by Packaging Type , 2017-2032 Figure 169: Asia Pacific Market Value Share (%) and BPS Analysis by Packaging Type , 2022-2032 Figure 170: Asia Pacific Market Y-o-Y Growth (%) Projections by Packaging Type , 2022-2032 Figure 171: Asia Pacific Market Value (US$ Mn) Analysis by Sales Channels , 2017-2032 Figure 172: Asia Pacific Market Volume (Units) Analysis by Sales Channels , 2017-2032 Figure 173: Asia Pacific Market Value Share (%) and BPS Analysis by Sales Channels , 2022-2032 Figure 174: Asia Pacific Market Y-o-Y Growth (%) Projections by Sales Channels , 2022-2032 Figure 175: Asia Pacific Market Attractiveness by Product Type, 2022-2032 Figure 176: Asia Pacific Market Attractiveness by Nature , 2022-2032 Figure 177: Asia Pacific Market Attractiveness by Price Range , 2022-2032 Figure 178: Asia Pacific Market Attractiveness by Packaging Type , 2022-2032 Figure 179: Asia Pacific Market Attractiveness by Sales Channels , 2022-2032 Figure 180: Asia Pacific Market Attractiveness by Country, 2022-2032 Figure 181: MEA Market Value (US$ Mn) by Product Type, 2022-2032 Figure 182: MEA Market Value (US$ Mn) by Nature , 2022-2032 Figure 183: MEA Market Value (US$ Mn) by Price Range , 2022-2032 Figure 184: MEA Market Value (US$ Mn) by Packaging Type , 2022-2032 Figure 185: MEA Market Value (US$ Mn) by Sales Channels , 2022-2032 Figure 186: MEA Market Value (US$ Mn) by Country, 2022-2032 Figure 187: MEA Market Value (US$ Mn) Analysis by Country, 2017-2032 Figure 188: MEA Market Volume (Units) Analysis by Country, 2017-2032 Figure 189: MEA Market Value Share (%) and BPS Analysis by Country, 2022-2032 Figure 190: MEA Market Y-o-Y Growth (%) Projections by Country, 2022-2032 Figure 191: MEA Market Value (US$ Mn) Analysis by Product Type, 2017-2032 Figure 192: MEA Market Volume (Units) Analysis by Product Type, 2017-2032 Figure 193: MEA Market Value Share (%) and BPS Analysis by Product Type, 2022-2032 Figure 194: MEA Market Y-o-Y Growth (%) Projections by Product Type, 2022-2032 Figure 195: MEA Market Value (US$ Mn) Analysis by Nature , 2017-2032 Figure 196: MEA Market Volume (Units) Analysis by Nature , 2017-2032 Figure 197: MEA Market Value Share (%) and BPS Analysis by Nature , 2022-2032 Figure 198: MEA Market Y-o-Y Growth (%) Projections by Nature , 2022-2032 Figure 199: MEA Market Value (US$ Mn) Analysis by Price Range , 2017-2032 Figure 200: MEA Market Volume (Units) Analysis by Price Range , 2017-2032 Figure 201: MEA Market Value Share (%) and BPS Analysis by Price Range , 2022-2032 Figure 202: MEA Market Y-o-Y Growth (%) Projections by Price Range , 2022-2032 Figure 203: MEA Market Value (US$ Mn) Analysis by Packaging Type , 2017-2032 Figure 204: MEA Market Volume (Units) Analysis by Packaging Type , 2017-2032 Figure 205: MEA Market Value Share (%) and BPS Analysis by Packaging Type , 2022-2032 Figure 206: MEA Market Y-o-Y Growth (%) Projections by Packaging Type , 2022-2032 Figure 207: MEA Market Value (US$ Mn) Analysis by Sales Channels , 2017-2032 Figure 208: MEA Market Volume (Units) Analysis by Sales Channels , 2017-2032 Figure 209: MEA Market Value Share (%) and BPS Analysis by Sales Channels , 2022-2032 Figure 210: MEA Market Y-o-Y Growth (%) Projections by Sales Channels , 2022-2032 Figure 211: MEA Market Attractiveness by Product Type, 2022-2032 Figure 212: MEA Market Attractiveness by Nature , 2022-2032 Figure 213: MEA Market Attractiveness by Price Range , 2022-2032 Figure 214: MEA Market Attractiveness by Packaging Type , 2022-2032 Figure 215: MEA Market Attractiveness by Sales Channels , 2022-2032 Figure 216: MEA Market Attractiveness by Country, 2022-2032
Need specific information?
Request CustomizationExplore Consumer Product Insights
View Reports