Methyl 2-Fluoro-3-Oxopentanoate Market Forecast and Outlook (2025-2035)

The global methyl 2-fluoro-3-oxopentanoate market is projected to reach USD 27.3 million by 2035, recording an absolute increase of USD 11.4 million over the forecast period. The market is valued at 15 million in 2025 and is set to rise at a CAGR of 5.6% during the assessment period. The market size is expected to grow by nearly 1.72X during the same period, supported by expanding pharmaceutical intermediate applications and increasing demand for specialized fluorinated organic compounds. However, stringent regulatory requirements for handling fluorinated chemicals may constrain market expansion in certain regions.
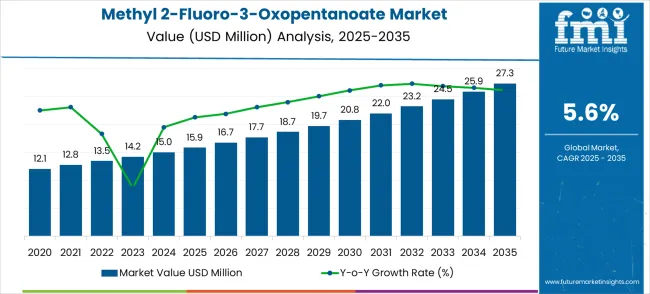
Quick Stats for Methyl 2-Fluoro-3-Oxopentanoate Market

  • Methyl 2-Fluoro-3-Oxopentanoate Market Value (2025): USD 15 million
  • Methyl 2-Fluoro-3-Oxopentanoate Market Forecast Value (2035): USD 27.3 million
  • Methyl 2-Fluoro-3-Oxopentanoate Market Forecast CAGR: 5.6%
  • Leading Purity Grade in Methyl 2-Fluoro-3-Oxopentanoate Market: Purity ≥99% (58.2%)
  • Key Growth Regions in Methyl 2-Fluoro-3-Oxopentanoate Market: North America, Europe, and Asia Pacific
  • Top Key Players in Methyl 2-Fluoro-3-Oxopentanoate Market: Anhui Jinquan Biotechnology, Hangzhou ICH Biofarm, Fangde New Materials, Jostrong (Tianjin) Technology, Tianmen Hengchang Chemical, Nanjing Searchem, Sigma-Aldrich, TCI Chemicals, Fluorochem

Methyl 2 Fluoro 3 Oxopentanoate Market Market Value Analysis

Between 2025 and 2030, the methyl 2-fluoro-3-oxopentanoate market is projected to expand from USD 15 million to USD 21.2 million, resulting in a value increase of USD 5.3 million, which represents 46.5% of the total forecast growth for the decade. This phase of growth will be shaped by rising demand for pharmaceutical intermediates, product innovation in fluorinated building blocks and specialized organic synthesis reagents, and expanding research applications. Companies are establishing competitive positions through investment in purification technologies, quality assurance systems, and strategic market expansion across pharmaceutical manufacturers, research institutions, and emerging specialty chemical applications.

From 2030 to 2035, the market is forecast to grow from USD 21.2 million to USD 27.3 million, adding another USD 6.1 million, which constitutes 53.5% of the overall ten-year expansion. This period is expected to be characterized by expansion of specialized synthesis applications including advanced pharmaceutical intermediates and custom organic compounds tailored for specific therapeutic targets, strategic collaborations between chemical manufacturers and pharmaceutical companies, and enhanced positioning with purity certification and regulatory compliance. The growing emphasis on precision medicine and targeted drug development will drive demand for high-purity fluorinated intermediates across diverse pharmaceutical research applications.

Methyl 2-Fluoro-3-Oxopentanoate Market Key Takeaways

Metric Value
Market Value (2025) USD 15 million
Market Forecast Value (2035) USD 27.3 million
Forecast CAGR (2025-2035) 5.6%

Why is the Methyl 2-Fluoro-3-Oxopentanoate Market Growing?

The methyl 2-fluoro-3-oxopentanoate market expands through its essential role as a versatile building block in pharmaceutical synthesis and specialized organic chemistry applications. Growing demand stems from increasing pharmaceutical R&D activities focused on fluorinated drug compounds, expanding applications in agrochemical intermediate synthesis, and rising adoption in specialty chemical manufacturing for advanced materials. Research institutions and pharmaceutical companies in North America and Europe represent priority segments driving consumption for drug discovery and development programs. Asia Pacific pharmaceutical manufacturers are emerging as key consumers for generic drug production and contract manufacturing services. Growth faces constraints from regulatory complexity surrounding fluorinated chemical handling and disposal requirements.

Opportunity Pathway

The methyl 2-fluoro-3-oxopentanoate market (USD 15.9M → 27.3M by 2035, CAGR ~6%) is driven by rising demand for advanced intermediates in organic synthesis and pharmaceutical applications, with growth concentrated in Asia-Pacific and Europe. Expansion is shaped by the pharmaceutical industry’s move toward fluorinated intermediates, stronger purity requirements (≥99%), and the rising importance of China and India in fine chemical and pharma supply chains. Together, high-purity product demand and application diversification unlock ~USD 11–12M in incremental revenue opportunities by 2035, aligned with the forecast expansion.

Pathway A – High-Purity (≥99%) Intermediates for Pharmaceutical Synthesis

  • Germany, USA, and Japan emphasizing ultra-pure intermediates for regulated drug pipelines.
  • Strong demand from pharma and CROs prioritizing consistent reaction performance and compliance.
  • Largest near-term pool: USD 4.0–4.5M

Pathway B – ≥95% Purity Grades for Organic Synthesis

  • China and India fueling bulk organic synthesis demand for fine chemicals.
  • Local suppliers (e.g., Anhui Jinquan, Fangde New Materials) well-positioned for volume contracts.
  • Opportunity pool: USD 2.5–3.0M

Pathway C – Pharmaceutical Industry Expansion in Asia-Pacific

  • India (7.0% CAGR) and China (7.6% CAGR) anchor growth via generics and agro-pharma intermediates.
  • Government-backed pharma expansion and cost-competitive manufacturing drive local adoption.
  • Regional pool: USD 2.0–2.2M

Pathway D – Specialty Chemical & Custom Synthesis Segments

  • Niche CROs and specialty labs in UK and Brazil adopting for customized synthetic pathways.
  • Demand supported by mid-sized contract manufacturers seeking differentiated intermediates.
  • Expected pool: USD 1.2–1.5M

Pathway E – Supply Chain Localization & Regional Distribution

  • Localized warehousing and distribution in Europe and North America reduce lead times.
  • Opportunities for mid-sized players (e.g., Jostrong, Nanjing Searchem) to expand reach.
  • Regional pool: USD 0.8–1.0M

Pathway F – Process Innovation & Eco-Conscious Manufacturing

  • Development of greener fluorination and purification methods to meet ESG targets.
  • Differentiated “eco-friendly grade” intermediates could capture early-adopter pharma clients.
  • Innovation pool: USD 0.6–0.8M

Segmental Analysis

The market is segmented by purity, application, and region. By purity, the market is divided into purity ≥95%, purity ≥99%, and ultra-high purity grades. By application, the market is categorized into organic synthesis, pharmaceutical intermediates, and research chemicals. Regionally, the market is divided into North America, Latin America, Europe, East Asia, South Asia & Pacific, and Middle East & Africa.
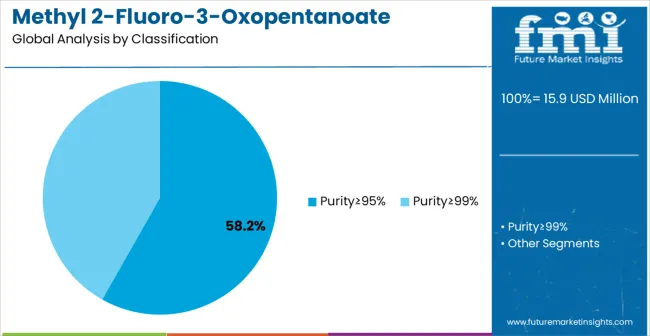
By Purity, Purity ≥99% Segment Accounts for 58.2% Market Share

Methyl 2 Fluoro 3 Oxopentanoate Market Analysis By Classification

Purity ≥99% is projected to hold 58.2% of the methyl 2-fluoro-3-oxopentanoate market in 2025, reflecting its critical role in pharmaceutical synthesis. Regulatory frameworks like FDA and EMA emphasize impurity control, making high-purity grades indispensable. These grades minimize risks of side reactions and ensure consistent reaction outcomes in drug manufacturing. Rising pharmaceutical R&D activities and research-focused applications further strengthen adoption. High-purity standards provide compliance, stability, and reproducibility for advanced synthesis. Manufacturers and contract research organizations prefer ≥99% purity to meet stringent quality requirements while maintaining efficiency, enabling secure drug development pipelines and fostering trust across pharmaceutical supply chains globally.
  • Growing pharmaceutical R&D investments necessitate highest purity standards to achieve reliable and reproducible synthesis outcomes across drug pipelines.
  • Regulatory compliance mandates from agencies such as FDA and EMA drive strong demand for certified high-purity chemical intermediates across pharmaceutical sectors.
  • Stringent quality assurance requirements in drug manufacturing reinforce preference for ≥99% purity grades over standard options to minimize risks.
  • Contract manufacturing and research organizations prioritize consistent ultra-pure supplies to serve client-specific synthesis projects, ensuring compliance with international quality requirements.

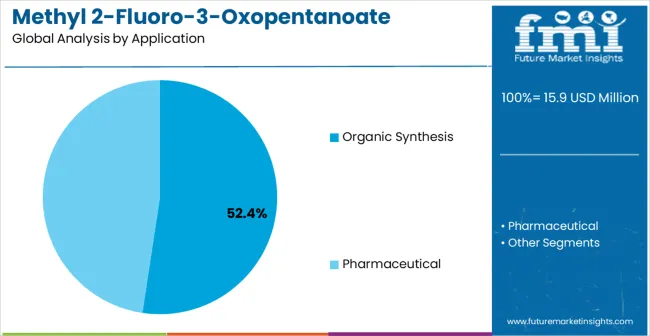
By Application, Organic Synthesis Segment Accounts for 52.4% Market Share

Methyl 2 Fluoro 3 Oxopentanoate Market Analysis By Application

Organic synthesis applications are projected to represent 52.4% of methyl 2-fluoro-3-oxopentanoate demand in 2025, underscoring its importance as a versatile fluorinated intermediate. Widely adopted in pharmaceutical intermediate synthesis, the compound supports efficient construction of complex molecular frameworks. Research institutions rely on it for designing innovative fluorinated molecules, enhancing reaction pathways, and testing new applications. Contract research and custom synthesis companies also account for growing demand, using it in multi-step reaction chains. Its consistency, scalability, and ability to address diverse molecular targets make it indispensable across industrial, academic, and pharmaceutical research domains, driving growth in global market applications.

  • Pharmaceutical intermediate synthesis accounts for the largest consumption within organic synthesis applications, driving demand across global pharmaceutical manufacturing.
  • Research institutions and universities employ the compound to develop novel fluorinated molecular structures and investigate innovative reaction pathways in organic chemistry.
  • Contract manufacturing organizations require consistent, scalable supply for complex multi-step synthesis, ensuring reliable delivery of client-specific projects and outcomes.
  • Academic and industrial research sectors increasingly rely on methyl 2-fluoro-3-oxopentanoate for advanced synthetic methods, boosting demand in specialized applications globally.

What are the Drivers, Restraints, and Key Trends of the Methyl 2-Fluoro-3-Oxopentanoate Market?

Market drivers include expanding pharmaceutical R&D investments in fluorinated drug compounds, growing demand from contract research organizations for specialized building blocks, and increasing applications in agrochemical intermediate synthesis. These factors create demand as pharmaceutical companies seek to improve drug properties through fluorination strategies and research institutions require reliable sources of high-purity intermediates for synthesis programs.

Market restraints encompass stringent regulatory requirements for fluorinated chemical handling and storage, high production costs associated with specialized purification processes, and limited supplier base creating potential supply chain vulnerabilities. Environmental regulations governing fluorinated compound disposal and worker safety requirements add operational complexity and costs for both manufacturers and end-users.

Market trends show accelerated adoption in Asia Pacific pharmaceutical manufacturing, design shifts toward ultra-high purity specifications enabling complex synthesis applications, and integration of advanced analytical testing for batch-to-batch consistency. However, regulatory restrictions on fluorinated chemical imports in certain regions could disrupt established supply chains and limit market expansion opportunities.
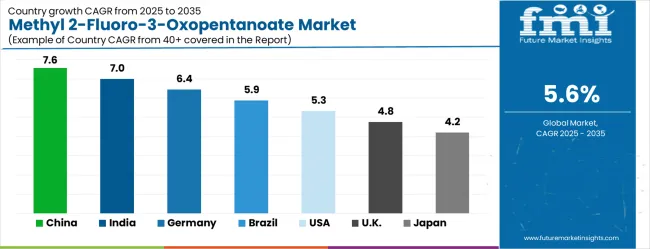
Analysis of Methyl 2-Fluoro-3-Oxopentanoate Market by Key Country

Methyl 2 Fluoro 3 Oxopentanoate Market Cagr Analysis By Country

Country CAGR (2025-2035)
China 7.6%
India 7.0%
Germany 6.4%
Brazil 5.9%
USA 5.3%
UK 4.8%
Japan 4.2%

The methyl 2-fluoro-3-oxopentanoate market is gathering pace worldwide, with China taking the lead thanks to expanding pharmaceutical manufacturing capabilities and growing chemical synthesis infrastructure. Close behind, India benefits from increasing generic drug production and rising pharmaceutical R&D investments, positioning itself as a strategic growth hub. Germany shows steady advancement, where integration with established pharmaceutical and chemical industries strengthens its role in the regional supply chain. Brazil is sharpening focus on pharmaceutical intermediate manufacturing and specialty chemical applications, signaling an ambition to capture niche opportunities. Meanwhile, the USA stands out for its advanced research applications, and the UK and Japan continue to record consistent progress. Together, China and India anchor the global expansion story, while the rest build stability and diversity into the market's growth path.

The report covers an in-depth analysis of 40+ countries with top-performing countries are highlighted below.

Analysis of Methyl 2-Fluoro-3-Oxopentanoate Market in China

The methyl 2-fluoro-3-oxopentanoate market in China is projected to grow at a robust CAGR of 7.6% from 2025 to 2035. The demand for this compound is driven by the country's booming pharmaceutical and chemical industries, which use it as an intermediate in the synthesis of various active pharmaceutical ingredients (APIs) and specialty chemicals. China’s vast manufacturing base, coupled with its expanding focus on research and development (R&D), plays a critical role in the growth of this market. The increasing adoption of advanced chemical processes and the shift towards high-value chemicals in the production of agrochemicals and pharmaceuticals further propel market expansion. China’s push for green chemistry and innovations in chemical production processes supports the development of new applications for Methyl 2-Fluoro-3-Oxopentanoate. The rapid growth of the industrial and export sectors, alongside government-backed initiatives to foster high-tech chemical production, ensures that China will continue to maintain its leadership in the Methyl 2-Fluoro-3-Oxopentanoate market.

  • Pharmaceutical manufacturing clusters in Jiangsu and Zhejiang provinces drive concentrated demand for chemical intermediates
  • Contract manufacturing organizations expand capabilities for fluorinated compound synthesis and purification processes
  • Export-oriented production facilities require consistent supply chains for international pharmaceutical client requirements

Sales Analysis of Methyl 2-Fluoro-3-Oxopentanoate in India

The methyl 2-fluoro-3-oxopentanoate market in India is set to experience a solid growth trajectory, with a CAGR of 7.0% between 2025 and 2035. The country’s pharmaceutical and agrochemical sectors are significant contributors to the demand for this compound. With an expanding generics market and increasing reliance on specialty chemicals, India remains an important player in the global chemical industry. The government’s efforts to promote chemical manufacturing and pharmaceutical exports, through initiatives such as "Make in India," are further boosting the growth of the methyl 2-fluoro-3-oxopentanoate market. Moreover, India’s thriving chemical industry, coupled with its growing research in organic chemistry and biotechnology, offers substantial opportunities for market expansion. The rising demand for crop protection chemicals, along with the country’s increasing focus on improving its industrial and export capabilities, further accelerates the market for methyl 2-fluoro-3-oxopentanoate. India is positioned to be a major contributor to the growing global demand for this chemical compound.

  • Generic drug manufacturing sector leads consumption for established fluorinated pharmaceutical products
  • Contract research organizations expand services for international pharmaceutical clients requiring specialized intermediates
  • Regulatory compliance improvements support export market access for pharmaceutical products containing fluorinated compounds

Demand Outlook for Methyl 2-Fluoro-3-Oxopentanoate in Germany

Germany is expected to witness steady growth in the Methyl 2-Fluoro-3-Oxopentanoate market, with a CAGR of 6.4% from 2025 to 2035. As a leader in the European chemical and pharmaceutical industries, Germany's demand for this compound is primarily driven by its advanced pharmaceutical research and specialty chemicals sectors. The country’s strong focus on high-quality and precision-driven chemical production ensures a consistent need for premium intermediates like methyl 2-fluoro-3-oxopentanoate. The German market also benefits from significant investments in R&D activities, with chemical companies exploring innovative production techniques and enhancing product applications in agriculture and pharmaceuticals. Germany’s well-established regulatory framework, coupled with its commitment to international standards, plays a critical role in boosting demand for high-performance chemicals. Germany’s strategic position in the European Union enhances its market reach and export potential, making it a key hub for methyl 2-fluoro-3-oxopentanoate production and distribution.

  • Pharmaceutical research centers in Baden-Württemberg drive demand for ultra-high purity chemical intermediates
  • Chemical manufacturers invest in advanced purification technologies for pharmaceutical-grade product specifications
  • Academic institutions collaborate with industry partners for fluorinated compound research and development programs

Sales Trends for Methyl 2-Fluoro-3-Oxopentanoate in Brazil

The methyl 2-fluoro-3-oxopentanoate market in Brazil is projected to grow at a CAGR of 5.9% from 2025 to 2035, driven by the country’s increasing industrialization and expanding chemical production capabilities. Brazil’s demand for Methyl 2-Fluoro-3-Oxopentanoate stems from its robust pharmaceutical, agrochemical, and manufacturing sectors. With the country’s growing need for specialty chemicals, the market for this compound is expected to rise as Brazil ramps up its production of agrochemicals and pharmaceutical intermediates. Brazil’s strategic role in Latin America’s chemical industry facilitates easy access to regional markets, further promoting demand for high-quality chemical compounds. As Brazil works to enhance its industrial capacity and modernize its manufacturing infrastructure, the adoption of advanced chemical processes and precision manufacturing technologies will play a significant role in driving market growth. The steady increase in investments in the country’s chemical manufacturing plants is expected to further boost the methyl 2-fluoro-3-oxopentanoate market.
  • Pharmaceutical manufacturing hubs in São Paulo state concentrate demand for chemical intermediates and synthesis services
  • Generic drug production facilities require cost-effective sources of high-quality intermediates for established pharmaceutical products
  • Regulatory agencies implement quality standards favoring certified suppliers with documented quality assurance systems

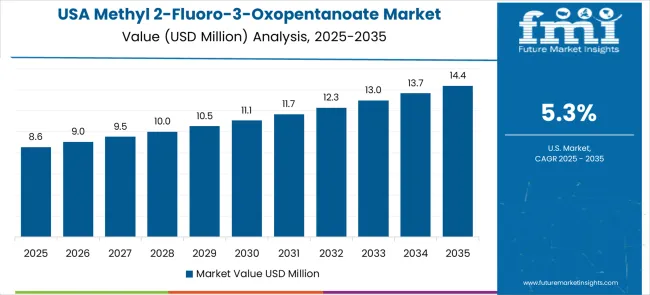
Forecast Analysis of Methyl 2-Fluoro-3-Oxopentanoate in the United States

Methyl 2 Fluoro 3 Oxopentanoate Market Country Value Analysis

The methyl 2-fluoro-3-oxopentanoate market in the United States is expected to grow at a steady pace of 5.3% CAGR from 2025 to 2035. The growth of this market is closely linked to the booming pharmaceutical, agrochemical, and chemical industries, with the USA remaining a key player in the global chemical market. As the world’s largest pharmaceutical market, the demand for Methyl 2-Fluoro-3-Oxopentanoate in the USA is supported by its extensive use as an intermediate in API production. The USA chemical sector is increasingly focusing on high-performance chemicals and green manufacturing methods, driving the need for advanced chemical intermediates like methyl 2-fluoro-3-oxopentanoate. As the USA continues to be a hub for chemical production and R&D activities, advancements in biotechnology and chemical synthesis are expected to open up new opportunities for this market. Regulatory frameworks and compliance with international standards further contribute to the demand for premium chemicals in the USA

  • Pharmaceutical research institutions in Massachusetts and California lead consumption for drug discovery and development programs
  • Contract research organizations provide specialized synthesis services requiring high-purity fluorinated intermediates
  • Academic medical centers collaborate with pharmaceutical companies for translational research applications

Demand Trends for Methyl 2-Fluoro-3-Oxopentanoate in the United Kingdom

The United Kingdom is expected to witness moderate growth in the methyl 2-fluoro-3-oxopentanoate market, with a projected CAGR of 4.8% from 2025 to 2035. The country’s strong pharmaceutical and chemical industries are the main drivers of this growth, with Methyl 2-Fluoro-3-Oxopentanoate being used as an intermediate in the production of specialty chemicals and active pharmaceutical ingredients (APIs). The UK continues to be a leader in chemical R&D and production, supported by its highly skilled workforce and advanced technological infrastructure. Moreover, the UK’s robust regulatory environment, aligned with global standards, ensures the safe production and distribution of high-quality chemicals. The growing demand for high-value chemical intermediates in the pharmaceutical sector, along with increasing applications in agrochemicals, is expected to contribute to the expansion of the market. Post-Brexit regulatory adjustments and international trade deals are likely to boost the UK’s competitiveness in global chemical markets.

  • University research centers in Cambridge and Oxford lead academic consumption for chemical synthesis research programs
  • Pharmaceutical companies utilize established supply chains for specialized intermediate procurement and quality assurance
  • Chemical manufacturers invest in advanced analytical capabilities for batch certification and regulatory compliance documentation

Expansion Outlook for Methyl 2-Fluoro-3-Oxopentanoate in Japan

The methyl 2-fluoro-3-oxopentanoate market in Japan is anticipated to grow at a steady 4.2% CAGR through 2035. The demand for this chemical is supported by Japan’s highly advanced pharmaceutical, chemical, and automotive sectors, where it is used as a key intermediate in the production of specialty chemicals and APIs. Japan’s emphasis on technological innovation and precision manufacturing ensures that high-quality intermediates, such as Methyl 2-Fluoro-3-Oxopentanoate, remain in demand across various industries. The country’s strong research and development infrastructure, coupled with its commitment to maintaining global leadership in high-tech manufacturing, plays a crucial role in driving market growth. The expanding pharmaceutical industry in Japan, combined with increasing export activities, presents significant opportunities for the Methyl 2-Fluoro-3-Oxopentanoate market. Japan’s strict quality control standards and its focus on advanced chemical processing technologies further fuel the demand
  • Technological innovation and precision manufacturing in Japan's pharmaceutical, chemical, and automotive sectors drive demand for Methyl 2-Fluoro-3-Oxopentanoate.
  • Strong R&D infrastructure and commitment to maintaining leadership in high-tech manufacturing contribute to market growth.
  • Expanding pharmaceutical industry and increasing export activities present significant opportunities for market expansion in Japan.

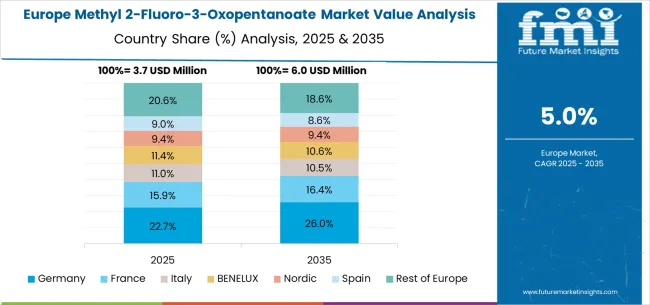
Europe Market Split by Country

Methyl 2 Fluoro 3 Oxopentanoate Market Europe Country Market Share Analysis, 2025 & 2035

The methyl 2-fluoro-3-oxopentanoate market in Europe demonstrates mature development across established pharmaceutical and chemical manufacturing centers, with Germany maintaining leadership through advanced chemical synthesis capabilities and comprehensive regulatory compliance frameworks supporting high-value pharmaceutical intermediate applications. The region benefits from integrated supply chains, established quality standards, and collaborative research networks connecting academic institutions with pharmaceutical manufacturers. France and Switzerland contribute through specialized pharmaceutical research and development activities, while the United Kingdom maintains strong demand from university research programs and pharmaceutical companies focusing on fluorinated drug development. Netherlands and Belgium serve as important distribution hubs for chemical intermediate supply across European markets, supported by advanced logistics infrastructure and established chemical handling expertise. Nordic countries and Eastern Europe display growing potential driven by expanding pharmaceutical manufacturing capabilities and increasing investment in chemical research infrastructure, creating opportunities for specialized intermediate suppliers to establish market presence across diverse application areas.
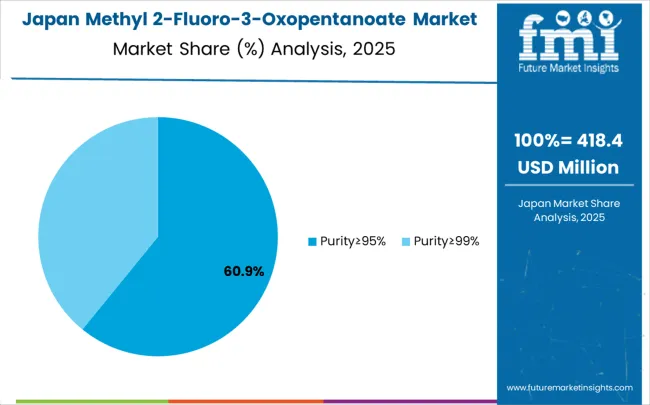
Purity ≥99% Dominates Methyl 2-Fluoro-3-Oxopentanoate Demand in Japan

Methyl 2 Fluoro 3 Oxopentanoate Market Japan Market Share Analysis By Classification

In Japan, the methyl 2-fluoro-3-oxopentanoate market is largely driven by the purity ≥99% segment, which accounts for 72% of total market revenues in 2025. The stringent quality requirements in domestic pharmaceutical manufacturing and research applications contribute to this leading position. Purity ≥95% grades follow with a 23% share, primarily serving specialty chemical synthesis applications and contract manufacturing organizations. Ultra-high purity grades contribute 5% as specialized research applications requiring exceptional purity specifications remain in early adoption stages.
  • Pharmaceutical intermediate synthesis continues to drive demand for certified high-purity chemical building blocks
  • Research institutions prioritize quality assurance and batch consistency for reproducible synthesis outcomes
  • Regulatory compliance requirements favor suppliers with comprehensive quality documentation and analytical certification
  • Contract research organizations utilize premium purity grades for client-specific synthesis projects and custom applications

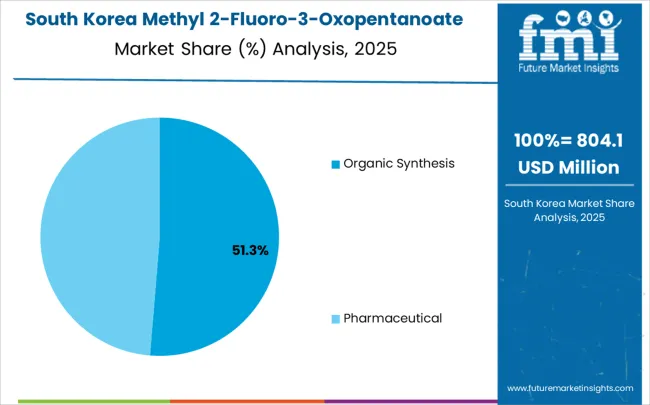
Pharmaceutical Applications Lead Methyl 2-Fluoro-3-Oxopentanoate Services in South Korea

Methyl 2 Fluoro 3 Oxopentanoate Market South Korea Market Share Analysis By Application

In South Korea, the market is expected to remain dominated by pharmaceutical applications, which hold a 65% share in 2025. These applications are typically pharmaceutical intermediate synthesis requirements where fluorinated building blocks require specialized handling and quality assurance. Organic synthesis and research applications each hold 20% and 15% market share respectively, with increasing standardization in academic research protocols. Specialty chemical applications account for the remaining percentage, but are gradually gaining traction in industrial research models due to expanding chemical manufacturing capabilities and cost efficiency improvements.

  • Pharmaceutical manufacturers benefit from established supply networks and quality assurance systems for intermediate procurement
  • Research institutions implement standardized protocols for fluorinated compound handling and synthesis applications
  • Contract manufacturing organizations expand service capabilities for international pharmaceutical client requirements
  • Academic research centers invest in advanced analytical equipment and safety systems for specialized chemical synthesis programs

Competitive Landscape of Methyl 2-Fluoro-3-Oxopentanoate Market

The methyl 2-fluoro-3-oxopentanoate market operates with moderate concentration, dominated by a mix of global research chemical suppliers and specialized Chinese manufacturers. Competition is defined by product purity, regulatory certifications, and customer support, as pharmaceutical and academic users emphasize quality assurance and reliable supply over pricing. Leading global players maintain established reputations for technical documentation and compliance, while regional producers strengthen market share through cost competitiveness, tailored synthesis capabilities, and expanding export networks. Strategic partnerships, capacity expansion, and adherence to international standards remain central to competitive differentiation across the value chain.

Anhui Jinquan Biotechnology, China-based, provides large-scale production emphasizing pharmaceutical-grade quality with cost-efficient distribution for Asian markets. Hangzhou ICH Biofarm specializes in high-purity intermediates, targeting research-driven applications and custom synthesis services for pharmaceutical companies. Fangde New Materials focuses on affordable production with growing investments in international certifications to strengthen global competitiveness.

Jostrong (Tianjin) Technology and Tianmen Hengchang Chemical highlight efficiency and reliability, ensuring stable supply for domestic and regional customers. Nanjing Searchem caters to research-oriented buyers, offering specialized grades for academic and pharmaceutical institutions.

Global suppliers including Sigma-Aldrich (Merck), TCI Chemicals, Fluorochem, Adamas Reagent, and Nanjing Vital Chemical dominate with comprehensive portfolios, regulatory-compliant documentation, and strong distribution networks. Their established credibility makes them preferred partners for pharmaceutical manufacturers and research institutions requiring certified intermediates with stringent quality standards.

Key Players in the Methyl 2-Fluoro-3-Oxopentanoate Market

  • TCI Chemicals
  • Sigma-Aldrich (Merck)
  • Simagchem Corp
  • Dayang Chem (Hangzhou)
  • Hebei Chuanghai Biotechnology Co., Ltd.
  • Wuhan Han Sheng New Material Technology Co., Ltd.
  • Adamas Reagent, Ltd.
  • Nanjing Vital Chemical Co., Ltd.
  • Fluorochem
  • Anhui Jinquan Biotechnology
  • Hangzhou ICH Biofarm
  • Fangde New Materials

Scope of the Report

Item Value
Quantitative Units USD 15 million
Purity Purity ≥95%, Purity ≥99%, Ultra-high purity
Application Organic synthesis, Pharmaceutical intermediates, Research chemicals
Regions Covered North America, Latin America, Europe, East Asia, South Asia & Pacific, Middle East & Africa
Country Covered United States, Canada, United Kingdom, Germany, France, China, Japan, South Korea, India, Brazil, Australia and 40+ countries
Key Companies Profiled TCI Chemicals, Sigma-Aldrich (Merck), Simagchem Corp, Dayang Chem (Hangzhou), Hebei Chuanghai Biotechnology, Wuhan Han Sheng New Material Technology, Adamas Reagent, Nanjing Vital Chemical, Fluorochem, Anhui Jinquan Biotechnology, Hangzhou ICH Biofarm, Fangde New Materials
Additional Attributes Dollar sales by purity grade and application sector, regional consumption trends across North America, Europe, and Asia-Pacific, competitive landscape with established manufacturers and emerging suppliers, buyer preferences for certified versus standard grade products, integration with pharmaceutical quality systems and regulatory compliance frameworks, innovations in purification technologies and analytical testing methods, and development of specialized packaging solutions with enhanced stability and handling safety features.

Methyl 2-Fluoro-3-Oxopentanoate Market by Segments

Purity:

  • Purity ≥95%
  • Purity ≥99%
  • Ultra-high purity

Application:

  • Organic synthesis
  • Pharmaceutical intermediates
  • Research chemicals

End-use Industry:

  • Pharmaceuticals
  • Agrochemicals
  • Specialty chemicals
  • Academic research

Distribution Channel:

  • Direct sales
  • Chemical distributors
  • Online platforms
  • Specialty chemical suppliers

Region:

  • North America
    • United States
    • Canada
    • Mexico
  • Europe
    • Germany
    • United Kingdom
    • France
    • Italy
    • Spain
    • Nordic
    • BENELUX
    • Rest of Europe
  • East Asia
    • China
    • Japan
    • South Korea
  • South Asia & Pacific
    • India
    • ASEAN
    • Australia & New Zealand
    • Rest of South Asia & Pacific
  • Latin America
    • Brazil
    • Chile
    • Rest of Latin America
  • Middle East & Africa
    • Kingdom of Saudi Arabia
    • Other GCC Countries
    • Turkiye
    • South Africa
    • Other African Union
    • Rest of Middle East & Africa

Table of Content

  1. Executive Summary
    • Global Market Outlook
    • Demand to side Trends
    • Supply to side Trends
    • Technology Roadmap Analysis
    • Analysis and Recommendations
  2. Market Overview
    • Market Coverage / Taxonomy
    • Market Definition / Scope / Limitations
  3. Market Background
    • Market Dynamics
      • Drivers
      • Restraints
      • Opportunity
      • Trends
    • Scenario Forecast
      • Demand in Optimistic Scenario
      • Demand in Likely Scenario
      • Demand in Conservative Scenario
    • Opportunity Map Analysis
    • Product Life Cycle Analysis
    • Supply Chain Analysis
    • Investment Feasibility Matrix
    • Value Chain Analysis
    • PESTLE and Porter’s Analysis
    • Regulatory Landscape
    • Regional Parent Market Outlook
    • Production and Consumption Statistics
    • Import and Export Statistics
  4. Global Market Analysis 2020 to 2024 and Forecast, 2025 to 2035
    • Historical Market Size Value (USD Million) Analysis, 2020 to 2024
    • Current and Future Market Size Value (USD Million) Projections, 2025 to 2035
      • Y to o to Y Growth Trend Analysis
      • Absolute $ Opportunity Analysis
  5. Global Market Pricing Analysis 2020 to 2024 and Forecast 2025 to 2035
  6. Global Market Analysis 2020 to 2024 and Forecast 2025 to 2035, By Classification
    • Introduction / Key Findings
    • Historical Market Size Value (USD Million) Analysis By Classification , 2020 to 2024
    • Current and Future Market Size Value (USD Million) Analysis and Forecast By Classification , 2025 to 2035
      • Purity≥95%
      • Purity≥99%
    • Y to o to Y Growth Trend Analysis By Classification , 2020 to 2024
    • Absolute $ Opportunity Analysis By Classification , 2025 to 2035
  7. Global Market Analysis 2020 to 2024 and Forecast 2025 to 2035, By Application
    • Introduction / Key Findings
    • Historical Market Size Value (USD Million) Analysis By Application, 2020 to 2024
    • Current and Future Market Size Value (USD Million) Analysis and Forecast By Application, 2025 to 2035
      • Organic Synthesis
      • Pharmaceutical
    • Y to o to Y Growth Trend Analysis By Application, 2020 to 2024
    • Absolute $ Opportunity Analysis By Application, 2025 to 2035
  8. Global Market Analysis 2020 to 2024 and Forecast 2025 to 2035, By Region
    • Introduction
    • Historical Market Size Value (USD Million) Analysis By Region, 2020 to 2024
    • Current Market Size Value (USD Million) Analysis and Forecast By Region, 2025 to 2035
      • North America
      • Latin America
      • Western Europe
      • Eastern Europe
      • East Asia
      • South Asia and Pacific
      • Middle East & Africa
    • Market Attractiveness Analysis By Region
  9. North America Market Analysis 2020 to 2024 and Forecast 2025 to 2035, By Country
    • Historical Market Size Value (USD Million) Trend Analysis By Market Taxonomy, 2020 to 2024
    • Market Size Value (USD Million) Forecast By Market Taxonomy, 2025 to 2035
      • By Country
        • USA
        • Canada
        • Mexico
      • By Classification
      • By Application
    • Market Attractiveness Analysis
      • By Country
      • By Classification
      • By Application
    • Key Takeaways
  10. Latin America Market Analysis 2020 to 2024 and Forecast 2025 to 2035, By Country
    • Historical Market Size Value (USD Million) Trend Analysis By Market Taxonomy, 2020 to 2024
    • Market Size Value (USD Million) Forecast By Market Taxonomy, 2025 to 2035
      • By Country
        • Brazil
        • Chile
        • Rest of Latin America
      • By Classification
      • By Application
    • Market Attractiveness Analysis
      • By Country
      • By Classification
      • By Application
    • Key Takeaways
  11. Western Europe Market Analysis 2020 to 2024 and Forecast 2025 to 2035, By Country
    • Historical Market Size Value (USD Million) Trend Analysis By Market Taxonomy, 2020 to 2024
    • Market Size Value (USD Million) Forecast By Market Taxonomy, 2025 to 2035
      • By Country
        • Germany
        • UK
        • Italy
        • Spain
        • France
        • Nordic
        • BENELUX
        • Rest of Western Europe
      • By Classification
      • By Application
    • Market Attractiveness Analysis
      • By Country
      • By Classification
      • By Application
    • Key Takeaways
  12. Eastern Europe Market Analysis 2020 to 2024 and Forecast 2025 to 2035, By Country
    • Historical Market Size Value (USD Million) Trend Analysis By Market Taxonomy, 2020 to 2024
    • Market Size Value (USD Million) Forecast By Market Taxonomy, 2025 to 2035
      • By Country
        • Russia
        • Poland
        • Hungary
        • Balkan & Baltic
        • Rest of Eastern Europe
      • By Classification
      • By Application
    • Market Attractiveness Analysis
      • By Country
      • By Classification
      • By Application
    • Key Takeaways
  13. East Asia Market Analysis 2020 to 2024 and Forecast 2025 to 2035, By Country
    • Historical Market Size Value (USD Million) Trend Analysis By Market Taxonomy, 2020 to 2024
    • Market Size Value (USD Million) Forecast By Market Taxonomy, 2025 to 2035
      • By Country
        • China
        • Japan
        • South Korea
      • By Classification
      • By Application
    • Market Attractiveness Analysis
      • By Country
      • By Classification
      • By Application
    • Key Takeaways
  14. South Asia and Pacific Market Analysis 2020 to 2024 and Forecast 2025 to 2035, By Country
    • Historical Market Size Value (USD Million) Trend Analysis By Market Taxonomy, 2020 to 2024
    • Market Size Value (USD Million) Forecast By Market Taxonomy, 2025 to 2035
      • By Country
        • India
        • ASEAN
        • Australia & New Zealand
        • Rest of South Asia and Pacific
      • By Classification
      • By Application
    • Market Attractiveness Analysis
      • By Country
      • By Classification
      • By Application
    • Key Takeaways
  15. Middle East & Africa Market Analysis 2020 to 2024 and Forecast 2025 to 2035, By Country
    • Historical Market Size Value (USD Million) Trend Analysis By Market Taxonomy, 2020 to 2024
    • Market Size Value (USD Million) Forecast By Market Taxonomy, 2025 to 2035
      • By Country
        • Kingdom of Saudi Arabia
        • Other GCC Countries
        • Turkiye
        • South Africa
        • Other African Union
        • Rest of Middle East & Africa
      • By Classification
      • By Application
    • Market Attractiveness Analysis
      • By Country
      • By Classification
      • By Application
    • Key Takeaways
  16. Key Countries Market Analysis
    • USA
      • Pricing Analysis
      • Market Share Analysis, 2024
        • By Classification
        • By Application
    • Canada
      • Pricing Analysis
      • Market Share Analysis, 2024
        • By Classification
        • By Application
    • Mexico
      • Pricing Analysis
      • Market Share Analysis, 2024
        • By Classification
        • By Application
    • Brazil
      • Pricing Analysis
      • Market Share Analysis, 2024
        • By Classification
        • By Application
    • Chile
      • Pricing Analysis
      • Market Share Analysis, 2024
        • By Classification
        • By Application
    • Germany
      • Pricing Analysis
      • Market Share Analysis, 2024
        • By Classification
        • By Application
    • UK
      • Pricing Analysis
      • Market Share Analysis, 2024
        • By Classification
        • By Application
    • Italy
      • Pricing Analysis
      • Market Share Analysis, 2024
        • By Classification
        • By Application
    • Spain
      • Pricing Analysis
      • Market Share Analysis, 2024
        • By Classification
        • By Application
    • France
      • Pricing Analysis
      • Market Share Analysis, 2024
        • By Classification
        • By Application
    • India
      • Pricing Analysis
      • Market Share Analysis, 2024
        • By Classification
        • By Application
    • ASEAN
      • Pricing Analysis
      • Market Share Analysis, 2024
        • By Classification
        • By Application
    • Australia & New Zealand
      • Pricing Analysis
      • Market Share Analysis, 2024
        • By Classification
        • By Application
    • China
      • Pricing Analysis
      • Market Share Analysis, 2024
        • By Classification
        • By Application
    • Japan
      • Pricing Analysis
      • Market Share Analysis, 2024
        • By Classification
        • By Application
    • South Korea
      • Pricing Analysis
      • Market Share Analysis, 2024
        • By Classification
        • By Application
    • Russia
      • Pricing Analysis
      • Market Share Analysis, 2024
        • By Classification
        • By Application
    • Poland
      • Pricing Analysis
      • Market Share Analysis, 2024
        • By Classification
        • By Application
    • Hungary
      • Pricing Analysis
      • Market Share Analysis, 2024
        • By Classification
        • By Application
    • Kingdom of Saudi Arabia
      • Pricing Analysis
      • Market Share Analysis, 2024
        • By Classification
        • By Application
    • Turkiye
      • Pricing Analysis
      • Market Share Analysis, 2024
        • By Classification
        • By Application
    • South Africa
      • Pricing Analysis
      • Market Share Analysis, 2024
        • By Classification
        • By Application
  17. Market Structure Analysis
    • Competition Dashboard
    • Competition Benchmarking
    • Market Share Analysis of Top Players
      • By Regional
      • By Classification
      • By Application
  18. Competition Analysis
    • Competition Deep Dive
      • Hangzhou ICH Biofarm
        • Overview
        • Product Portfolio
        • Profitability by Market Segments (Product/Age /Sales Channel/Region)
        • Sales Footprint
        • Strategy Overview
          • Marketing Strategy
          • Product Strategy
          • Channel Strategy
      • Fangde New Materials
      • Jostrong (Tianjin) Technology
      • Tianmen Hengchang Chemical
      • Nanjing Searchem
  19. Assumptions & Acronyms Used
  20. Research Methodology

List of Tables

  • Table 1: Global Market Value (USD Million) Forecast by Region, 2020 to 2035
  • Table 2: Global Market Value (USD Million) Forecast by Classification , 2020 to 2035
  • Table 3: Global Market Value (USD Million) Forecast by Application, 2020 to 2035
  • Table 4: North America Market Value (USD Million) Forecast by Country, 2020 to 2035
  • Table 5: North America Market Value (USD Million) Forecast by Classification , 2020 to 2035
  • Table 6: North America Market Value (USD Million) Forecast by Application, 2020 to 2035
  • Table 7: Latin America Market Value (USD Million) Forecast by Country, 2020 to 2035
  • Table 8: Latin America Market Value (USD Million) Forecast by Classification , 2020 to 2035
  • Table 9: Latin America Market Value (USD Million) Forecast by Application, 2020 to 2035
  • Table 10: Western Europe Market Value (USD Million) Forecast by Country, 2020 to 2035
  • Table 11: Western Europe Market Value (USD Million) Forecast by Classification , 2020 to 2035
  • Table 12: Western Europe Market Value (USD Million) Forecast by Application, 2020 to 2035
  • Table 13: Eastern Europe Market Value (USD Million) Forecast by Country, 2020 to 2035
  • Table 14: Eastern Europe Market Value (USD Million) Forecast by Classification , 2020 to 2035
  • Table 15: Eastern Europe Market Value (USD Million) Forecast by Application, 2020 to 2035
  • Table 16: East Asia Market Value (USD Million) Forecast by Country, 2020 to 2035
  • Table 17: East Asia Market Value (USD Million) Forecast by Classification , 2020 to 2035
  • Table 18: East Asia Market Value (USD Million) Forecast by Application, 2020 to 2035
  • Table 19: South Asia and Pacific Market Value (USD Million) Forecast by Country, 2020 to 2035
  • Table 20: South Asia and Pacific Market Value (USD Million) Forecast by Classification , 2020 to 2035
  • Table 21: South Asia and Pacific Market Value (USD Million) Forecast by Application, 2020 to 2035
  • Table 22: Middle East & Africa Market Value (USD Million) Forecast by Country, 2020 to 2035
  • Table 23: Middle East & Africa Market Value (USD Million) Forecast by Classification , 2020 to 2035
  • Table 24: Middle East & Africa Market Value (USD Million) Forecast by Application, 2020 to 2035

List of Figures

  • Figure 1: Global Market Pricing Analysis
  • Figure 2: Global Market Value (USD Million) Forecast 2020-2035
  • Figure 3: Global Market Value Share and BPS Analysis by Classification , 2025 and 2035
  • Figure 4: Global Market Y to o to Y Growth Comparison by Classification , 2025-2035
  • Figure 5: Global Market Attractiveness Analysis by Classification
  • Figure 6: Global Market Value Share and BPS Analysis by Application, 2025 and 2035
  • Figure 7: Global Market Y to o to Y Growth Comparison by Application, 2025-2035
  • Figure 8: Global Market Attractiveness Analysis by Application
  • Figure 9: Global Market Value (USD Million) Share and BPS Analysis by Region, 2025 and 2035
  • Figure 10: Global Market Y to o to Y Growth Comparison by Region, 2025-2035
  • Figure 11: Global Market Attractiveness Analysis by Region
  • Figure 12: North America Market Incremental Dollar Opportunity, 2025-2035
  • Figure 13: Latin America Market Incremental Dollar Opportunity, 2025-2035
  • Figure 14: Western Europe Market Incremental Dollar Opportunity, 2025-2035
  • Figure 15: Eastern Europe Market Incremental Dollar Opportunity, 2025-2035
  • Figure 16: East Asia Market Incremental Dollar Opportunity, 2025-2035
  • Figure 17: South Asia and Pacific Market Incremental Dollar Opportunity, 2025-2035
  • Figure 18: Middle East & Africa Market Incremental Dollar Opportunity, 2025-2035
  • Figure 19: North America Market Value Share and BPS Analysis by Country, 2025 and 2035
  • Figure 20: North America Market Value Share and BPS Analysis by Classification , 2025 and 2035
  • Figure 21: North America Market Y to o to Y Growth Comparison by Classification , 2025-2035
  • Figure 22: North America Market Attractiveness Analysis by Classification
  • Figure 23: North America Market Value Share and BPS Analysis by Application, 2025 and 2035
  • Figure 24: North America Market Y to o to Y Growth Comparison by Application, 2025-2035
  • Figure 25: North America Market Attractiveness Analysis by Application
  • Figure 26: Latin America Market Value Share and BPS Analysis by Country, 2025 and 2035
  • Figure 27: Latin America Market Value Share and BPS Analysis by Classification , 2025 and 2035
  • Figure 28: Latin America Market Y to o to Y Growth Comparison by Classification , 2025-2035
  • Figure 29: Latin America Market Attractiveness Analysis by Classification
  • Figure 30: Latin America Market Value Share and BPS Analysis by Application, 2025 and 2035
  • Figure 31: Latin America Market Y to o to Y Growth Comparison by Application, 2025-2035
  • Figure 32: Latin America Market Attractiveness Analysis by Application
  • Figure 33: Western Europe Market Value Share and BPS Analysis by Country, 2025 and 2035
  • Figure 34: Western Europe Market Value Share and BPS Analysis by Classification , 2025 and 2035
  • Figure 35: Western Europe Market Y to o to Y Growth Comparison by Classification , 2025-2035
  • Figure 36: Western Europe Market Attractiveness Analysis by Classification
  • Figure 37: Western Europe Market Value Share and BPS Analysis by Application, 2025 and 2035
  • Figure 38: Western Europe Market Y to o to Y Growth Comparison by Application, 2025-2035
  • Figure 39: Western Europe Market Attractiveness Analysis by Application
  • Figure 40: Eastern Europe Market Value Share and BPS Analysis by Country, 2025 and 2035
  • Figure 41: Eastern Europe Market Value Share and BPS Analysis by Classification , 2025 and 2035
  • Figure 42: Eastern Europe Market Y to o to Y Growth Comparison by Classification , 2025-2035
  • Figure 43: Eastern Europe Market Attractiveness Analysis by Classification
  • Figure 44: Eastern Europe Market Value Share and BPS Analysis by Application, 2025 and 2035
  • Figure 45: Eastern Europe Market Y to o to Y Growth Comparison by Application, 2025-2035
  • Figure 46: Eastern Europe Market Attractiveness Analysis by Application
  • Figure 47: East Asia Market Value Share and BPS Analysis by Country, 2025 and 2035
  • Figure 48: East Asia Market Value Share and BPS Analysis by Classification , 2025 and 2035
  • Figure 49: East Asia Market Y to o to Y Growth Comparison by Classification , 2025-2035
  • Figure 50: East Asia Market Attractiveness Analysis by Classification
  • Figure 51: East Asia Market Value Share and BPS Analysis by Application, 2025 and 2035
  • Figure 52: East Asia Market Y to o to Y Growth Comparison by Application, 2025-2035
  • Figure 53: East Asia Market Attractiveness Analysis by Application
  • Figure 54: South Asia and Pacific Market Value Share and BPS Analysis by Country, 2025 and 2035
  • Figure 55: South Asia and Pacific Market Value Share and BPS Analysis by Classification , 2025 and 2035
  • Figure 56: South Asia and Pacific Market Y to o to Y Growth Comparison by Classification , 2025-2035
  • Figure 57: South Asia and Pacific Market Attractiveness Analysis by Classification
  • Figure 58: South Asia and Pacific Market Value Share and BPS Analysis by Application, 2025 and 2035
  • Figure 59: South Asia and Pacific Market Y to o to Y Growth Comparison by Application, 2025-2035
  • Figure 60: South Asia and Pacific Market Attractiveness Analysis by Application
  • Figure 61: Middle East & Africa Market Value Share and BPS Analysis by Country, 2025 and 2035
  • Figure 62: Middle East & Africa Market Value Share and BPS Analysis by Classification , 2025 and 2035
  • Figure 63: Middle East & Africa Market Y to o to Y Growth Comparison by Classification , 2025-2035
  • Figure 64: Middle East & Africa Market Attractiveness Analysis by Classification
  • Figure 65: Middle East & Africa Market Value Share and BPS Analysis by Application, 2025 and 2035
  • Figure 66: Middle East & Africa Market Y to o to Y Growth Comparison by Application, 2025-2035
  • Figure 67: Middle East & Africa Market Attractiveness Analysis by Application
  • Figure 68: Global Market - Tier Structure Analysis
  • Figure 69: Global Market - Company Share Analysis

Frequently Asked Questions

How big is the methyl 2-fluoro-3-oxopentanoate market in 2025?

The global methyl 2-fluoro-3-oxopentanoate market is estimated to be valued at USD 15.9 million in 2025.

What will be the size of methyl 2-fluoro-3-oxopentanoate market in 2035?

The market size for the methyl 2-fluoro-3-oxopentanoate market is projected to reach USD 27.3 million by 2035.

How much will be the methyl 2-fluoro-3-oxopentanoate market growth between 2025 and 2035?

The methyl 2-fluoro-3-oxopentanoate market is expected to grow at a 5.6% CAGR between 2025 and 2035.

What are the key product types in the methyl 2-fluoro-3-oxopentanoate market?

The key product types in methyl 2-fluoro-3-oxopentanoate market are purity≥95% and purity≥99%.

Which application segment to contribute significant share in the methyl 2-fluoro-3-oxopentanoate market in 2025?

In terms of application, organic synthesis segment to command 52.4% share in the methyl 2-fluoro-3-oxopentanoate market in 2025.

Explore Similar Insights

Future Market Insights

Methyl 2-Fluoro-3-Oxopentanoate Market

Chat With

MaRIA

Hi There, I am MaRIA, Your Market Research Intelligence Assistant. How may I help you?