The global methyl 3-methyl-2-butenoate market is projected to grow from USD 89.2 million in 2025 to USD 142.5 million by 2035, advancing at a CAGR of 4.8%. The methyl 3-methyl-2-butenoate market stands poised for steady expansion over the next decade, transitioning from a USD 89.2 million industry in 2025 to a robust USD 142.5 million market by 2035. This remarkable journey represents an absolute increase of USD 53.3 million, translating to a 59.8% total growth trajectory that will reshape the specialty chemical landscape.
The first half of the decade (2025-2030) will establish the foundation for sustained growth, with market value ascending to USD 112.8 million by 2030. This initial phase contributes USD 23.6 million in value addition, representing 44.2% of the total forecast expansion. Market participants will witness increasing pharmaceutical intermediate demand driving core applications while chemical manufacturers establish enhanced production capabilities to serve growing organic synthesis requirements.
The latter half will witness accelerated momentum from 2030-2035, as the market reaches its projected USD 142.5 million milestone through an additional USD 29.7 million value creation, constituting 55.8% of the decade's expansion. Advanced applications in pharmaceutical synthesis and specialty chemical production will mature during this period, supported by technological improvements in manufacturing processes and expanded regulatory approvals for pharmaceutical-grade applications.
This trajectory means market participants must prepare for increasing competition, establish quality differentiation strategies, and invest in production capacity expansion to capture emerging opportunities in pharmaceutical intermediate applications while maintaining cost competitiveness in traditional organic synthesis markets.
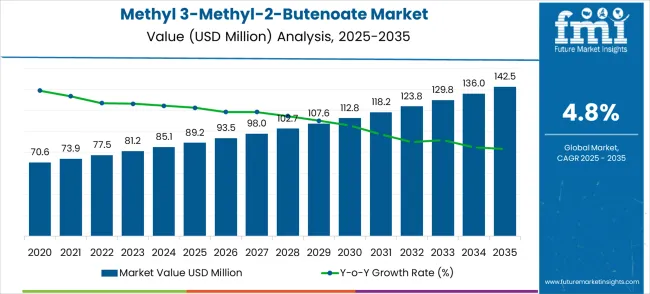
The methyl 3-methyl-2-butenoate market evolution unfolds through two distinct growth phases, each characterized by different market dynamics and competitive factors. The initial period from 2025-2030 represents the market establishment phase, where demand consolidation occurs across pharmaceutical intermediate applications and organic synthesis requirements. During this phase, the market will add USD 23.6 million in value, establishing the groundwork for sustained expansion through improved manufacturing processes and expanded application development.
Market maturation factors during 2025-2030 include standardization of quality specifications for pharmaceutical applications, establishment of reliable supply chains serving multiple geographic regions, and development of cost-effective production processes that enable broader market accessibility. Competitive landscape evolution will feature capacity expansion by established chemical manufacturers, entry of specialized pharmaceutical intermediate suppliers, and consolidation of smaller producers unable to meet growing quality requirements.
The transition phase beginning in 2030 marks a shift toward advanced applications and specialized market segments. The 2030-2035 period will contribute USD 29.7 million in additional market value, driven by pharmaceutical industry expansion requiring specialized intermediates and chemical manufacturers developing enhanced purity grades for regulated applications. Competitive dynamics will evolve toward technical differentiation, regulatory compliance capabilities, and specialized application expertise as market participants compete for higher-value pharmaceutical and specialty chemical applications requiring precise quality specifications and comprehensive analytical documentation.
At-a-Glance Metrics
| Metric | Value |
|---|---|
| Market Value (2025) → | USD 89.2 million |
| Market Forecast (2035) ↑ | USD 142.5 million |
| Growth Rate ★ | 4.8% CAGR |
| Total Market Expansion | 59.8% over forecast decade |
| Segment → | Classification |
| Primary Application → | Organic Synthesis |
The market demonstrates consistent expansion across pharmaceutical intermediate and specialty chemical applications, with Asian manufacturing centers maintaining cost advantages while developed markets emphasize quality differentiation and regulatory compliance. Growth acceleration occurs through pharmaceutical industry expansion requiring specialized building blocks and chemical manufacturers developing advanced purity specifications for regulated applications. Market participants benefit from increasing demand for methyl 3-methyl-2-butenoate in complex synthesis pathways while facing challenges from raw material cost volatility and stringent quality requirements for pharmaceutical-grade applications.
Market expansion rests on three fundamental shifts: 1. Pharmaceutical Industry Development: Pharmaceutical companies increasingly require specialized ester intermediates for complex drug synthesis programs, creating demand for high-purity methyl 3-methyl-2-butenoate as a building block in active pharmaceutical ingredient manufacturing. This shift addresses the industry need for reliable chemical intermediates that enable efficient synthetic routes while meeting regulatory quality standards. 2. Chemical Industry Modernization: Chemical manufacturers are investing in advanced production technologies that enable consistent quality production of specialized esters, reducing manufacturing costs while improving product specifications. This modernization solves production scalability challenges and enables broader market accessibility for pharmaceutical and specialty chemical applications. 3. Regulatory Framework Evolution: Regulatory agencies are establishing clearer guidelines for chemical intermediates used in pharmaceutical manufacturing, reducing approval uncertainties and enabling broader commercial deployment across diverse therapeutic applications requiring specialized ester chemistry. Growth faces headwinds from raw material price volatility affecting production costs, limited manufacturing capacity for pharmaceutical-grade specifications creating supply constraints, and increasing quality documentation requirements that raise compliance costs for suppliers serving regulated pharmaceutical markets.
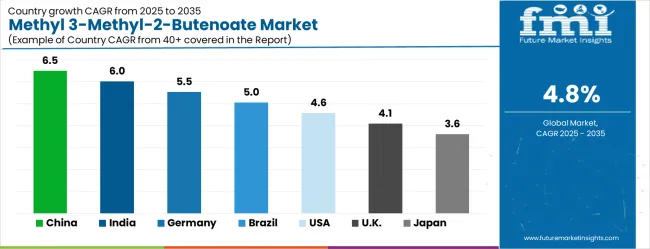
The Methyl 3-Methyl-2-Butenoate market (USD 89.2M → 142.5M by 2035, CAGR ~4.8%) is shaped by its role as an intermediate in organic synthesis and pharmaceutical manufacturing, supported by demand for fragrance chemicals, fine chemicals, and specialty intermediates. Growth is led by Asia-Pacific (China 6.5% CAGR, India 6.0%), while Germany and Brazil remain strong specialty markets. Rising demand for ≥99% purity grades and diversified applications creates ~USD 53M incremental revenue opportunities by 2035.
The methyl 3-methyl-2-butenoate market operates through a structured classification system that enables comprehensive analysis of demand patterns and growth opportunities.
Primary Classification: Purity Specifications The Methyl 3-Methyl-2-Butenoate market is segmented by purity into Pharmaceutical-Grade (99% purity) and Industrial-Grade materials. Pharmaceutical-Grade products cater to stringent regulatory and quality requirements, supporting applications in drug development and high-precision chemical processes. Industrial-Grade materials address cost-sensitive industrial applications, where slightly lower purity levels are sufficient for chemical manufacturing, specialty materials, and bulk production processes.
Secondary Breakdown: Application Segments Applications span Organic Synthesis, Pharmaceutical Intermediates, and Specialty Chemical Applications. Organic Synthesis represents broad chemical manufacturing processes, driving demand for both purity grades. Pharmaceutical Intermediates highlight high-value, high-purity requirements in drug development pipelines. Specialty Chemical Applications focus on advanced materials and niche formulations, emphasizing precision, performance, and regulatory compliance.
Regional Framework: Geographic Distribution Regionally, Asia Pacific dominates as a manufacturing hub due to cost-effective production and scale advantages. North America emphasizes pharmaceutical applications, where high-purity specifications and regulatory adherence are critical. Europe prioritizes strict quality standards, driving demand for pharmaceutical-grade materials. Emerging markets focus on cost-sensitive industrial applications, leveraging industrial-grade materials to optimize production economics.
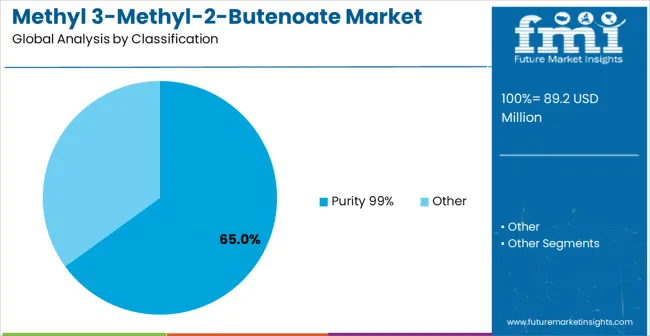
The Purity ≥99% grade segment commands a dominant position in the market, primarily due to stringent pharmaceutical industry requirements for high-quality intermediates and specialty chemical applications demanding consistent specifications. The segment’s market leadership is reinforced by the critical need for ultra-pure materials in drug development programs, where impurities can adversely affect synthetic pathways, reaction efficiency, and regulatory compliance. Pharmaceutical companies rely on these high-purity intermediates for active pharmaceutical ingredient (API) synthesis, ensuring predictable yields, reproducibility, and adherence to International Council for Harmonisation (ICH) guidelines. The value of this segment is further reflected in premium pricing structures that account for specialized manufacturing processes, comprehensive quality control systems, and extensive regulatory documentation. Suppliers capable of consistently delivering 99% purity benefit from technical barriers that serve as competitive moats, as achieving pharmaceutical-grade specifications requires advanced purification technologies, cleanroom manufacturing environments, and analytical expertise. Established manufacturers enjoy advantages through customer qualification processes and regulatory documentation requirements, creating switching costs and fostering long-term relationships with pharmaceutical clients. However, the segment faces operational challenges, including manufacturing complexity, equipment investments, and ongoing quality assurance requirements that can increase operational costs and limit entry for new competitors.
Key Highlights:
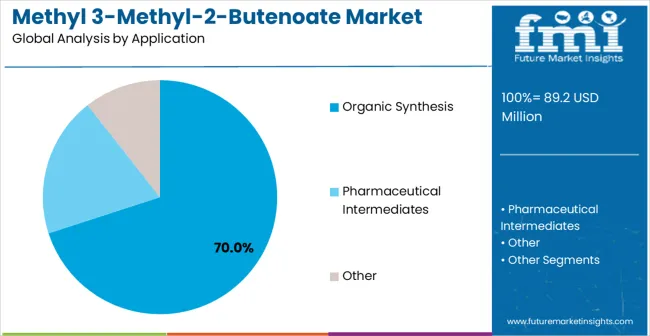
The organic synthesis segment represents the largest application area for methyl 3-methyl-2-butenoate, accounting for approximately 70% of market share. Its strategic importance lies in its versatility as a building block for complex molecule construction in both chemical manufacturing and pharmaceutical intermediate synthesis. The chemical’s inherent reactivity and functional group compatibility enable diverse synthetic pathways, making it a preferred choice for constructing heterocyclic compounds, esters, and advanced specialty chemicals. Growth in this segment is primarily driven by pharmaceutical companies developing complex therapeutic compounds that require cost-effective and reliable synthetic intermediates. The compound’s versatility reduces manufacturing complexity and enables efficient reaction processes, ensuring predictable yields and consistent supply chains for manufacturers. Additionally, research institutions and chemical companies rely on organic synthesis applications for method development, process optimization, and scaling experimental protocols to commercial production. Forward-looking implications suggest sustained market share expansion as pharmaceutical pipelines expand, necessitating specialized ester intermediates and high-quality building blocks. Suppliers that provide technical support, analytical documentation, and reliable product quality are positioned to capture significant value in this segment.
Key Highlights:
The pharmaceutical intermediates segment of the methyl 3-methyl-2-butenoate market is emerging as a high-growth area, reflecting increasing demand for specialized building blocks in complex drug synthesis programs. Although it currently represents a smaller share compared to organic synthesis applications, its growth trajectory is robust due to the expanding pharmaceutical industry, regulatory approvals enabling broader commercial deployment, and increasing complexity in therapeutic compound development. Companies developing APIs and novel therapeutics require reliable intermediates that meet stringent quality and purity standards, ensuring successful clinical trials and regulatory compliance. The segment offers premium pricing opportunities, as suppliers delivering pharmaceutical-grade materials can command higher margins through quality differentiation, technical support services, and comprehensive regulatory documentation. Growth is further accelerated by partnerships with pharmaceutical companies for custom synthesis programs and specialized applications. However, the segment is subject to certain risks, including regulatory approval delays, pharmaceutical industry consolidation affecting procurement patterns, and competition from alternative synthetic routes. Suppliers capable of navigating regulatory frameworks, providing consistent high-purity intermediates, and offering technical expertise are well-positioned to capitalize on the segment’s growth potential.
Key Highlights:
Pharmaceutical industry expansion drives sustained demand for specialized chemical intermediates, creating direct value through reduced development timelines and improved synthetic efficiency for drug manufacturers. Chemical companies require reliable access to high-purity esters for complex molecule construction, particularly in therapeutic compound development where methyl 3-methyl-2-butenoate serves as a versatile building block. Regulatory framework clarification for pharmaceutical intermediates reduces approval uncertainties and enables broader commercial deployment, while manufacturing technology improvements reduce production costs and improve quality consistency for pharmaceutical-grade applications.
Manufacturing capacity constraints limit supply availability for pharmaceutical-grade specifications, creating bottlenecks during peak demand periods and affecting customer supply security. Raw material cost volatility impacts pricing stability and margin predictability for chemical manufacturers, while limited supplier base for specialized precursors creates supply chain vulnerabilities. Quality documentation requirements for pharmaceutical applications demand extensive analytical testing and regulatory compliance infrastructure that increases operational costs and creates barriers for smaller manufacturers seeking market entry.
Asia Pacific manufacturing concentration accelerates regional supply chain development, while quality differentiation trends favor suppliers with pharmaceutical-grade capabilities and regulatory compliance expertise. Chemical manufacturers increasingly invest in advanced purification technologies and automated quality control systems that improve production efficiency while meeting pharmaceutical industry requirements. Pharmaceutical companies develop strategic supplier relationships with qualified chemical manufacturers, though economic downturns affecting research spending could reduce demand for specialized intermediates and delay pharmaceutical development programs requiring high-purity chemical building blocks.
| Country | CAGR (2025-2035) |
|---|---|
| China | 6.5% |
| India | 6% |
| Germany | 5.5% |
| Brazil | 5% |
| USA | 4.6% |
| UK | 4.1% |
| Japan | 3.6% |
The methyl 3-methyl-2-butenoate market demonstrates varied growth patterns across global regions, with distinct performance tiers emerging based on manufacturing capabilities and application demand. Growth leaders include China at 6.5% CAGR and India at 6.0% CAGR, benefiting from chemical manufacturing expertise and expanding pharmaceutical production. Steady performers encompass Germany at 5.5% CAGR and Brazil at 5.0% CAGR, representing established chemical industries with consistent demand growth. Emerging markets feature the United States at 4.6% CAGR, United Kingdom at 4.1% CAGR, and Japan at 3.6% CAGR, emphasizing pharmaceutical applications and quality differentiation.
Regional synthesis reveals manufacturing concentration in Asia Pacific driving cost competitiveness, while developed markets emphasize pharmaceutical applications and regulatory compliance. Market integration occurs through established supply chains connecting Asian production centers with pharmaceutical and chemical companies in developed markets requiring specialized intermediates for drug development and specialty chemical manufacturing applications.
The report covers an in-depth analysis of 40+ countries top-performing countries are highlighted below.
China maintains market leadership through chemical synthesis expertise and manufacturing scale advantages that enable cost-competitive production of methyl 3-methyl-2-butenoate for both domestic consumption and international export markets. The country's growth trajectory of 6.5% through 2035 reflects government support for chemical industry modernization, expanding pharmaceutical manufacturing capabilities, and established supply chains serving global customers. Major chemical manufacturing zones in Shanghai, Jiangsu, and Shandong provinces report consistent demand growth from pharmaceutical intermediate applications and organic synthesis requirements, while domestic pharmaceutical companies increasingly utilize locally-produced materials for drug development programs. Chemical manufacturers invest in quality improvement programs and regulatory compliance systems to serve international pharmaceutical customers requiring high-purity specifications. The market benefits from skilled technical workforce, established infrastructure for chemical manufacturing, and government policies supporting specialty chemical production for pharmaceutical and advanced materials applications.
Strategic Market Indicators:
Pharmaceutical industry in India expansion creates substantial growth opportunities with market advancement of 6% CAGR reflecting the country's established pharmaceutical manufacturing capabilities and expanding chemical production infrastructure. Mumbai and Hyderabad pharmaceutical clusters drive demand for specialized intermediates while chemical manufacturers in Gujarat and Andhra Pradesh states develop production capabilities serving both domestic and export markets. The market benefits from cost-competitive manufacturing, skilled technical workforce, and government initiatives supporting pharmaceutical industry development through policy incentives and infrastructure investments. Research institutions collaborate with chemical manufacturers to develop synthesis methodologies while pharmaceutical companies require reliable supplies of high-purity intermediates for generic drug production and new therapeutic development programs.
Market Intelligence Brief:
German chemical industry expertise drives market growth of 5.5% through emphasis on quality differentiation and pharmaceutical-grade production capabilities meeting European Union regulatory standards. Frankfurt and Munich chemical companies utilize methyl 3-methyl-2-butenoate for pharmaceutical synthesis while manufacturers in North Rhine-Westphalia maintain production facilities serving both domestic and European export markets. The country's regulatory compliance expertise enables market access across European pharmaceutical applications requiring stringent quality documentation and analytical validation. Chemical manufacturers invest in advanced purification technologies and quality control systems while collaborating with pharmaceutical companies on specialized intermediate development programs. Growth reaches 5.5% through 2035.
Strategic Market Considerations:
Brazil's chemical industry development creates growing market opportunities through expanding pharmaceutical manufacturing and chemical intermediate production capabilities. São Paulo and Rio de Janeiro pharmaceutical companies utilize methyl 3-methyl-2-butenoate for drug synthesis while chemical manufacturers invest in production capacity serving domestic market demand. The challenge involves developing pharmaceutical-grade production capabilities while maintaining cost competitiveness against established international suppliers and meeting regulatory requirements for pharmaceutical applications. Growth patterns indicate steady advancement driven by pharmaceutical industry expansion and chemical manufacturing capability development.
Performance Metrics:
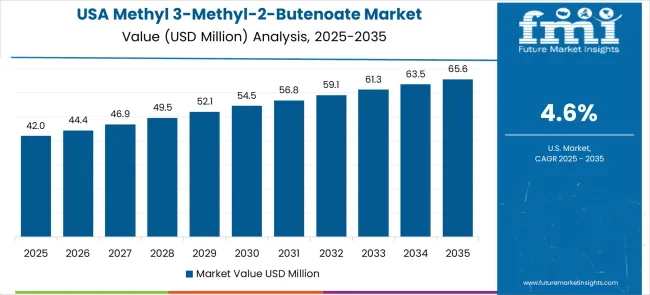
The United States leads pharmaceutical research applications based on cost-per-outcome compression under compliance and reliability constraints through advanced drug development programs and specialized intermediate requirements. CAGR 4.6% through 2035 reflects pharmaceutical companies adopting methyl 3-methyl-2-butenoate for drug discovery programs requiring regulatory compliance while biotechnology firms utilize specialized intermediates for novel therapeutic development. Chemical distributors expand pharmaceutical industry supply networks through specialized distribution channels serving research institutions and pharmaceutical companies. Boston, San Francisco pharmaceutical research clusters report consistent procurement of chemical intermediates for drug development programs requiring high-purity specifications and comprehensive analytical documentation.
Strategic Market Indicators:
The UK market represents medium growth potential with pharmaceutical and chemical companies concentrated in Cambridge, Oxford, and London metropolitan areas utilizing specialized intermediates for research applications and pharmaceutical development. Academic institutions require high-purity materials for organic chemistry research while pharmaceutical companies demand consistent quality specifications for drug synthesis programs. Growth scenarios indicate steady market development supported by established pharmaceutical industry presence and research institution stability, though economic constraints may affect procurement patterns and research spending levels.
Chemical and pharmaceutical industries in Japan maintain consistent demand for high-purity methyl 3-methyl-2-butenoate across Tokyo, Osaka, and Yokohama research centers and manufacturing facilities. Companies emphasize quality excellence and technical precision while serving domestic pharmaceutical applications requiring strict specifications and comprehensive quality documentation. The market benefits from established regulatory frameworks supporting pharmaceutical intermediate applications and chemical manufacturers maintaining advanced quality control systems exceeding international standards. Growth reaches 3.6% through mature market conditions with stable pharmaceutical company requirements and consistent chemical industry demand patterns.
Current Market Observations:
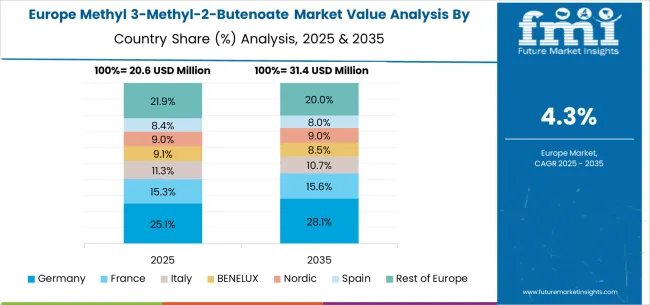
The European methyl 3-methyl-2-butenoate market demonstrates integrated development across established chemical manufacturing regions and pharmaceutical research centers, with Germany leading through technical expertise and regulatory compliance capabilities while maintaining production facilities serving multiple European markets. France contributes through pharmaceutical company requirements and chemical manufacturing infrastructure, particularly in Lyon and Paris regions where companies focus on specialized intermediate production. The UK maintains pharmaceutical research applications concentrated in academic and biotechnology centers requiring high-purity materials for drug discovery programs.
Italy and Spain show steady growth in pharmaceutical applications, with companies developing capabilities for generic drug manufacturing requiring specialized building blocks and consistent quality specifications. BENELUX countries contribute through chemical distribution networks and pharmaceutical industry support, while Eastern European markets develop cost-effective production capabilities for industrial-grade applications serving regional chemical manufacturing requirements.
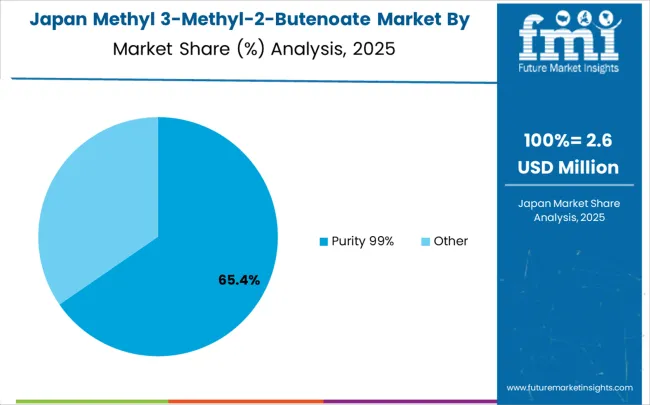
In Japan, the methyl 3-methyl-2-butenoate market is largely driven by the Purity 99% segment, which accounts for 75% of total market revenues in 2025. The pharmaceutical-grade requirements in domestic drug development programs and chemical manufacturing quality specifications drive this segment dominance. Industrial-grade materials follow with a 25% share, primarily utilized in chemical synthesis applications requiring standard purity levels. The market structure reflects Japan's emphasis on quality differentiation and pharmaceutical industry requirements for high-purity intermediates.
Market Characteristics:
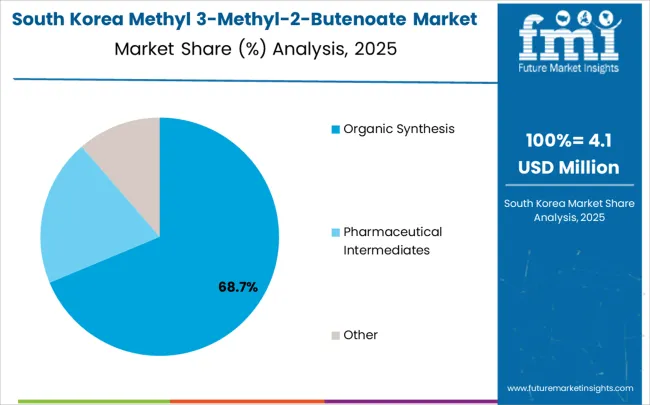
In South Korea, the market is expected to remain dominated by chemical manufacturers, which hold a 60% share in 2025. These manufacturers typically serve pharmaceutical companies requiring specialized intermediates for drug synthesis programs and chemical companies utilizing materials for organic synthesis applications. Pharmaceutical distributors and specialty chemical suppliers each hold 20% market share, with growing standardization in quality requirements across different supplier categories.
Channel Insights:
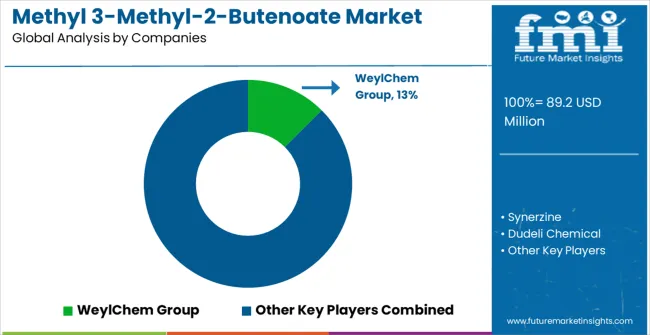
The methyl 3-methyl-2-butenoate market operates through a moderately concentrated structure with approximately 12-15 meaningful players globally, showing moderate concentration where the top five companies hold roughly 60% market share. Competition emphasizes quality differentiation, pharmaceutical-grade certifications, and technical support capabilities rather than price-based strategies alone.
Tier 1 leaders encompass WeylChem Group and Synerzine, which maintain dominant positions through specialized synthesis expertise, pharmaceutical-grade manufacturing capabilities, and established relationships with major pharmaceutical customers. These companies benefit from economies of scale in production, comprehensive quality control systems, and regulatory compliance expertise that creates customer switching costs. Competitive advantages include proprietary synthesis technologies, pharmaceutical industry certifications, and global distribution networks serving multiple geographic markets.
Tier 2 challengers include Dudeli Chemical, Hangzhou Insure Chemical, and Nantong Zhonghe Chemical New Materials, competing through regional market expertise, cost-effective manufacturing capabilities, and specialized application focus. These companies typically serve specific geographic regions or application segments while building capabilities to expand market reach. Growth strategies include capacity expansion, quality improvements, and pharmaceutical industry partnership development.
Tier 3 specialists encompass Qingdao Bangli Chemical, Gansu Zeyou New Materials, Caihe Biotech, Fushun Shunte Chemical, and East Star Biotech, focusing on niche applications, regional markets, or specific customer segments while developing technical capabilities. These companies often pursue specialized applications, custom synthesis services, or cost-sensitive market segments while building expertise and market presence.
Competitive dynamics between tiers involve technology advancement in synthesis methods, quality certification development, and pharmaceutical industry relationship building. Market evolution trends suggest continued consolidation among smaller players while established manufacturers expand pharmaceutical-grade production capabilities and regulatory compliance systems through strategic investments and customer partnership development.
| Item | Value |
|---|---|
| Quantitative Units | USD 142.5 million |
| Purity Grade | Purity 99%, Other |
| Application | Organic Synthesis, Pharmaceutical Intermediates, Other |
| Regions Covered | North America, Latin America, Europe, East Asia, South Asia & Pacific, Middle East & Africa |
| Countries Covered | United States, Canada, United Kingdom, Germany, France, China, Japan, South Korea, India, Brazil, Australia and 40+ countries |
| Key Companies Profiled | WeylChem Group, Synerzine, Dudeli Chemical, Hangzhou Insure Chemical, Nantong Zhonghe Chemical New Materials, Qingdao Bangli Chemical, Gansu Zeyou New Materials, Caihe Biotech, Fushun Shunte Chemical, East Star Biotech |
| Additional Attributes | Dollar sales by purity grade and application segments, regional consumption trends across North America, Europe, and Asia-Pacific, competitive landscape with specialized chemical manufacturers and pharmaceutical suppliers, adoption patterns for pharmaceutical-grade versus industrial-grade applications, integration with pharmaceutical development programs and chemical synthesis requirements, innovations in purification technologies and quality control systems, and development of specialized applications with enhanced purity specifications for drug discovery and pharmaceutical manufacturing processes. |
The global methyl 3-methyl-2-butenoate market is estimated to be valued at USD 89.2 million in 2025.
The market size for the methyl 3-methyl-2-butenoate market is projected to reach USD 142.5 million by 2035.
The methyl 3-methyl-2-butenoate market is expected to grow at a 4.8% CAGR between 2025 and 2035.
The key product types in methyl 3-methyl-2-butenoate market are purity 99% and other.
In terms of application, organic synthesis segment to command 70.0% share in the methyl 3-methyl-2-butenoate market in 2025.


Our Research Products

The "Full Research Suite" delivers actionable market intel, deep dives on markets or technologies, so clients act faster, cut risk, and unlock growth.

The Leaderboard benchmarks and ranks top vendors, classifying them as Established Leaders, Leading Challengers, or Disruptors & Challengers.

Locates where complements amplify value and substitutes erode it, forecasting net impact by horizon

We deliver granular, decision-grade intel: market sizing, 5-year forecasts, pricing, adoption, usage, revenue, and operational KPIs—plus competitor tracking, regulation, and value chains—across 60 countries broadly.

Spot the shifts before they hit your P&L. We track inflection points, adoption curves, pricing moves, and ecosystem plays to show where demand is heading, why it is changing, and what to do next across high-growth markets and disruptive tech

Real-time reads of user behavior. We track shifting priorities, perceptions of today’s and next-gen services, and provider experience, then pace how fast tech moves from trial to adoption, blending buyer, consumer, and channel inputs with social signals (#WhySwitch, #UX).

Partner with our analyst team to build a custom report designed around your business priorities. From analysing market trends to assessing competitors or crafting bespoke datasets, we tailor insights to your needs.
Supplier Intelligence
Discovery & Profiling
Capacity & Footprint
Performance & Risk
Compliance & Governance
Commercial Readiness
Who Supplies Whom
Scorecards & Shortlists
Playbooks & Docs
Category Intelligence
Definition & Scope
Demand & Use Cases
Cost Drivers
Market Structure
Supply Chain Map
Trade & Policy
Operating Norms
Deliverables
Buyer Intelligence
Account Basics
Spend & Scope
Procurement Model
Vendor Requirements
Terms & Policies
Entry Strategy
Pain Points & Triggers
Outputs
Pricing Analysis
Benchmarks
Trends
Should-Cost
Indexation
Landed Cost
Commercial Terms
Deliverables
Brand Analysis
Positioning & Value Prop
Share & Presence
Customer Evidence
Go-to-Market
Digital & Reputation
Compliance & Trust
KPIs & Gaps
Outputs
Full Research Suite comprises of:
Market outlook & trends analysis
Interviews & case studies
Strategic recommendations
Vendor profiles & capabilities analysis
5-year forecasts
8 regions and 60+ country-level data splits
Market segment data splits
12 months of continuous data updates
DELIVERED AS:
PDF EXCEL ONLINE
Methylcobalamin Market Size and Share Forecast Outlook 2025 to 2035
Methylparaben Market Forecast and Outlook 2025 to 2035
Methyl Cyclohexane Market Size and Share Forecast Outlook 2025 to 2035
Methyl 3-Oxovalerate Market Size and Share Forecast Outlook 2025 to 2035
Methyl 2-Fluoro-3-Oxopentanoate Market Size and Share Forecast Outlook 2025 to 2035
Methyl 2-Naphthyl Ether Market Size and Share Forecast Outlook 2025 to 2035
Methyl Ionone Market Size and Share Forecast Outlook 2025 to 2035
Methyl Ethyl Ketone Market Size and Share Forecast Outlook 2025 to 2035
Methyl Isobutyl Carbinol Market Size and Share Forecast Outlook 2025 to 2035
Methyl Ethyl Ketone Peroxide (MEKP) Market Size and Share Forecast Outlook 2025 to 2035
Methyl Oleate Market – Trends & Forecast 2025 to 2035
Methylamine Market Growth – Trends & Forecast 2024-2034
Methyl p-hydroxybenzoate Market
Methyl Cellulose Market
Methyl Isopropyl Ketone Market
Methylamines Market
Methylene Diphenyl Di-isocyanate Market
3-Methyl-3-penten-2-one (3M3P) Market Forecast and Outlook 2025 to 2035
Dimethyl Terephthalate Market Size and Share Forecast Outlook 2025 to 2035
Dimethylolpropionic Acid (DMPA) Market Size and Share Forecast Outlook 2025 to 2035

Thank you!
You will receive an email from our Business Development Manager. Please be sure to check your SPAM/JUNK folder too.
Chat With
MaRIA