The global micro fiber spectrometer market is set to grow from USD 1,916.6 million in 2025 to USD 2,626.2 million by 2035, adding USD 709.6 million in new revenue and advancing at a 3.2% CAGR. Growth unfolds steadily as industries prioritize compact, precise, and portable spectroscopy tools for quality assurance, research workflows, and process optimization. Micro fiber spectrometers are becoming essential across pharmaceuticals, materials science, environmental testing, and semiconductor inspection, where real-time spectral accuracy and compact instrumentation are key. The 185–650 nm wavelength range, holding 60.0% share in 2025, dominates due to its broad UV-visible coverage and compatibility with standard analytical protocols. Absorbance measurement, representing 43.0%, remains the core application because of its central role in quantitative analysis for pharmaceutical assays, chemical evaluations, and laboratory research.
Demand is supported by steady digitization of laboratory environments, tighter quality requirements, and integration of spectrometers with automated platforms and AI-based analytical tools. Asia Pacific leads global expansion, with China growing at 4.3% CAGR and India at 4.0%, driven by investments in pharmaceutical manufacturing, R&D infrastructure, and academic research. Germany, the United States, and Japan maintain consistent demand tied to advanced research ecosystems and precision manufacturing excellence.
The telecommunications and photonics industries also contribute significantly to the growth of the micro fiber spectrometer market. With the expansion of optical fiber networks, high-speed internet infrastructure, and advanced communication technologies, there is a growing need for efficient monitoring of optical signals. Micro fiber spectrometers enable real-time analysis of wavelength variations, signal quality, and optical power, ensuring the reliability and performance of fiber optic networks. As global adoption of fiber-based communication increases, the demand for micro spectrometers capable of precise in-field measurements will continue to rise.
Technological advancements in micro-optics, nanophotonics, and integrated photonic circuits are enabling the development of smaller, more efficient, and more affordable micro fiber spectrometers. Innovations such as on-chip spectrometers, improved sensor coatings, enhanced wavelength calibration algorithms, and strengthened optical fiber materials are improving device accuracy, lifetime, and responsiveness. These advancements are reducing manufacturing costs and expanding the applicability of micro fiber spectrometers across new industries and consumer-facing technologies.
Industrial automation and smart manufacturing represent another strong growth area. Micro fiber spectrometers are increasingly used in process monitoring, materials inspection, and quality control systems. Their ability to detect compositional changes, material defects, or contamination at high speeds aligns with Industry 4.0 objectives of real-time data acquisition and intelligent process optimization. Industries such as semiconductors, chemicals, and advanced materials rely on spectroscopic monitoring to ensure product consistency and operational efficiency, further supporting market expansion.
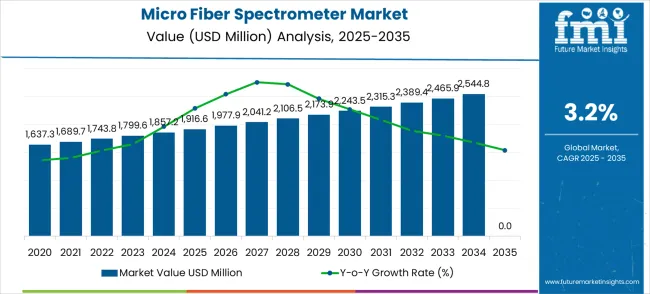
| Metric | Value |
|---|---|
| Estimated Value in (2025E) | USD 1,916.6 million |
| Forecast Value in (2035F) | USD 2,626.2 million |
| Forecast CAGR (2025 to 2035) | 3.2% |
Market expansion is being supported by the increasing global demand for analytical instrumentation and the corresponding shift toward compact spectrometry solutions that can provide superior measurement precision while meeting industry requirements for portable and reliable spectral analysis systems. Modern research laboratories and pharmaceutical companies are increasingly focused on incorporating microfiber spectrometers to enhance analytical capabilities while satisfying demands for space-efficient instrumentation and real-time measurement capabilities. Micro fiber spectrometers' proven ability to deliver superior spectral accuracy, operational flexibility, and compact design makes them essential equipment for modern analytical laboratories and industrial quality control applications.
The growing focus on pharmaceutical quality control and materials characterization is driving demand for high-quality micro fiber spectrometer products that can support distinctive analytical capabilities and premium instrumentation positioning across research laboratories, pharmaceutical manufacturing, and industrial testing categories. Equipment manufacturer preference for instruments that combine analytical excellence with compact design capabilities is creating opportunities for innovative micro fiber spectrometer implementations in both traditional and emerging analytical applications. The rising influence of miniaturization trends and portable instrumentation is also contributing to increased adoption of premium micro fiber spectrometer products that can provide authentic high-performance analytical characteristics.
The micro fiber spectrometer market represents a mature analytical instrumentation opportunity with steady but modest growth, projected to expand from USD 1,916.6 million in 2025 to USD 2,626.2 million by 2035 at a conservative 3.2% CAGR, a 37% expansion reflecting the established nature of this specialized scientific equipment segment. This technology serves critical roles in research laboratories, pharmaceutical manufacturing, and materials science applications where precise spectral analysis and compact form factors are essential for analytical workflows.
The market benefits from continuous demand in established research sectors and pharmaceutical quality control applications, though growth rates reflect the mature nature of the underlying technology. The 185-650nm wavelength range dominates with 60% market share due to its comprehensive UV-visible coverage essential for most analytical applications. At the same time, absorbance measurement leads applications given its fundamental importance in quantitative analysis. Geographic growth is highest in China (4.3% CAGR), driven by expanding pharmaceutical manufacturing and R&D investments, though market expansion remains constrained by technology maturity and competitive pressures.
Pathway A - UV-Visible Wavelength Range Excellence. The dominant 185-650nm segment serves the broadest analytical applications requiring comprehensive spectral coverage. Companies developing enhanced UV-visible spectrometers with improved resolution, stability, and measurement precision will maintain leadership in this established market segment, representing 60% of total demand. Expected revenue pool: USD 1,400-1,700 million.
Pathway B - Absorbance Measurement Application Focus. The primary application segment drives demand across pharmaceutical, chemical, and research laboratories for quantitative analysis capabilities. Providers developing specialized absorbance measurement systems with enhanced accuracy, automated sampling, and regulatory compliance features will capture this fundamental analytical market. Opportunity: USD 800-1,100 million.
Pathway C - Pharmaceutical and Biotechnology Solutions. Growing pharmaceutical manufacturing and drug development activities require specialized spectrometers with validated methods and regulatory compliance. Developing FDA-approved systems with pharmaceutical-specific protocols and quality assurance features addresses this quality-sensitive, high-value market segment. Revenue uplift: USD 400-600 million.
Pathway D - Geographic Expansion in China and Asia. China's pharmaceutical industry expansion and R&D investments create opportunities for analytical instrument suppliers. Local partnerships, competitive pricing strategies, and compliance with Chinese regulatory requirements enable market penetration in this highest-growth region, driving global demand. Pool: USD 300-500 million.
Pathway E - Portable and Field Analysis Systems. Growing demand for on-site analysis and field testing requires compact, ruggedized spectrometers with simplified operation. Developing portable systems for environmental monitoring, process control, and field research expands beyond traditional laboratory applications into emerging use cases. Expected upside: USD 200-350 million.
Pathway F - AI-Enhanced Spectral Analysis and Automation. Next-generation systems incorporating machine learning algorithms for automated spectral interpretation, compound identification, and method optimization create competitive advantages. Advanced software capabilities with predictive analytics and intelligent measurement protocols command premium pricing. USD 250-400 million.
Pathway G - Specialized Wavelength Configurations. Applications requiring specific spectral ranges, like near-infrared or extended UV, create niche opportunities. Developing specialized systems for food analysis, materials characterization, and industrial process monitoring addresses specific analytical needs beyond standard configurations. Pool: USD 150-300 million.
Pathway H - Service and Support Optimization. Scientific instruments require comprehensive calibration services, method development support, and technical expertise. Developing integrated service offerings with preventive maintenance, training programs, and application consulting creates recurring revenue streams and customer relationships beyond equipment sales. Expected revenue: USD 200-350 million.
The market is segmented by wavelength range, application, and region. By wavelength range, the market is divided into wavelength range 185-650nm, wavelength range 350-810nm, wavelength range 645-1085nm, and other ranges. Based on application, the market is categorized into absorbance measurement, laser/LED characterization, color and reflectance measurement, and other applications. Regionally, the market is divided into North America, Europe, East Asia, South Asia & Pacific, Latin America, and the Middle East & Africa.
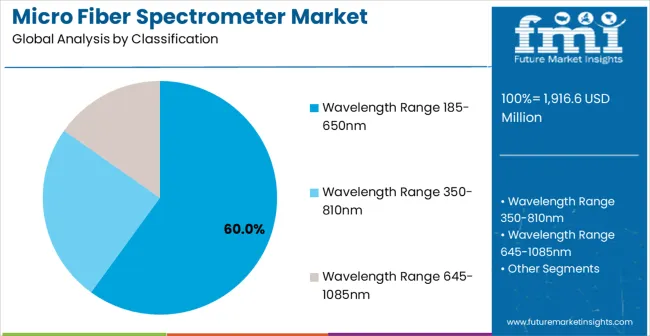
The wavelength range 185-650nm segment is projected to account for 60.0% of the micro fiber spectrometer market in 2025, reaffirming its position as the leading wavelength range category. Research laboratories and analytical facilities increasingly utilize 185-650nm micro fiber spectrometers for their superior UV-visible coverage, consistent spectral performance, and ease of integration in standard analytical protocols across diverse research applications. This wavelength range technology's standardized optical configuration and broad spectral coverage directly address the research requirements for comprehensive molecular analysis and efficient sample characterization in analytical laboratory operations.
This wavelength segment forms the foundation of modern analytical spectroscopy applications, as it represents the technology with the greatest analytical versatility and established compatibility across multiple research methodologies. Manufacturer investments in UV-visible optimization and spectral resolution enhancement continue to strengthen adoption among analytical instrument users. With research facilities prioritizing analytical comprehensiveness and consistent spectral performance, 185-650nm micro fiber spectrometers align with both measurement objectives and research efficiency requirements, making them the central component of comprehensive analytical spectroscopy strategies.
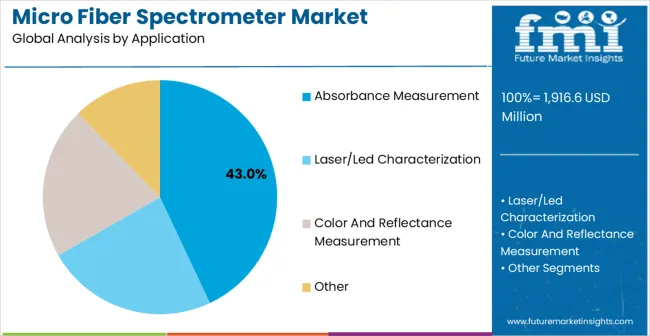
Absorbance measurement applications are projected to account 43.0% share of microfiber spectrometer demand in 2025, highlighting their critical role as the primary application for quantitative analysis in research and quality control operations. Laboratory managers prefer micro fiber spectrometers for their exceptional measurement precision, spectral stability, and ability to maintain consistent performance while supporting accurate concentration determination requirements during analytical procedures. Positioned as essential instruments for high-performance analytical operations, microfiber spectrometers offer both measurement reliability and operational efficiency advantages.
The segment is supported by continuous growth in pharmaceutical research activities and the growing availability of specialized spectrometer configurations that enable enhanced measurement precision and analytical workflow optimization at the laboratory level. The research institutions are investing in advanced analytical technologies to support premium research capabilities and measurement consistency. As analytical research continues to advance and laboratories seek superior measurement automation solutions, absorbance measurement applications will continue to dominate the application landscape while supporting technology advancement and research efficiency strategies.
The microfiber spectrometer market is advancing steadily due to increasing research and development investments and growing demand for analytical instrumentation solutions that emphasize superior measurement precision across pharmaceutical research and materials science applications. The market faces challenges, including high instrument costs compared to traditional analytical alternatives, technical complexity in optical system calibration, and competition from alternative spectroscopy technologies. Innovation in miniaturization technology and application-specific instrument development continues to influence market development and expansion patterns.
The growing adoption of micro fiber spectrometers in field analysis and portable instrumentation applications is enabling equipment manufacturers to develop systems that provide distinctive analytical capabilities while commanding premium positioning and enhanced portability characteristics. Advanced applications provide superior measurement precision while allowing more sophisticated analytical development across various research categories and application segments. Manufacturers are increasingly recognizing the competitive advantages of portable analytical positioning for premium instrument development and field analysis market penetration.
Modern micro fiber spectrometer suppliers are incorporating artificial intelligence algorithms, machine learning optimization, and automated spectral interpretation technologies to enhance analytical accuracy, improve measurement efficiency, and meet research demands for intelligent and intuitive analytical solutions. These programs improve instrument performance while enabling new applications, including automated compound identification and predictive analytical modeling systems. Advanced AI integration also allows suppliers to support premium market positioning and technology leadership beyond traditional commodity analytical instruments.
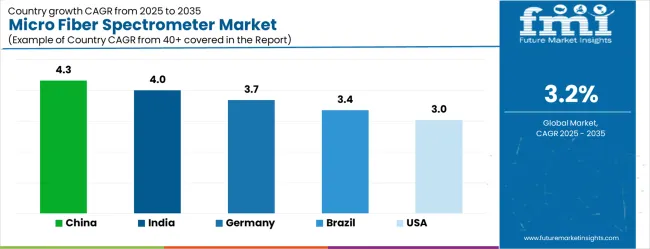
| Country | CAGR (2025 to 2035) |
|---|---|
| China | 4.3% |
| India | 4.0% |
| Germany | 3.7% |
| Brazil | 3.4% |
| USA | 3.0% |
| UK | 2.7% |
| Japan | 2.4% |
The market is experiencing robust growth globally, with China leading at a 4.3% CAGR through 2035, driven by the rapidly expanding research and development sector, massive investments in pharmaceutical manufacturing, and increasing adoption of advanced analytical technologies. India follows at 4.0%, supported by a growing pharmaceutical industry, rising research investments, and expanding biotechnology capabilities.
Germany shows growth at 3.7%, focusing advanced engineering technology and premium analytical instrument manufacturing. Brazil records 3.4%, focusing on emerging research applications and pharmaceutical development. The USA demonstrates 3.0% growth, prioritizing advanced research innovation and analytical technology leadership. The UK exhibits 2.7% growth, supported by specialized research development and advanced analytical capabilities. Japan shows 2.4% growth, focusing precision manufacturing excellence and high-quality analytical instrument production.
The report covers an in-depth analysis of 40+ countries; top-performing countries are highlighted below.
China is projected to exhibit exceptional growth with a CAGR of 4.3% through 2035, driven by the rapidly expanding research and development sector and massive government investments in pharmaceutical manufacturing capabilities across major technology hubs. The country's growing analytical instrumentation market and increasing adoption of advanced spectroscopy technologies are creating substantial demand for precision analytical equipment in both established and emerging research applications. Major analytical instrument manufacturers and research equipment companies are establishing comprehensive research and production capabilities to serve both domestic consumption and export markets.
India is expanding at a CAGR of 4.0%, supported by the growing pharmaceutical industry, increasing research investments, and expanding biotechnology applications. The country's developing research ecosystem and expanding analytical capabilities are driving demand for reliable analytical instruments across both pharmaceutical research and academic applications. International instrument companies and domestic analytical equipment manufacturers are establishing comprehensive distribution and service capabilities to address growing market demand for cost-effective analytical solutions.
Germany is projected to grow at a CAGR of 3.7% through 2035, driven by the country's advanced analytical technology sector, premium research instrument manufacturing capabilities, and leadership in precision analytical solutions. Germany's sophisticated research culture and willingness to invest in high-performance analytical instruments are creating substantial demand for both standard and specialized micro fiber spectrometer varieties. Leading technology companies and analytical instrument manufacturers are establishing comprehensive innovation strategies to serve both European markets and growing international demand.
Brazil is projected to grow at a CAGR of 3.4% through 2035, supported by the country's expanding pharmaceutical sector, growing research applications, and increasing adoption of analytical technologies requiring precision spectrometry solutions. Brazilian researchers and international companies consistently seek reliable analytical instruments that enhance research capabilities for both domestic applications and regional markets. The country's position as a regional research hub continues to drive innovation in analytical technology applications and research standards.
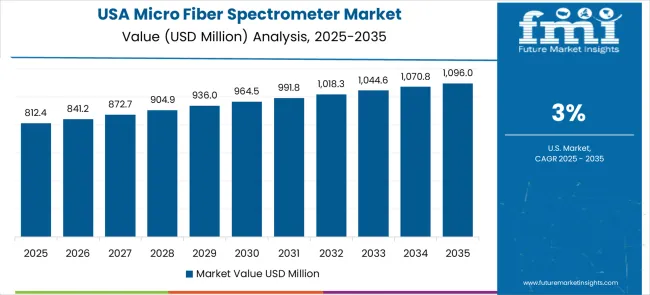
The United States is projected to grow at a CAGR of 3.0% through 2035, supported by the country's advanced research sector, analytical technology innovation capabilities, and established leadership in precision instrumentation solutions. American research institutions and pharmaceutical companies prioritize accuracy, reliability, and technical excellence, making microfiber spectrometers essential instruments for both academic research and industrial analysis. The country's comprehensive research capabilities and technical expertise support continued market development.
The United Kingdom is projected to grow at a CAGR of 2.7% through 2035, supported by the country's specialized research development sector, advanced analytical capabilities, and established expertise in precision instrumentation solutions. British researchers' focus on innovation, precision, and technical excellence creates a steady demand for reliable microfiber spectrometer instruments. The country's attention to analytical accuracy and research optimization drives consistent adoption across both traditional research and emerging analytical applications.
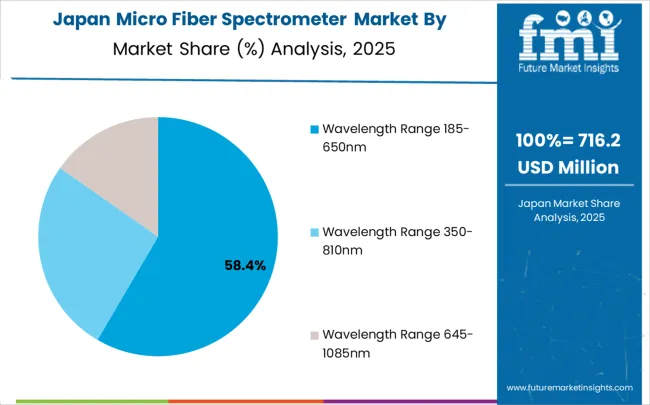
Japan is projected to grow at a CAGR of 2.4% through 2035, supported by the country's precision instrumentation excellence, advanced analytical technology expertise, and established reputation for producing superior analytical instruments while working to enhance optical sensing capabilities and develop next-generation spectrometer technologies. Japan's analytical instrument industry continues to benefit from its reputation for delivering high-quality research equipment while focusing on innovation and manufacturing precision.
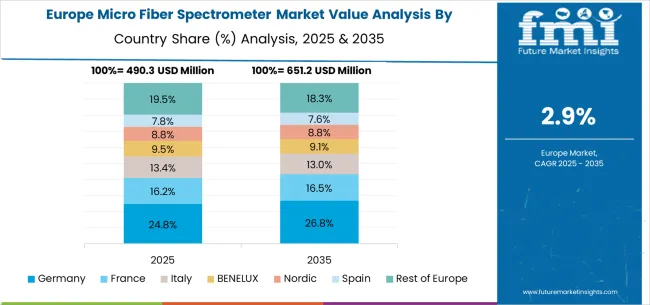
The microfiber spectrometer market in Europe is projected to grow from USD 487.2 million in 2025 to USD 648.1 million by 2035, registering a CAGR of 2.9% over the forecast period. Germany is expected to maintain its leadership position with a 32.1% market share in 2025, remaining stable at 31.9% by 2035, supported by its advanced analytical technology sector, precision research instrument manufacturing industry, and comprehensive innovation capabilities serving European and international markets.
The United Kingdom follows with a 19.8% share in 2025, projected to reach 20.1% by 2035, driven by specialized research development programs, advanced analytical capabilities, and a growing focus on precision instrumentation solutions for premium applications.
France holds a 17.3% share in 2025, expected to maintain 17.1% by 2035, supported by pharmaceutical research demand and advanced analytical applications, but facing challenges from market competition and economic considerations. Italy commands a 13.6% share in 2025, projected to reach 13.8% by 2035, while Spain accounts for 9.4% in 2025, expected to reach 9.6% by 2035.
The Netherlands maintains a 4.2% share in 2025, growing to 4.3% by 2035. The Rest of Europe region, including Nordic countries, Eastern Europe, Belgium, Switzerland, and Austria, is anticipated to hold 15.8% in 2025, declining slightly to 15.4% by 2035, attributed to mixed growth patterns with moderate expansion in some advanced research markets balanced by slower growth in smaller countries implementing analytical instrumentation development programs.
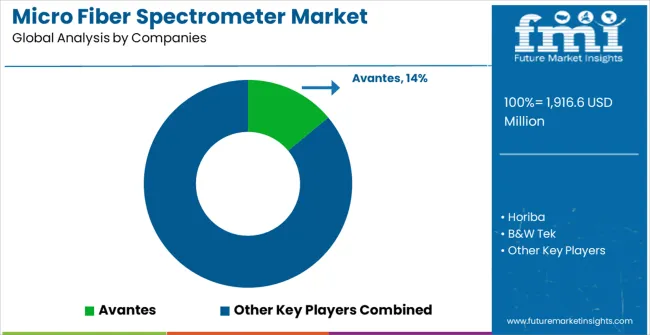
The micro fiber spectrometer market consists of 14–18 manufacturers, with the top five companies holding 56–61% of global market share. Growth is driven by rising demand for compact, portable, high-resolution spectrometers used in biophotonics, semiconductor inspection, environmental monitoring, in-line industrial quality control, and scientific research. Competition centers on spectral resolution, sensitivity, signal-to-noise ratio, wavelength range, fiber-coupling efficiency, and software analytics, rather than price. Avantes leads the market with an 14% share, supported by its advanced fiber-coupled spectrometer platforms widely used in research labs and industrial process monitoring.
Other leading players such as Horiba, B&W Tek, Hamamatsu, and Fibre Photonics maintain strong positions through their high-performance optical engines, deep photonics expertise, and integration with Raman, LIBS, and fluorescence systems. Their strong global distribution networks and reliability in precision measurement reinforce their leadership across scientific and industrial applications.
Challengers including StellarNet, Drawell, Ocean Optics, and JINSP offer compact, cost-effective spectrometers ideal for field applications, OEM integration, and portable diagnostics, appealing to academic and industrial users seeking high value at lower cost.
Regional innovators such as Shanghai Ideaoptics, Gu Optics, Dimension-Labs, Lisen Optics, GIE Optics, Shanghai Ruhai Optoelectronics Technology, and WY Optics intensify competition, especially in Asia, by providing affordable, customizable fiber-optic spectrometers with rapid product iteration and strong local engineering support. Their growth aligns with expanding photonics manufacturing ecosystems in China and Southeast Asia, broadening the global reach of the micro fiber spectrometer market.
| Items | Values |
|---|---|
| Quantitative Units (2025) | USD 1,916.6 million |
| Wavelength Range | Wavelength Range 185-650nm, Wavelength Range 350-810nm, Wavelength Range 645-1085nm, Other |
| Application | Absorbance Measurement, Laser/LED Characterization, Color and Reflectance Measurement, Other |
| Regions Covered | North America, Europe, East Asia, South Asia & Pacific, Latin America, Middle East & Africa |
| Countries Covered | United States, Canada, United Kingdom, Germany, France, China, Japan, South Korea, India, Brazil, Australia and 40+ countries |
| Key Companies Profiled | Avantes, Horiba, B&W Tek, Hamamatsu, Fibre Photonics, StellarNet, Drawell, Ocean Optics, JINSP, Shanghai Ideaoptics, Gu Optics, Dimension-Labs, Lisen Optics, GIE Optics, Shanghai Ruhai Optoelectronics Technology, and WY Optics |
| Additional Attributes | Dollar sales by wavelength range and application, regional demand trends, competitive landscape, technological advancements in optical sensing, precision measurement development initiatives, miniaturization optimization programs, and research integration enhancement strategies |
The global CNC abovefloor wheel lathe market is estimated to be valued at USD 377.6 million in 2025.
The market size for the CNC abovefloor wheel lathe market is projected to reach USD 543.0 million by 2035.
The CNC abovefloor wheel lathe market is expected to grow at a 3.7% CAGR between 2025 and 2035.
The key product types in CNC abovefloor wheel lathe market are mobile type and fixed type.
In terms of application, passenger rail segment to command 58.0% share in the CNC abovefloor wheel lathe market in 2025.


Our Research Products

The "Full Research Suite" delivers actionable market intel, deep dives on markets or technologies, so clients act faster, cut risk, and unlock growth.

The Leaderboard benchmarks and ranks top vendors, classifying them as Established Leaders, Leading Challengers, or Disruptors & Challengers.

Locates where complements amplify value and substitutes erode it, forecasting net impact by horizon

We deliver granular, decision-grade intel: market sizing, 5-year forecasts, pricing, adoption, usage, revenue, and operational KPIs—plus competitor tracking, regulation, and value chains—across 60 countries broadly.

Spot the shifts before they hit your P&L. We track inflection points, adoption curves, pricing moves, and ecosystem plays to show where demand is heading, why it is changing, and what to do next across high-growth markets and disruptive tech

Real-time reads of user behavior. We track shifting priorities, perceptions of today’s and next-gen services, and provider experience, then pace how fast tech moves from trial to adoption, blending buyer, consumer, and channel inputs with social signals (#WhySwitch, #UX).

Partner with our analyst team to build a custom report designed around your business priorities. From analysing market trends to assessing competitors or crafting bespoke datasets, we tailor insights to your needs.
Supplier Intelligence
Discovery & Profiling
Capacity & Footprint
Performance & Risk
Compliance & Governance
Commercial Readiness
Who Supplies Whom
Scorecards & Shortlists
Playbooks & Docs
Category Intelligence
Definition & Scope
Demand & Use Cases
Cost Drivers
Market Structure
Supply Chain Map
Trade & Policy
Operating Norms
Deliverables
Buyer Intelligence
Account Basics
Spend & Scope
Procurement Model
Vendor Requirements
Terms & Policies
Entry Strategy
Pain Points & Triggers
Outputs
Pricing Analysis
Benchmarks
Trends
Should-Cost
Indexation
Landed Cost
Commercial Terms
Deliverables
Brand Analysis
Positioning & Value Prop
Share & Presence
Customer Evidence
Go-to-Market
Digital & Reputation
Compliance & Trust
KPIs & Gaps
Outputs
Full Research Suite comprises of:
Market outlook & trends analysis
Interviews & case studies
Strategic recommendations
Vendor profiles & capabilities analysis
5-year forecasts
8 regions and 60+ country-level data splits
Market segment data splits
12 months of continuous data updates
DELIVERED AS:
PDF EXCEL ONLINE
Microfiber Cleaning Cloth Market Size and Share Forecast Outlook 2025 to 2035
The Microfiber Synthetic Leather Market is segmented by material, application, and end-use from 2025 to 2035
Microbiome Fiber Supplement Market Size and Share Forecast Outlook 2025 to 2035
Polyester Microfiber Fabric Market Size and Share Forecast Outlook 2025 to 2035
Modular Fiber Optical Spectrometers Market Size and Share Forecast Outlook 2025 to 2035
Micro-Vent Cap Systems Market Analysis - Size and Share Forecast Outlook 2025 to 2035
Microfilm Readers and Scanners Market Size and Share Forecast Outlook 2025 to 2035
Fiber Optic Probe Hydrophone (FOPH) Market Size and Share Forecast Outlook 2025 to 2035
Fiberglass Centrifugal Fan Market Size and Share Forecast Outlook 2025 to 2035
Micron CBN Powder Market Size and Share Forecast Outlook 2025 to 2035
Fiber to the Home Market Size and Share Forecast Outlook 2025 to 2035
Microfilm Reader Market Size and Share Forecast Outlook 2025 to 2035
Fiber Based Packaging Market Size and Share Forecast Outlook 2025 to 2035
Micro-Dosing Sachet Fillers Market Analysis - Size and Share Forecast Outlook 2025 to 2035
Microbial Growth Monitoring System Market Size and Share Forecast Outlook 2025 to 2035
Fiber Lid Market Forecast and Outlook 2025 to 2035
Micro Hotel Market Forecast and Outlook 2025 to 2035
Microwave Source Market Size and Share Forecast Outlook 2025 to 2035
Micro-energy Harvesting System Market Size and Share Forecast Outlook 2025 to 2035
Fiberglass Tanks Market Size and Share Forecast Outlook 2025 to 2035

Thank you!
You will receive an email from our Business Development Manager. Please be sure to check your SPAM/JUNK folder too.
Chat With
MaRIA