Microsatellite Instability (MSI) Diagnostics Market Size and Share Forecast Outlook 2025 to 2035

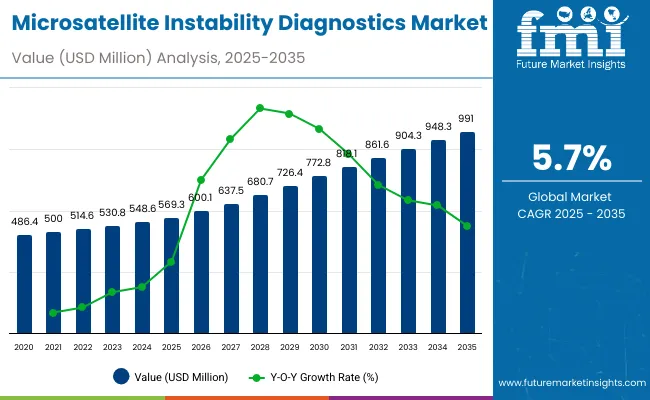
The global Microsatellite Instability (MSI) Diagnostics Market is projected to reach a valuation of USD 569.3 million by 2025 and USD 991.0 million by 2035. This indicates a decade-long increase of USD 421.8 million between 2025 and 2035. The market is expected to expand at a compound annual growth rate CAGR of 5.7%, representing a 1.74X increase over the ten-year period.
Quick Stats for Microsatellite Instability (MSI) Diagnostics Market

  • Industry Value (2025): USD 569.3 million
  • Forecast Value (2035): USD 991.0 million
  • Forecast CAGR: 5.7%
  • Leading Segment in 2025 (Product Type): PCR Fragment Analysis (53.3% market share)
  • Key Growth Region: Asia Pacific and Europe
  • Top Key Players: Promega, Thermo Fisher Scientific, Bio-Rad Laboratories, Genecast, NeoGenomics, Biocartis, AmoyDx

Microsatellite Instability Diagnostics Market

Metric Value
Industry Size (2025E) USD 569.3 million
Industry Value (2035F) USD 991.0 million
CAGR (2025 to 2035) 5.7%

During the first five-year period from 2025 to 2030, the total market value is projected to expand from USD 569.3 million to USD 772.8million, adding USD 203.5million which contributes to 48.2% of the total decade growth. PCR fragment analysis will remain dominant, holding around 53.5% share of the category by 2030 due to its proven reliability and integration in Lynch syndrome testing. The real-time PCR beacon segment is expected to sustain share at around 17.0%, while targeted NGS is positioned near 15%, reflecting growing but measured adoption in precision oncology.

The second half from 2030 to 2035 contributes USD 218.3million, which is equal to 51.8%% of the total growth, as the market jumps from USD 772.8million to USD 991.0million. This acceleration is powered by increased use of MSI diagnostics for immunotherapy stratification and tumor profiling across oncology centers and clinical labs. PCR fragment analysis and real-time PCR beacon together capture more than 70% of share by the end of the decade, while comprehensive NGS workflows rise gradually to 6.6%, reflecting their specialized role in advanced profiling rather than routine screening.

From 2020 to 2024, the overall Microsatellite Instability (MSI) Diagnostics Market grew from USD 486.4million to USD 548.6million. Leading manufacturers such as Promega, Thermo Fisher Scientific, and Bio-Rad Laboratories together account for nearly 52.5% of global revenue through established PCR-based assays, companion diagnostics, and reference lab partnerships. Key strategies deployed by these players include continuous validation of MSI panels for regulatory approval, integration of MSI testing into broader oncology workflows, and collaborations with pharmaceutical companies to link MSI results with immunotherapy treatment pathways.

In 2025, the MSI Diagnostics Market is expected to reach a value of approximately USD 569.3 million, driven by a shift from standalone PCR assays to integrated molecular profiling solutions that combine PCR, NGS, and immunohistochemistry (IHC). Growth will be propelled by expanding adoption of MSI testing in Lynch syndrome screening, immunotherapy stratification, and precision oncology programs. Hospitals and reference laboratories are increasingly investing in platforms that enable high-throughput PCR fragment analysis, automated bioinformatics pipelines, and companion diagnostic approvals to improve testing accuracy, streamline workflows, and guide therapy decisions in colorectal, gastric, and endometrial cancers.

Why Is This Market Growing?

Microsatellite Instability (MSI) Diagnostics are seeing strong growth because oncology practices and healthcare systems worldwide face mounting pressure to improve cancer detection, personalize therapy, and comply with precision medicine guidelines. Major drivers include the rising use of immune checkpoint inhibitors, increasing demand for Lynch syndrome screening, and expanding regulatory recommendations that require MSI testing for colorectal, gastric, and endometrial cancers. Advances such as automated PCR fragment analysis systems, real-time PCR assays, and targeted NGS panels enable faster turnaround, reduce interpretation errors, and provide actionable data for oncologists.

The accelerated uptake of companion diagnostics linked to immunotherapies has amplified demand, positioning MSI testing as a critical decision-making tool. As hospital oncology units and reference labs prioritize comprehensive genomic profiling and therapy guidance, manufacturers offering validated, cost-efficient, and scalable MSI platforms are achieving strong adoption. In emerging healthcare markets across Asia Pacific and Europe, national cancer screening programs and infrastructure upgrades are further boosting demand.

Segmental Analysis

The market is segmented by product type, application, end-user, and region. Product segmentation includes PCR fragment analysis, Real-time PCR beacon, Targeted NGS, NGS comprehensive, and Others, highlighting the core diagnostic technologies shaping adoption trends. Application classification covers Diagnostic / Lynch screening, Companion diagnostic flow, MSI immunotherapy stratification, Precision oncology profiling, Tumor profiling + therapy decisions, and Others, underscoring the role of MSI in cancer detection, treatment guidance, and personalized medicine.

Based on End User, the segmentation includes Hospitals & reference laboratories, Clinical labs, Oncology Centers, and Others, reflecting the diversity of testing environments where MSI diagnostics are performed. Regionally, the scope spans North America, Latin America, Western and Eastern Europe, East Asia, South Asia & Pacific, and the Middle East & Africa, where adoption dynamics vary according to cancer prevalence, reimbursement policies, and molecular diagnostics infrastructure.
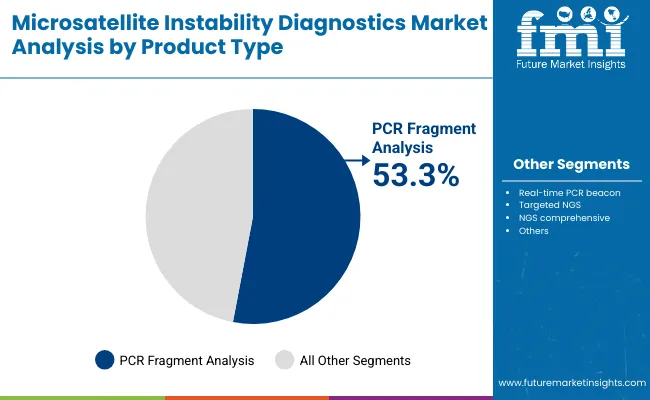
Insights into the Product Segment with PCR Fragment Analysis Leading in Market Share

Microsatellite Instability Diagnostics Market By Product

By Product Type Market Share (%)
PCR fragment analysis 53.3%
Real-time PCR beacon 17.3%
Targeted NGS 15.3%
NGS comprehensive 7.3%
Others 6.7%

PCR fragment analysis is expected to retain a dominant position and contribute 53.3% in 2025, owing to its established role as the reference method for detecting microsatellite instability. Its adoption has been driven by the rising global emphasis on Lynch syndrome screening and the incorporation of MSI testing into clinical oncology guidelines. Preference has increasingly shifted toward this method due to its accuracy, reproducibility, and cost-efficiency, making it highly suitable for routine diagnostic workflows in hospitals and reference labs.

Regulatory endorsements and its integration as a companion diagnostic tool for immunotherapy approvals have further reinforced its clinical relevance. These factors collectively contribute to the sustained demand for PCR fragment analysis over newer but less standardized technologies, positioning it as the backbone of MSI testing in both developed and emerging oncology markets.
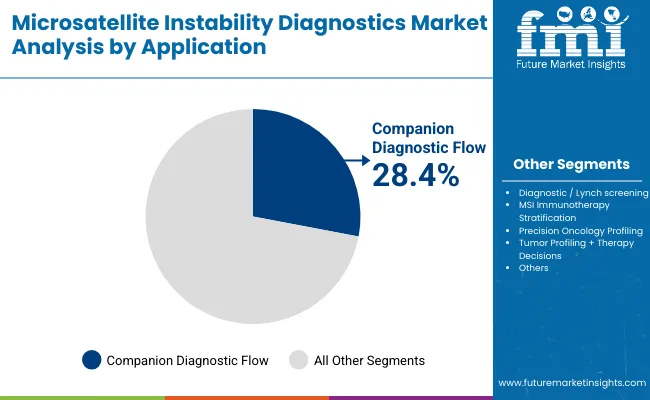
Insights into the Application Segment with Companion Diagnostic Flow Dominating the Demand

Microsatellite Instability Diagnostics Market By Application

By Application Market Share (%)
Diagnostic / Lynch screening 19.89%
Companion diagnostic flow 28.43%
MSI immunotherapy stratification 24.88%
Precision oncology profiling 12.55%
Tumor profiling + therapy decisions 8.88%
Others 5.4%

Companion diagnostic flow has emerged as the leading application area and is projected to hold around 28.4% in 2025 due to its critical role in guiding the use of immunotherapies and targeted oncology drugs. Regulatory agencies such as the FDA and EMA have mandated MSI testing as part of the approval and clinical use of immune checkpoint inhibitors like pembrolizumab, driving higher adoption in oncology centers and reference labs.

As a result, MSI assays integrated into companion diagnostic workflows particularly PCR and NGS-based panels have become essential for therapy stratification in colorectal, gastric, and endometrial cancers. Additionally, the increasing pipeline of immuno-oncology drugs with biomarker-linked indications is expected to reinforce reliance on MSI companion diagnostics, making this segment the backbone of precision cancer treatment decisions globally.
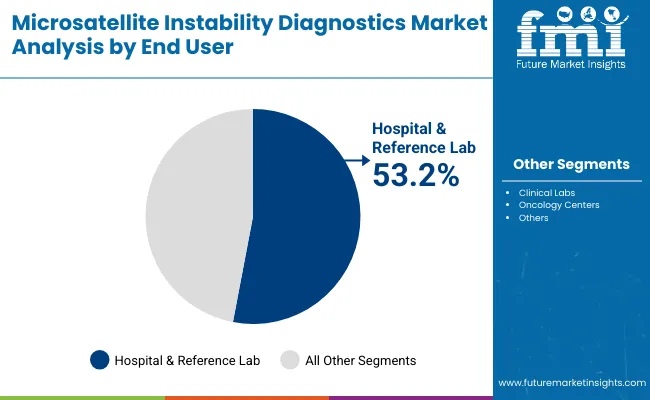
Insights into the End User Segment with Highest Adoption Among Hospitals & Reference Laboratories

Microsatellite Instability Diagnostics Market By End User

End User Market Share (%)
Hospital & reference lab 53.2%
Clinical labs 22.4%
Oncology Centers 13.3%
Others 11.0%

Hospitals and reference laboratories are expected to remain the largest end-user segment, contributing around 53.2% in 2025 due to their critical role in handling high-volume cancer diagnostics and complex molecular testing. Most MSI testing for Lynch syndrome screening, immunotherapy eligibility, and tumor profiling is performed in hospital-affiliated labs and large reference centers, where scalability, reliability, and regulatory compliance are paramount.

Demand has been reinforced by guidelines from organizations such as NCCN and ESMO, which recommend MSI testing as part of standard cancer care. Investments in molecular pathology infrastructure and next-generation sequencing capabilities within hospitals are accelerating uptake, particularly in tertiary care and academic institutions. Procurement is also being influenced by favorable reimbursement policies and oncology-driven initiatives aimed at expanding access to biomarker-based diagnostics, ensuring hospitals and reference labs maintain the dominant installed base.

What are the Drivers, Restraints, and Key Trends of the Sterile Prep‑Pack Workstations?

Regulatory Push for Biomarker-Driven Oncology Care

The most significant growth driver in the Microsatellite Instability (MSI) Diagnostics market is the tightening of oncology testing guidelines and regulatory frameworks that mandate biomarker testing to guide therapy. Organizations such as the USA FDA, EMA, NCCN, and ESMO have made MSI testing a standard component in colorectal, gastric, and endometrial cancer care pathways, particularly for determining eligibility for immunotherapies such as PD-1/PD-L1 checkpoint inhibitors.

Hospitals and reference laboratories are compelled to expand their MSI testing capabilities, incorporating PCR fragment analysis kits, targeted NGS panels, and companion diagnostics into their diagnostic workflows. Accreditation bodies and reimbursement agencies are also exerting pressure, with payers increasingly covering MSI testing as part of precision oncology programs. As cancer incidence rises globally and immune checkpoint inhibitors gain broader approvals, the demand for validated, guideline-aligned MSI diagnostics continues to accelerate.

High Test Cost, Technical Complexity, and Infrastructure Dependencies

Despite its clinical value, the high cost of advanced MSI diagnostics and the associated infrastructure needs remain significant restraints. While PCR fragment analysis is relatively affordable, the adoption of targeted and comprehensive NGS panels requires substantial capital investment in sequencers, bioinformatics infrastructure, and skilled personnel. Smaller clinical labs and oncology centers in developing regions often face barriers due to lack of molecular pathology expertise, limited reimbursement coverage, and longer turnaround times.

Standardization challenges also persist, as test results can vary between methodologies (PCR, NGS, or IHC), creating hesitancy in routine adoption. Retrofitting existing pathology labs with NGS capabilities and ensuring compliance with CAP/CLIA standards further add to implementation hurdles, particularly in mid-tier or resource-constrained healthcare systems.

Convergence of MSI Diagnostics with Comprehensive Genomic Profiling Platforms

A rapidly accelerating trend in the market is the integration of MSI diagnostics into broader genomic profiling and precision oncology platforms. Rather than ordering MSI as a standalone test, leading hospitals and oncology networks are bundling it into multi-gene NGS panels, pan-cancer profiling workflows, and therapy-decision support systems. Vendors such as Thermo Fisher Scientific, Illumina, and NeoGenomics are aligning their MSI assay offerings with comprehensive oncology solutions that include tumor mutational burden (TMB), PD-L1 status, and other biomarkers.

This convergence is reshaping procurement decisions labs now seek platforms that offer interoperability, scalability, and integration with electronic health records (EHRs) for streamlined reporting. In parallel, pharmaceutical collaborations are accelerating co-development of MSI companion diagnostics to support immuno-oncology drug pipelines. As hospitals invest in holistic precision medicine infrastructures, MSI testing is increasingly viewed not as a single assay, but as a strategic component of integrated oncology care ecosystems.
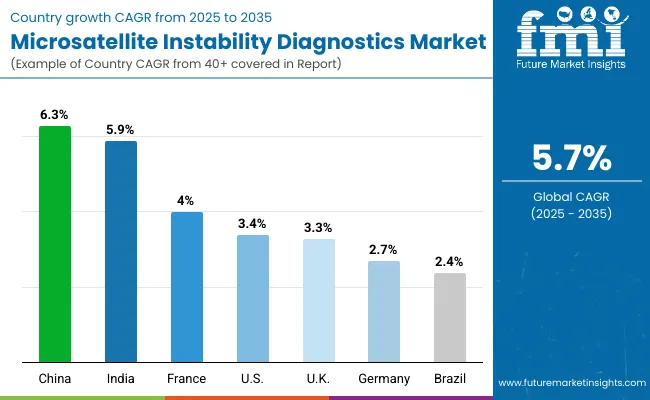
Analysis of Microsatellite Instability (MSI) Diagnostics market By Key Countries

Microsatellite Instability Diagnostics Market By Country

Asia Pacific is emerging as the fastest-growing region in the MSI Diagnostics Market, projected to grow at a CAGR of 6.1% between 2025 and 2035, led by China with 6.3% CAGR and India with 5.9% CAGR. China’s growth is supported by large-scale adoption of precision oncology programs, public sector investment in NGS-based cancer screening, and integration of MSI testing into national reimbursement frameworks for colorectal and gastric cancers.

India is experiencing strong expansion, driven by the establishment of molecular oncology laboratories in Tier 1 and Tier 2 cities, NABL accreditation requirements, and the growth of hospital-based genetic testing services. Across Asia Pacific, government-funded cancer control programs and rising awareness of Lynch syndrome and hereditary cancers are accelerating test volumes, positioning the region as a strategic growth engine for global MSI diagnostics suppliers.

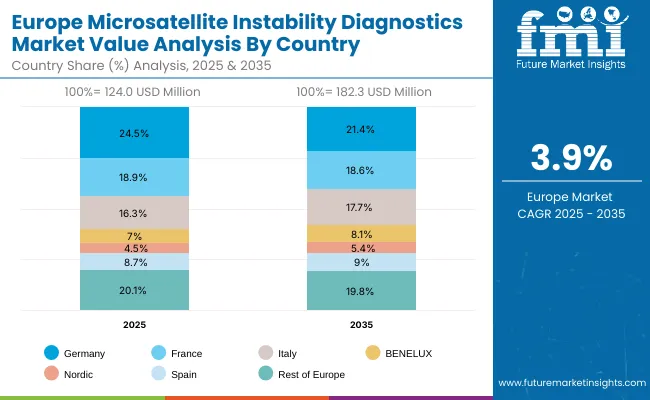
Europe is expected to grow steadily at a 3.9% CAGR through 2035, supported by harmonized oncology testing guidelines and precision medicine initiatives. Germany, projected at 2.7% CAGR, continues to benefit from automation and integration of MSI with broader NGS oncology panels in large academic hospitals. France, growing at 4.0% CAGR, is supported by public investments under the “France Genomic Medicine 2025” initiative, ensuring MSI testing is embedded in national cancer treatment pathways.

The UK, at 3.3% CAGR, is expanding MSI adoption through NHS precision medicine programs and growing partnerships with private diagnostic labs. Southern European countries such as Italy and Spain are also showing consistent gains, supported by EU-level cancer mission projects. Overall, Europe’s share of the market is reinforced by clinical standardization, reimbursement support, and ongoing efforts to expand companion diagnostics in oncology care.

North America remains a mature but innovation-led market, with the USA projected to grow at 3.4% CAGR between 2025 and 2035. Growth is being driven by the replacement of legacy PCR-only testing with integrated PCR-NGS workflows and widespread adoption of companion diagnostics linked to immunotherapy approvals. Hospitals and reference labs in the USA are rapidly incorporating MSI testing into comprehensive genomic profiling panels, supported by payer coverage expansions and FDA-approved platforms such as FoundationOneCDx.

Federal funding under cancer moonshot initiatives and ongoing investments by major academic centers are reinforcing infrastructure upgrades. Despite its maturity, the USA market continues to set the pace for regulatory validation, pharma-diagnostic partnerships, and new MSI assay launches, keeping North America at the forefront of innovation.
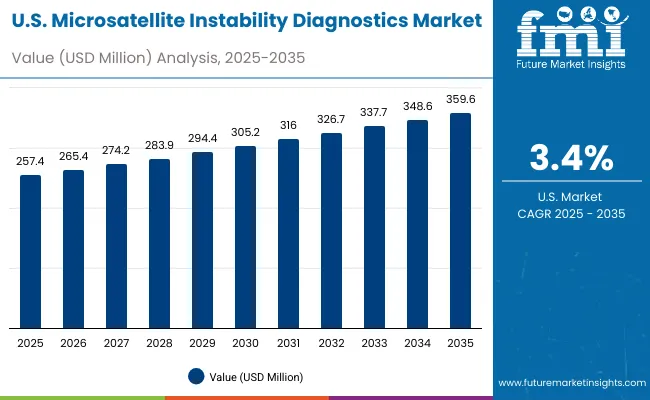
Sales Outlook for MSI Diagnostics in the United States

Microsatellite Instability Diagnostics Market Usa

The MSI Diagnostics Market in the USA is forecasted to grow at a 3.4% CAGR, primarily driven by the increasing integration of companion diagnostics into oncology treatment pathways and payer coverage expansions. Hospitals and reference laboratories are upgrading from legacy PCR-only workflows to PCR-NGS hybrid assays validated for regulatory compliance, supporting immunotherapy eligibility decisions. Demand is being fueled by clinical guideline mandates and the growth of colorectal, endometrial, and gastric cancer testing volumes in major cancer centers.

  • Hospitals and reference labs are scaling high-throughput PCR fragment analysis systems for Lynch syndrome and MSI status screening.
  • Pharma-linked companion diagnostic programs are expanding, with MSI integrated into immunotherapy eligibility panels.
  • Oncology-focused clinical labs are adopting automated workflows with reduced turnaround times to meet payer reimbursement timelines.

Growth and Expansion Outlook for MSI Diagnostics in the United Kingdom

The MSI Diagnostics Market in the United Kingdom is projected to grow at a 3.3% CAGR through 2035, supported by NHS England’s precision oncology investments and the roll-out of genomics hubs. National programs under the Genomic Medicine Service (GMS) are embedding MSI testing into standard-of-care for colorectal and hereditary cancers. Adoption is also being driven by rising demand for tumor profiling in academic and private cancer centers.

  • NHS genomics hubs are standardizing MSI testing across regional centers for cost-efficient procurement.
  • Day oncology units are incorporating MSI into precision oncology workflows to guide same-day therapy planning.
  • Clinical commissioning groups (CCGs) are influencing lab contracts with quality and sustainability benchmarks for molecular testing platforms.

In-Depth Analysis of MSI Diagnostics in Germany

The MSI Diagnostics Market in Germany is forecast to grow at a 2.7% CAGR, shaped by stringent reimbursement frameworks and gradual adoption of NGS-based oncology profiling. Under federal health digitalization and oncology initiatives, hospitals are progressively upgrading pathology labs to incorporate validated MSI assays into comprehensive cancer panels. Germany’s strong network of university hospitals and private pathology chains is accelerating demand for PCR-based companion diagnostics while cautiously expanding NGS adoption.
  • University hospitals are deploying MSI testing as part of integrated tumor boards linking diagnostics to therapy decisions.
  • Independent pathology providers are customizing MSI workflows for multi-cancer profiling contracts.
  • Hospital engineering and IT teams are bundling MSI assays into digital pathology and EHR-linked infrastructures to comply with EU data integration standards.

Europe Microsatellite Instability (MSI) Diagnostics market Value Analysis By Country

Microsatellite Instability Diagnostics Market Europe

Market Expansion Outlook for MSI Diagnostics in India

The MSI Diagnostics Market in India is expected to grow at a CAGR of 5.9%, making it one of the fastest-growing markets globally. Growth is fueled by the rapid expansion of tertiary care hospitals, oncology-focused medical colleges, and private diagnostic chains across Tier 1 and Tier 2 cities.

Rising cancer incidence, combined with NABL accreditation standards and government-backed cancer control programs, has led to increased adoption of MSI testing as part of molecular diagnostics. Indian hospitals are integrating PCR fragment analysis assays and targeted NGS panels into oncology workflows, while private laboratories are offering MSI testing as part of broader genomic profiling packages.

  • Private multi-specialty hospitals are deploying MSI assays to meet precision oncology benchmarks.
  • Medical teaching hospitals are training oncologists and lab professionals in MSI diagnostics under NABL-accredited labs.
  • Chain diagnostic labs in Tier 2 cities are prioritizing cost-efficient PCR-based MSI kits to scale testing capacity.

Sales Outlook for MSI Diagnostics in China

The MSI Diagnostics Market in China is projected to grow at a CAGR of 6.3% through 2035, supported by aggressive oncology infrastructure investments under the Healthy China 2030 policy. China’s National Health Commission has issued guidelines promoting biomarker testing, accelerating MSI adoption in Class A tertiary hospitals. Urban cancer centers are incorporating MSI into comprehensive NGS oncology panels, while provincial hospitals are adopting PCR-based MSI assays for Lynch syndrome and colorectal cancer diagnostics. Domestic diagnostic companies are scaling up production of MSI kits, while global suppliers are forming joint ventures to expand access.
  • Tertiary hospitals in major cities are integrating MSI into high-throughput NGS platforms for immunotherapy decision support.
  • County-level hospitals are expanding MSI adoption through affordable PCR-based assays.
  • Joint venture hospitals are introducing FDA/EMA-approved MSI companion diagnostics into local oncology programs.

Growth Outlook of MSI Diagnostics in Japan

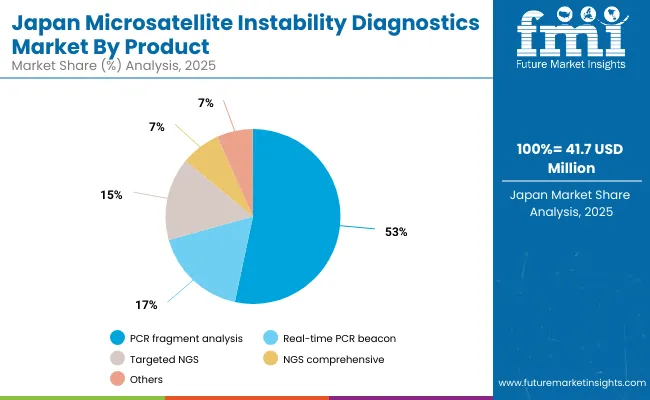
Microsatellite Instability Diagnostics Market Japan

The MSI Diagnostics Market in Japan is projected to grow at a CAGR of 4.2%, reaching USD 41.7 million by 2025. Adoption is being shaped by Japan’s dual focus on clinical precision and workforce efficiency under the Ministry of Health, Labour and Welfare guidelines. PCR Fragment analysis leads the market with 51.4% revenue share as MSI testing is increasingly integrated into colorectal and endometrial cancer care, supported by national cancer registries and insurance coverage for companion diagnostics. Japan’s push for automation in hospital laboratories is driving demand for validated MSI assays that are compatible with digital pathology systems.
  • Market in Japan accounts for ~8.2% of global revenue by 2025.
  • PCR fragment analysis continues to dominate due to reliability in Lynch screening, while NGS adoption grows gradually.
  • Growth is reinforced by mandates for cancer biomarker testing and efforts to offset workforce shortages through automation.

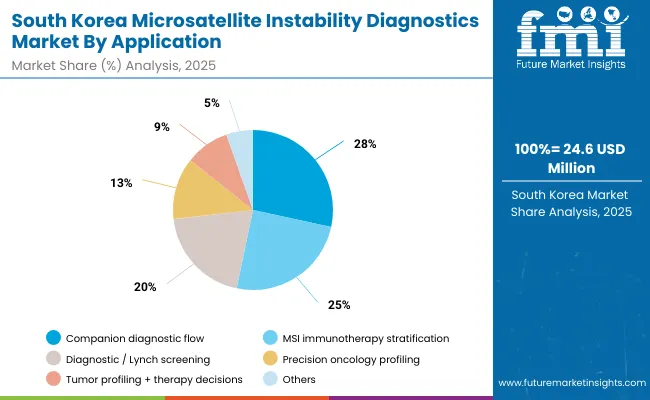
Opportunity Analysis of MSI Diagnostics in South Korea

Microsatellite Instability Diagnostics Market South Korea

The MSI Diagnostics Market in South Korea is estimated at USD 24.6 million in 2025 and is projected to grow at a CAGR of 5.5% through 2035. Growth is driven by government-led oncology programs under the Ministry of Health and Welfare (MOHW) that promote genetic testing and biomarker-driven therapy. Diagnostic segment account for 20.5% as Hospitals are investing in PCR and targeted NGS assays for Lynch syndrome screening and immunotherapy stratification, supported by national cancer control reimbursement policies.
  • South Korea’s market size represents ~3.1% of global MSI diagnostics revenue in 2025.
  • Hospitals and oncology centers are scaling adoption of MSI assays for colorectal and gastric cancer profiling.
  • Government initiatives linking precision oncology to national reimbursement frameworks are reinforcing test adoption in both public and private sectors.

Competition Landscape

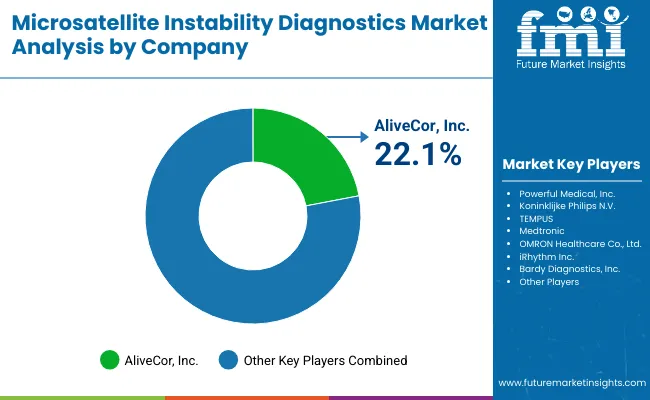
Microsatellite Instability Diagnostics Market By Company

The MSI Diagnostics market is moderately consolidated, with global leaders, established molecular diagnostic firms, and regional innovators competing across PCR, NGS, and companion diagnostic applications. Industry leaders such as Promega hold a significant market share, driven by their proprietary MSI Analysis System, which is widely adopted for regulatory-approved cancer testing and clinical research. Promega’s strength lies in its validated PCR-based assays and partnerships with oncology research institutions, reinforcing its position as the reference standard for MSI testing worldwide.

Global diagnostic giants like Thermo Fisher Scientific and Bio-Rad Laboratories command strong presence through broad molecular oncology portfolios that integrate MSI testing with NGS panels and multiplex PCR solutions. These companies are expanding their footprints via collaborations with pharmaceutical firms to co-develop MSI-linked companion diagnostics, ensuring alignment with immunotherapy drug approvals. Their strategies focus on scalability, automation, and integration with oncology decision-support systems.

Specialized firms such as Genecast, NeoGenomics, Biocartis, and AmoyDx are strengthening their foothold by offering targeted NGS platforms, immuno-oncology biomarker panels, and region-specific MSI solutions. For example, NeoGenomics leverages its clinical lab network in the USA, while Biocartis focuses on integrated molecular testing platforms in Europe. AmoyDx is expanding in Asia with companion diagnostics approved for use alongside immunotherapies. These players are particularly relevant in supporting precision oncology workflows in hospital and reference labs.

Emerging competitors and regional players under the “Other Players” category are driving accessibility through cost-efficient PCR kits, customized MSI testing workflows, and localized service partnerships. Their strength lies in affordability, regional regulatory alignment, and integration with hospital oncology departments.

As the market evolves, competitive differentiation is shifting from standalone MSI assays toward comprehensive genomic profiling, bioinformatics-enabled reporting, and integration with precision oncology ecosystems, where vendors compete not only on accuracy but also on interoperability and clinical decision-making support.

Key Development

  • In April 2025, Promega received NMPA Innovative Medical Device Registration in China for its ProDx MSI Detection Kit. The kit enables colorectal cancer screening to identify patients who may require further genetic testing for Lynch syndrome, marking a significant milestone for MSI diagnostics accessibility in China.
  • In July 2025, Paragon Genomics and Genecast announced a global partnership to integrate CleanPlex® NGS technology into Genecast’s oncology platforms, enhancing sensitivity and reliability in cancer diagnostics. The collaboration begins with the Genecast Focus Assay for MSI and somatic variants in solid tumors, expanding precision oncology access worldwide.

Scope of the Report

Item Value
Market Value (2025) USD 569.3 million
Product type PCR fragment analysis, Real-time PCR beacon, Targeted NGS, NGS comprehensive, and Others, highlighting the core diagnostic technologies shaping adoption trends
Application Diagnostic / Lynch screening, Companion diagnostic flow, MSI immunotherapy stratification, Precision oncology profiling, Tumor profiling + therapy decisions, and Others
End User Hospitals & reference laboratories, Clinical labs, Oncology Centers, and Others
Regions Covered North America, Latin America, Western & Eastern Europe, East Asia, South Asia & Pacific, Middle East & Africa
Countries Covered USA, Brazil, China, India, Germany, France, UK etc.
Key Companies Profiled Promega, Thermo Fisher Scientific, Bio-Rad Laboratories, Genecast, NeoGenomics, Biocartis, AmoyDx, and Others.
Additional Attributes Dollar sales by application and regions, adoption trends of NGS-based MSI testing, rising demand in companion diagnostics and immunotherapy stratification, and growing demand across oncology centers and hospital reference laboratories.

Key Segments

By Product Type:

  • PCR fragment analysis
  • Real-time PCR beacon
  • Targeted NGS
  • NGS comprehensive
  • Others

By Application:

  • Diagnostic / Lynch screening
  • Companion diagnostic flow
  • MSI immunotherapy stratification
  • Precision oncology profiling
  • Tumor profiling + therapy decisions
  • Others

By End User:

  • Hospital & reference lab
  • Clinical labs
  • Oncology Centers
  • Others

By Region:

  • North America
  • Latin America
  • East Asia
  • South Asia & Pacific
  • Western Europe
  • Eastern Europe
  • Middle East & Africa

Table of Content

  1. Executive Summary
    • Global Market Outlook
    • Demand-side Trends
    • Supply-side Trends
    • Technology Roadmap Analysis
    • Analysis and Recommendations
  2. Market Overview
    • Market Coverage / Taxonomy
    • Market Definition / Scope / Limitations
  3. Market Background
    • Market Dynamics
      • Drivers
      • Restraints
      • Opportunity
      • Trends
    • Scenario Forecast
      • Demand in Optimistic Scenario
      • Demand in Likely Scenario
      • Demand in Conservative Scenario
    • Opportunity Map Analysis
    • Product Life Cycle Analysis
    • Supply Chain Analysis
      • Supply Side Participants and their Roles
        • Producers
        • Mid-Level Participants (Traders/ Agents/ Brokers)
        • Wholesalers and Distributors
      • Value Added and Value Created at Node in the Supply Chain
      • List of Raw Material Suppliers
      • List of Existing and Potential Buyer’s
    • Investment Feasibility Matrix
    • Value Chain Analysis
      • Profit Margin Analysis
      • Wholesalers and Distributors
      • Retailers
    • PESTLE and Porter’s Analysis
    • Regulatory Landscape
      • By Key Regions
      • By Key Countries
    • Regional Parent Market Outlook
    • Production and Consumption Statistics
    • Import and Export Statistics
  4. Global Market Analysis 2020 to 2024 and Forecast, 2025 to 2035
    • Historical Market Size Value (USD Million) & Volume (Units) Analysis, 2020 to 2024
    • Current and Future Market Size Value (USD Million) & Volume (Units) Projections, 2025 to 2035
      • Y-o-Y Growth Trend Analysis
      • Absolute $ Opportunity Analysis
  5. Global Market Analysis 2020 to 2024 and Forecast 2025 to 2035, By Product Type
    • Introduction / Key Findings
    • Historical Market Size Value (USD Million) & Volume (Units) Analysis By Product Type, 2020 to 2024
    • Current and Future Market Size Value (USD Million) & Volume (Units) Analysis and Forecast By Product Type, 2025 to 2035
      • PCR fragment analysis
      • Real-time PCR beacon
      • Targeted NGS
      • NGS comprehensive
      • Others
    • Y-o-Y Growth Trend Analysis By Product Type, 2020 to 2024
    • Absolute $ Opportunity Analysis By Product Type, 2025 to 2035
  6. Global Market Analysis 2020 to 2024 and Forecast 2025 to 2035, By Application
    • Introduction / Key Findings
    • Historical Market Size Value (USD Million) & Volume (Units) Analysis By Application, 2020 to 2024
    • Current and Future Market Size Value (USD Million) & Volume (Units) Analysis and Forecast By Application, 2025 to 2035
      • Diagnostic / Lynch screening
      • Companion diagnostic flow
      • MSI immunotherapy stratification
      • Precision oncology profiling
      • Tumor profiling + therapy decisions
      • Others
    • Y-o-Y Growth Trend Analysis By Application, 2020 to 2024
    • Absolute $ Opportunity Analysis By Application, 2025 to 2035
  7. Global Market Analysis 2020 to 2024 and Forecast 2025 to 2035, By End User
    • Introduction / Key Findings
    • Historical Market Size Value (USD Million) & Volume (Units) Analysis By End User, 2020 to 2024
    • Current and Future Market Size Value (USD Million) & Volume (Units) Analysis and Forecast By End User, 2025 to 2035
      • Hospital & reference lab
      • Clinical labs
      • Oncology Centers
      • Others
    • Y-o-Y Growth Trend Analysis By End User, 2020 to 2024
    • Absolute $ Opportunity Analysis By End User, 2025 to 2035
  8. Global Market Analysis 2020 to 2024 and Forecast 2025 to 2035, By Region
    • Introduction
    • Historical Market Size Value (USD Million) & Volume (Units) Analysis By Region, 2020 to 2024
    • Current Market Size Value (USD Million) & Volume (Units) Analysis and Forecast By Region, 2025 to 2035
      • North America
      • Latin America
      • East Asia
      • South Asia & Pacific
      • Western Europe
      • Eastern Europe
      • Middle East & Africa
    • Market Attractiveness Analysis By Region
  9. North America Market Analysis 2020 to 2024 and Forecast 2025 to 2035, By Country
    • Historical Market Size Value (USD Million) & Volume (Units) Trend Analysis By Market Taxonomy, 2020 to 2024
    • Market Size Value (USD Million) & Volume (Units) Forecast By Market Taxonomy, 2025 to 2035
      • By Country
        • USA
        • Canada
        • Mexico
      • By Product Type
      • By Application
      • By End User
    • Market Attractiveness Analysis
      • By Country
      • By Product Type
      • By Application
      • By End User
    • Key Takeaways
  10. Latin America Market Analysis 2020 to 2024 and Forecast 2025 to 2035, By Country
    • Historical Market Size Value (USD Million) & Volume (Units) Trend Analysis By Market Taxonomy, 2020 to 2024
    • Market Size Value (USD Million) & Volume (Units) Forecast By Market Taxonomy, 2025 to 2035
      • By Country
        • Brazil
        • Argentina
        • Rest of Latin America
      • By Product Type
      • By Application
      • By End User
    • Market Attractiveness Analysis
      • By Country
      • By Product Type
      • By Application
      • By End User
    • Key Takeaways
  11. East Asia Market Analysis 2020 to 2024 and Forecast 2025 to 2035, By Country
    • Historical Market Size Value (USD Million) & Volume (Units) Trend Analysis By Market Taxonomy, 2020 to 2024
    • Market Size Value (USD Million) & Volume (Units) Forecast By Market Taxonomy, 2025 to 2035
      • By Country
        • China
        • Japan
        • South Korea
      • By Product Type
      • By Application
      • By End User
    • Market Attractiveness Analysis
      • By Country
      • By Product Type
      • By Application
      • By End User
    • Key Takeaways
  12. South Asia & Pacific Market Analysis 2020 to 2024 and Forecast 2025 to 2035, By Country
    • Historical Market Size Value (USD Million) & Volume (Units) Trend Analysis By Market Taxonomy, 2020 to 2024
    • Market Size Value (USD Million) & Volume (Units) Forecast By Market Taxonomy, 2025 to 2035
      • By Country
        • India
        • ASEAN Countries
        • Australia& New Zealand
        • Rest of South Asia
      • By Product Type
      • By Application
      • By End User
    • Market Attractiveness Analysis
      • By Country
      • By Product Type
      • By Application
      • By End User
    • Key Takeaways
  13. Western Europe Market Analysis 2020 to 2024 and Forecast 2025 to 2035, By Country
    • Historical Market Size Value (USD Million) & Volume (Units) Trend Analysis By Market Taxonomy, 2020 to 2024
    • Market Size Value (USD Million) & Volume (Units) Forecast By Market Taxonomy, 2025 to 2035
      • By Country
        • Germany
        • UK
        • France
        • Italy
        • Spain
        • BENELUX
        • Nordic Countries
        • Rest of Western Europe
      • By Product Type
      • By Application
      • By End User
    • Market Attractiveness Analysis
      • By Country
      • By Product Type
      • By Application
      • By End User
    • Key Takeaways
  14. Eastern Europe Market Analysis 2020 to 2024 and Forecast 2025 to 2035, By Country
    • Historical Market Size Value (USD Million) & Volume (Units) Trend Analysis By Market Taxonomy, 2020 to 2024
    • Market Size Value (USD Million) & Volume (Units) Forecast By Market Taxonomy, 2025 to 2035
      • By Country
        • Russia
        • Hungary
        • Poland
        • Rest of Eastern Europe
      • By Product Type
      • By Application
      • By End User
    • Market Attractiveness Analysis
      • By Country
      • By Product Type
      • By Application
      • By End User
    • Key Takeaways
  15. Middle East & Africa Market Analysis 2020 to 2024 and Forecast 2025 to 2035, By Country
    • Historical Market Size Value (USD Million) & Volume (Units) Trend Analysis By Market Taxonomy, 2020 to 2024
    • Market Size Value (USD Million) & Volume (Units) Forecast By Market Taxonomy, 2025 to 2035
      • By Country
        • Saudi Arabia
        • Türkiye
        • South Africa
        • Other African Union
        • Rest of Middle East & Africa
      • By Product Type
      • By Application
      • By End User
    • Market Attractiveness Analysis
      • By Country
      • By Product Type
      • By Application
      • By End User
    • Key Takeaways
  16. Key Countries Market Analysis
    • USA
      • Pricing Analysis
      • Market Share Analysis, 2024
        • By Product Type
        • By Application
        • By End User
    • Brazil
      • Pricing Analysis
      • Market Share Analysis, 2024
        • By Product Type
        • By Application
        • By End User
    • China
      • Pricing Analysis
      • Market Share Analysis, 2024
        • By Product Type
        • By Application
        • By End User
    • India
      • Pricing Analysis
      • Market Share Analysis, 2024
        • By Product Type
        • By Application
        • By End User
    • Europe
      • Pricing Analysis
      • Market Share Analysis, 2024
        • By Product Type
        • By Application
        • By End User
    • Germany
      • Pricing Analysis
      • Market Share Analysis, 2024
        • By Product Type
        • By Application
        • By End User
    • France
      • Pricing Analysis
      • Market Share Analysis, 2024
        • By Product Type
        • By Application
        • By End User
    • UK
      • Pricing Analysis
      • Market Share Analysis, 2024
        • By Product Type
        • By Application
        • By End User
  17. Market Structure Analysis
    • Competition Dashboard
    • Competition Benchmarking
    • Market Share Analysis of Top Players
      • By Regional
      • By Product Type
      • By Application
      • By End User
  18. Competition Analysis
    • Competition Deep Dive
      • Promega
        • Overview
        • Product Portfolio
        • Profitability by Market Segments (Product/Age /Sales Channel/Region)
        • Sales Footprint
        • Strategy Overview
          • Marketing Strategy
          • Product Strategy
          • Channel Strategy
      • Thermo Fisher Scientific
        • Overview
        • Product Portfolio
        • Profitability by Market Segments (Product/Age /Sales Channel/Region)
        • Sales Footprint
        • Strategy Overview
          • Marketing Strategy
          • Product Strategy
          • Channel Strategy
      • Bio-Rad Laboratories
        • Overview
        • Product Portfolio
        • Profitability by Market Segments (Product/Age /Sales Channel/Region)
        • Sales Footprint
        • Strategy Overview
          • Marketing Strategy
          • Product Strategy
          • Channel Strategy
      • Genecast
        • Overview
        • Product Portfolio
        • Profitability by Market Segments (Product/Age /Sales Channel/Region)
        • Sales Footprint
        • Strategy Overview
          • Marketing Strategy
          • Product Strategy
          • Channel Strategy
      • NeoGenomics
        • Overview
        • Product Portfolio
        • Profitability by Market Segments (Product/Age /Sales Channel/Region)
        • Sales Footprint
        • Strategy Overview
          • Marketing Strategy
          • Product Strategy
          • Channel Strategy
      • Biocartis
        • Overview
        • Product Portfolio
        • Profitability by Market Segments (Product/Age /Sales Channel/Region)
        • Sales Footprint
        • Strategy Overview
          • Marketing Strategy
          • Product Strategy
          • Channel Strategy
      • AmoyDx
        • Overview
        • Product Portfolio
        • Profitability by Market Segments (Product/Age /Sales Channel/Region)
        • Sales Footprint
        • Strategy Overview
          • Marketing Strategy
          • Product Strategy
          • Channel Strategy
      • Others
        • Overview
        • Product Portfolio
        • Profitability by Market Segments (Product/Age /Sales Channel/Region)
        • Sales Footprint
        • Strategy Overview
          • Marketing Strategy
          • Product Strategy
          • Channel Strategy
  19. Assumptions & Acronyms Used
  20. Research Methodology

List of Tables

  • Table 1: Global Market Value (USD Million) Forecast by Region, 2020-2035
  • Table 2: Global Market Volume (Units) Forecast by Region, 2020-2035
  • Table 3: Global Market Value (USD Million) Forecast by Product Type, 2020-2035
  • Table 4: Global Market Volume (Units) Forecast by Product Type, 2020-2035
  • Table 5: Global Market Value (USD Million) Forecast by Application, 2020-2035
  • Table 6: Global Market Volume (Units) Forecast by Application, 2020-2035
  • Table 7: Global Market Value (USD Million) Forecast by End User, 2020-2035
  • Table 8: Global Market Volume (Units) Forecast by End User, 2020-2035
  • Table 9: North America Market Value (USD Million) Forecast by Country, 2020-2035
  • Table 10: North America Market Volume (Units) Forecast by Country, 2020-2035
  • Table 11: North America Market Value (USD Million) Forecast by Product Type, 2020-2035
  • Table 12: North America Market Volume (Units) Forecast by Product Type, 2020-2035
  • Table 13: North America Market Value (USD Million) Forecast by Application, 2020-2035
  • Table 14: North America Market Volume (Units) Forecast by Application, 2020-2035
  • Table 15: North America Market Value (USD Million) Forecast by End User, 2020-2035
  • Table 16: North America Market Volume (Units) Forecast by End User, 2020-2035
  • Table 17: Latin America Market Value (USD Million) Forecast by Country, 2020-2035
  • Table 18: Latin America Market Volume (Units) Forecast by Country, 2020-2035
  • Table 19: Latin America Market Value (USD Million) Forecast by Product Type, 2020-2035
  • Table 20: Latin America Market Volume (Units) Forecast by Product Type, 2020-2035
  • Table 21: Latin America Market Value (USD Million) Forecast by Application, 2020-2035
  • Table 22: Latin America Market Volume (Units) Forecast by Application, 2020-2035
  • Table 23: Latin America Market Value (USD Million) Forecast by End User, 2020-2035
  • Table 24: Latin America Market Volume (Units) Forecast by End User, 2020-2035
  • Table 25: East Asia Market Value (USD Million) Forecast by Country, 2020-2035
  • Table 26: East Asia Market Volume (Units) Forecast by Country, 2020-2035
  • Table 27: East Asia Market Value (USD Million) Forecast by Product Type, 2020-2035
  • Table 28: East Asia Market Volume (Units) Forecast by Product Type, 2020-2035
  • Table 29: East Asia Market Value (USD Million) Forecast by Application, 2020-2035
  • Table 30: East Asia Market Volume (Units) Forecast by Application, 2020-2035
  • Table 31: East Asia Market Value (USD Million) Forecast by End User, 2020-2035
  • Table 32: East Asia Market Volume (Units) Forecast by End User, 2020-2035
  • Table 33: South Asia & Pacific Market Value (USD Million) Forecast by Country, 2020-2035
  • Table 34: South Asia & Pacific Market Volume (Units) Forecast by Country, 2020-2035
  • Table 35: South Asia & Pacific Market Value (USD Million) Forecast by Product Type, 2020-2035
  • Table 36: South Asia & Pacific Market Volume (Units) Forecast by Product Type, 2020-2035
  • Table 37: South Asia & Pacific Market Value (USD Million) Forecast by Application, 2020-2035
  • Table 38: South Asia & Pacific Market Volume (Units) Forecast by Application, 2020-2035
  • Table 39: South Asia & Pacific Market Value (USD Million) Forecast by End User, 2020-2035
  • Table 40: South Asia & Pacific Market Volume (Units) Forecast by End User, 2020-2035
  • Table 41: Western Europe Market Value (USD Million) Forecast by Country, 2020-2035
  • Table 42: Western Europe Market Volume (Units) Forecast by Country, 2020-2035
  • Table 43: Western Europe Market Value (USD Million) Forecast by Product Type, 2020-2035
  • Table 44: Western Europe Market Volume (Units) Forecast by Product Type, 2020-2035
  • Table 45: Western Europe Market Value (USD Million) Forecast by Application, 2020-2035
  • Table 46: Western Europe Market Volume (Units) Forecast by Application, 2020-2035
  • Table 47: Western Europe Market Value (USD Million) Forecast by End User, 2020-2035
  • Table 48: Western Europe Market Volume (Units) Forecast by End User, 2020-2035
  • Table 49: Eastern Europe Market Value (USD Million) Forecast by Country, 2020-2035
  • Table 50: Eastern Europe Market Volume (Units) Forecast by Country, 2020-2035
  • Table 51: Eastern Europe Market Value (USD Million) Forecast by Product Type, 2020-2035
  • Table 52: Eastern Europe Market Volume (Units) Forecast by Product Type, 2020-2035
  • Table 53: Eastern Europe Market Value (USD Million) Forecast by Application, 2020-2035
  • Table 54: Eastern Europe Market Volume (Units) Forecast by Application, 2020-2035
  • Table 55: Eastern Europe Market Value (USD Million) Forecast by End User, 2020-2035
  • Table 56: Eastern Europe Market Volume (Units) Forecast by End User, 2020-2035
  • Table 57: Middle East & Africa Market Value (USD Million) Forecast by Country, 2020-2035
  • Table 58: Middle East & Africa Market Volume (Units) Forecast by Country, 2020-2035
  • Table 59: Middle East & Africa Market Value (USD Million) Forecast by Product Type, 2020-2035
  • Table 60: Middle East & Africa Market Volume (Units) Forecast by Product Type, 2020-2035
  • Table 61: Middle East & Africa Market Value (USD Million) Forecast by Application, 2020-2035
  • Table 62: Middle East & Africa Market Volume (Units) Forecast by Application, 2020-2035
  • Table 63: Middle East & Africa Market Value (USD Million) Forecast by End User, 2020-2035
  • Table 64: Middle East & Africa Market Volume (Units) Forecast by End User, 2020-2035

List of Figures

  • Figure 1: Global Market Value (USD Million) by Product Type, 2025-2035
  • Figure 2: Global Market Value (USD Million) by Application, 2025-2035
  • Figure 3: Global Market Value (USD Million) by End User, 2025-2035
  • Figure 4: Global Market Value (USD Million) by Region, 2025-2035
  • Figure 5: Global Market Value (USD Million) Analysis by Region, 2020-2035
  • Figure 6: Global Market Volume (Units) Analysis by Region, 2020-2035
  • Figure 7: Global Market Value Share (%) and BPS Analysis by Region, 2025-2035
  • Figure 8: Global Market Y-o-Y Growth (%) Projections by Region, 2025-2035
  • Figure 9: Global Market Value (USD Million) Analysis by Product Type, 2020-2035
  • Figure 10: Global Market Volume (Units) Analysis by Product Type, 2020-2035
  • Figure 11: Global Market Value Share (%) and BPS Analysis by Product Type, 2025-2035
  • Figure 12: Global Market Y-o-Y Growth (%) Projections by Product Type, 2025-2035
  • Figure 13: Global Market Value (USD Million) Analysis by Application, 2020-2035
  • Figure 14: Global Market Volume (Units) Analysis by Application, 2020-2035
  • Figure 15: Global Market Value Share (%) and BPS Analysis by Application, 2025-2035
  • Figure 16: Global Market Y-o-Y Growth (%) Projections by Application, 2025-2035
  • Figure 17: Global Market Value (USD Million) Analysis by End User, 2020-2035
  • Figure 18: Global Market Volume (Units) Analysis by End User, 2020-2035
  • Figure 19: Global Market Value Share (%) and BPS Analysis by End User, 2025-2035
  • Figure 20: Global Market Y-o-Y Growth (%) Projections by End User, 2025-2035
  • Figure 21: Global Market Attractiveness by Product Type, 2025-2035
  • Figure 22: Global Market Attractiveness by Application, 2025-2035
  • Figure 23: Global Market Attractiveness by End User, 2025-2035
  • Figure 24: Global Market Attractiveness by Region, 2025-2035
  • Figure 25: North America Market Value (USD Million) by Product Type, 2025-2035
  • Figure 26: North America Market Value (USD Million) by Application, 2025-2035
  • Figure 27: North America Market Value (USD Million) by End User, 2025-2035
  • Figure 28: North America Market Value (USD Million) by Country, 2025-2035
  • Figure 29: North America Market Value (USD Million) Analysis by Country, 2020-2035
  • Figure 30: North America Market Volume (Units) Analysis by Country, 2020-2035
  • Figure 31: North America Market Value Share (%) and BPS Analysis by Country, 2025-2035
  • Figure 32: North America Market Y-o-Y Growth (%) Projections by Country, 2025-2035
  • Figure 33: North America Market Value (USD Million) Analysis by Product Type, 2020-2035
  • Figure 34: North America Market Volume (Units) Analysis by Product Type, 2020-2035
  • Figure 35: North America Market Value Share (%) and BPS Analysis by Product Type, 2025-2035
  • Figure 36: North America Market Y-o-Y Growth (%) Projections by Product Type, 2025-2035
  • Figure 37: North America Market Value (USD Million) Analysis by Application, 2020-2035
  • Figure 38: North America Market Volume (Units) Analysis by Application, 2020-2035
  • Figure 39: North America Market Value Share (%) and BPS Analysis by Application, 2025-2035
  • Figure 40: North America Market Y-o-Y Growth (%) Projections by Application, 2025-2035
  • Figure 41: North America Market Value (USD Million) Analysis by End User, 2020-2035
  • Figure 42: North America Market Volume (Units) Analysis by End User, 2020-2035
  • Figure 43: North America Market Value Share (%) and BPS Analysis by End User, 2025-2035
  • Figure 44: North America Market Y-o-Y Growth (%) Projections by End User, 2025-2035
  • Figure 45: North America Market Attractiveness by Product Type, 2025-2035
  • Figure 46: North America Market Attractiveness by Application, 2025-2035
  • Figure 47: North America Market Attractiveness by End User, 2025-2035
  • Figure 48: North America Market Attractiveness by Country, 2025-2035
  • Figure 49: Latin America Market Value (USD Million) by Product Type, 2025-2035
  • Figure 50: Latin America Market Value (USD Million) by Application, 2025-2035
  • Figure 51: Latin America Market Value (USD Million) by End User, 2025-2035
  • Figure 52: Latin America Market Value (USD Million) by Country, 2025-2035
  • Figure 53: Latin America Market Value (USD Million) Analysis by Country, 2020-2035
  • Figure 54: Latin America Market Volume (Units) Analysis by Country, 2020-2035
  • Figure 55: Latin America Market Value Share (%) and BPS Analysis by Country, 2025-2035
  • Figure 56: Latin America Market Y-o-Y Growth (%) Projections by Country, 2025-2035
  • Figure 57: Latin America Market Value (USD Million) Analysis by Product Type, 2020-2035
  • Figure 58: Latin America Market Volume (Units) Analysis by Product Type, 2020-2035
  • Figure 59: Latin America Market Value Share (%) and BPS Analysis by Product Type, 2025-2035
  • Figure 60: Latin America Market Y-o-Y Growth (%) Projections by Product Type, 2025-2035
  • Figure 61: Latin America Market Value (USD Million) Analysis by Application, 2020-2035
  • Figure 62: Latin America Market Volume (Units) Analysis by Application, 2020-2035
  • Figure 63: Latin America Market Value Share (%) and BPS Analysis by Application, 2025-2035
  • Figure 64: Latin America Market Y-o-Y Growth (%) Projections by Application, 2025-2035
  • Figure 65: Latin America Market Value (USD Million) Analysis by End User, 2020-2035
  • Figure 66: Latin America Market Volume (Units) Analysis by End User, 2020-2035
  • Figure 67: Latin America Market Value Share (%) and BPS Analysis by End User, 2025-2035
  • Figure 68: Latin America Market Y-o-Y Growth (%) Projections by End User, 2025-2035
  • Figure 69: Latin America Market Attractiveness by Product Type, 2025-2035
  • Figure 70: Latin America Market Attractiveness by Application, 2025-2035
  • Figure 71: Latin America Market Attractiveness by End User, 2025-2035
  • Figure 72: Latin America Market Attractiveness by Country, 2025-2035
  • Figure 73: East Asia Market Value (USD Million) by Product Type, 2025-2035
  • Figure 74: East Asia Market Value (USD Million) by Application, 2025-2035
  • Figure 75: East Asia Market Value (USD Million) by End User, 2025-2035
  • Figure 76: East Asia Market Value (USD Million) by Country, 2025-2035
  • Figure 77: East Asia Market Value (USD Million) Analysis by Country, 2020-2035
  • Figure 78: East Asia Market Volume (Units) Analysis by Country, 2020-2035
  • Figure 79: East Asia Market Value Share (%) and BPS Analysis by Country, 2025-2035
  • Figure 80: East Asia Market Y-o-Y Growth (%) Projections by Country, 2025-2035
  • Figure 81: East Asia Market Value (USD Million) Analysis by Product Type, 2020-2035
  • Figure 82: East Asia Market Volume (Units) Analysis by Product Type, 2020-2035
  • Figure 83: East Asia Market Value Share (%) and BPS Analysis by Product Type, 2025-2035
  • Figure 84: East Asia Market Y-o-Y Growth (%) Projections by Product Type, 2025-2035
  • Figure 85: East Asia Market Value (USD Million) Analysis by Application, 2020-2035
  • Figure 86: East Asia Market Volume (Units) Analysis by Application, 2020-2035
  • Figure 87: East Asia Market Value Share (%) and BPS Analysis by Application, 2025-2035
  • Figure 88: East Asia Market Y-o-Y Growth (%) Projections by Application, 2025-2035
  • Figure 89: East Asia Market Value (USD Million) Analysis by End User, 2020-2035
  • Figure 90: East Asia Market Volume (Units) Analysis by End User, 2020-2035
  • Figure 91: East Asia Market Value Share (%) and BPS Analysis by End User, 2025-2035
  • Figure 92: East Asia Market Y-o-Y Growth (%) Projections by End User, 2025-2035
  • Figure 93: East Asia Market Attractiveness by Product Type, 2025-2035
  • Figure 94: East Asia Market Attractiveness by Application, 2025-2035
  • Figure 95: East Asia Market Attractiveness by End User, 2025-2035
  • Figure 96: East Asia Market Attractiveness by Country, 2025-2035
  • Figure 97: South Asia & Pacific Market Value (USD Million) by Product Type, 2025-2035
  • Figure 98: South Asia & Pacific Market Value (USD Million) by Application, 2025-2035
  • Figure 99: South Asia & Pacific Market Value (USD Million) by End User, 2025-2035
  • Figure 100: South Asia & Pacific Market Value (USD Million) by Country, 2025-2035
  • Figure 101: South Asia & Pacific Market Value (USD Million) Analysis by Country, 2020-2035
  • Figure 102: South Asia & Pacific Market Volume (Units) Analysis by Country, 2020-2035
  • Figure 103: South Asia & Pacific Market Value Share (%) and BPS Analysis by Country, 2025-2035
  • Figure 104: South Asia & Pacific Market Y-o-Y Growth (%) Projections by Country, 2025-2035
  • Figure 105: South Asia & Pacific Market Value (USD Million) Analysis by Product Type, 2020-2035
  • Figure 106: South Asia & Pacific Market Volume (Units) Analysis by Product Type, 2020-2035
  • Figure 107: South Asia & Pacific Market Value Share (%) and BPS Analysis by Product Type, 2025-2035
  • Figure 108: South Asia & Pacific Market Y-o-Y Growth (%) Projections by Product Type, 2025-2035
  • Figure 109: South Asia & Pacific Market Value (USD Million) Analysis by Application, 2020-2035
  • Figure 110: South Asia & Pacific Market Volume (Units) Analysis by Application, 2020-2035
  • Figure 111: South Asia & Pacific Market Value Share (%) and BPS Analysis by Application, 2025-2035
  • Figure 112: South Asia & Pacific Market Y-o-Y Growth (%) Projections by Application, 2025-2035
  • Figure 113: South Asia & Pacific Market Value (USD Million) Analysis by End User, 2020-2035
  • Figure 114: South Asia & Pacific Market Volume (Units) Analysis by End User, 2020-2035
  • Figure 115: South Asia & Pacific Market Value Share (%) and BPS Analysis by End User, 2025-2035
  • Figure 116: South Asia & Pacific Market Y-o-Y Growth (%) Projections by End User, 2025-2035
  • Figure 117: South Asia & Pacific Market Attractiveness by Product Type, 2025-2035
  • Figure 118: South Asia & Pacific Market Attractiveness by Application, 2025-2035
  • Figure 119: South Asia & Pacific Market Attractiveness by End User, 2025-2035
  • Figure 120: South Asia & Pacific Market Attractiveness by Country, 2025-2035
  • Figure 121: Western Europe Market Value (USD Million) by Product Type, 2025-2035
  • Figure 122: Western Europe Market Value (USD Million) by Application, 2025-2035
  • Figure 123: Western Europe Market Value (USD Million) by End User, 2025-2035
  • Figure 124: Western Europe Market Value (USD Million) by Country, 2025-2035
  • Figure 125: Western Europe Market Value (USD Million) Analysis by Country, 2020-2035
  • Figure 126: Western Europe Market Volume (Units) Analysis by Country, 2020-2035
  • Figure 127: Western Europe Market Value Share (%) and BPS Analysis by Country, 2025-2035
  • Figure 128: Western Europe Market Y-o-Y Growth (%) Projections by Country, 2025-2035
  • Figure 129: Western Europe Market Value (USD Million) Analysis by Product Type, 2020-2035
  • Figure 130: Western Europe Market Volume (Units) Analysis by Product Type, 2020-2035
  • Figure 131: Western Europe Market Value Share (%) and BPS Analysis by Product Type, 2025-2035
  • Figure 132: Western Europe Market Y-o-Y Growth (%) Projections by Product Type, 2025-2035
  • Figure 133: Western Europe Market Value (USD Million) Analysis by Application, 2020-2035
  • Figure 134: Western Europe Market Volume (Units) Analysis by Application, 2020-2035
  • Figure 135: Western Europe Market Value Share (%) and BPS Analysis by Application, 2025-2035
  • Figure 136: Western Europe Market Y-o-Y Growth (%) Projections by Application, 2025-2035
  • Figure 137: Western Europe Market Value (USD Million) Analysis by End User, 2020-2035
  • Figure 138: Western Europe Market Volume (Units) Analysis by End User, 2020-2035
  • Figure 139: Western Europe Market Value Share (%) and BPS Analysis by End User, 2025-2035
  • Figure 140: Western Europe Market Y-o-Y Growth (%) Projections by End User, 2025-2035
  • Figure 141: Western Europe Market Attractiveness by Product Type, 2025-2035
  • Figure 142: Western Europe Market Attractiveness by Application, 2025-2035
  • Figure 143: Western Europe Market Attractiveness by End User, 2025-2035
  • Figure 144: Western Europe Market Attractiveness by Country, 2025-2035
  • Figure 145: Eastern Europe Market Value (USD Million) by Product Type, 2025-2035
  • Figure 146: Eastern Europe Market Value (USD Million) by Application, 2025-2035
  • Figure 147: Eastern Europe Market Value (USD Million) by End User, 2025-2035
  • Figure 148: Eastern Europe Market Value (USD Million) by Country, 2025-2035
  • Figure 149: Eastern Europe Market Value (USD Million) Analysis by Country, 2020-2035
  • Figure 150: Eastern Europe Market Volume (Units) Analysis by Country, 2020-2035
  • Figure 151: Eastern Europe Market Value Share (%) and BPS Analysis by Country, 2025-2035
  • Figure 152: Eastern Europe Market Y-o-Y Growth (%) Projections by Country, 2025-2035
  • Figure 153: Eastern Europe Market Value (USD Million) Analysis by Product Type, 2020-2035
  • Figure 154: Eastern Europe Market Volume (Units) Analysis by Product Type, 2020-2035
  • Figure 155: Eastern Europe Market Value Share (%) and BPS Analysis by Product Type, 2025-2035
  • Figure 156: Eastern Europe Market Y-o-Y Growth (%) Projections by Product Type, 2025-2035
  • Figure 157: Eastern Europe Market Value (USD Million) Analysis by Application, 2020-2035
  • Figure 158: Eastern Europe Market Volume (Units) Analysis by Application, 2020-2035
  • Figure 159: Eastern Europe Market Value Share (%) and BPS Analysis by Application, 2025-2035
  • Figure 160: Eastern Europe Market Y-o-Y Growth (%) Projections by Application, 2025-2035
  • Figure 161: Eastern Europe Market Value (USD Million) Analysis by End User, 2020-2035
  • Figure 162: Eastern Europe Market Volume (Units) Analysis by End User, 2020-2035
  • Figure 163: Eastern Europe Market Value Share (%) and BPS Analysis by End User, 2025-2035
  • Figure 164: Eastern Europe Market Y-o-Y Growth (%) Projections by End User, 2025-2035
  • Figure 165: Eastern Europe Market Attractiveness by Product Type, 2025-2035
  • Figure 166: Eastern Europe Market Attractiveness by Application, 2025-2035
  • Figure 167: Eastern Europe Market Attractiveness by End User, 2025-2035
  • Figure 168: Eastern Europe Market Attractiveness by Country, 2025-2035
  • Figure 169: Middle East & Africa Market Value (USD Million) by Product Type, 2025-2035
  • Figure 170: Middle East & Africa Market Value (USD Million) by Application, 2025-2035
  • Figure 171: Middle East & Africa Market Value (USD Million) by End User, 2025-2035
  • Figure 172: Middle East & Africa Market Value (USD Million) by Country, 2025-2035
  • Figure 173: Middle East & Africa Market Value (USD Million) Analysis by Country, 2020-2035
  • Figure 174: Middle East & Africa Market Volume (Units) Analysis by Country, 2020-2035
  • Figure 175: Middle East & Africa Market Value Share (%) and BPS Analysis by Country, 2025-2035
  • Figure 176: Middle East & Africa Market Y-o-Y Growth (%) Projections by Country, 2025-2035
  • Figure 177: Middle East & Africa Market Value (USD Million) Analysis by Product Type, 2020-2035
  • Figure 178: Middle East & Africa Market Volume (Units) Analysis by Product Type, 2020-2035
  • Figure 179: Middle East & Africa Market Value Share (%) and BPS Analysis by Product Type, 2025-2035
  • Figure 180: Middle East & Africa Market Y-o-Y Growth (%) Projections by Product Type, 2025-2035
  • Figure 181: Middle East & Africa Market Value (USD Million) Analysis by Application, 2020-2035
  • Figure 182: Middle East & Africa Market Volume (Units) Analysis by Application, 2020-2035
  • Figure 183: Middle East & Africa Market Value Share (%) and BPS Analysis by Application, 2025-2035
  • Figure 184: Middle East & Africa Market Y-o-Y Growth (%) Projections by Application, 2025-2035
  • Figure 185: Middle East & Africa Market Value (USD Million) Analysis by End User, 2020-2035
  • Figure 186: Middle East & Africa Market Volume (Units) Analysis by End User, 2020-2035
  • Figure 187: Middle East & Africa Market Value Share (%) and BPS Analysis by End User, 2025-2035
  • Figure 188: Middle East & Africa Market Y-o-Y Growth (%) Projections by End User, 2025-2035
  • Figure 189: Middle East & Africa Market Attractiveness by Product Type, 2025-2035
  • Figure 190: Middle East & Africa Market Attractiveness by Application, 2025-2035
  • Figure 191: Middle East & Africa Market Attractiveness by End User, 2025-2035
  • Figure 192: Middle East & Africa Market Attractiveness by Country, 2025-2035

Frequently Asked Questions

How big is the Microsatellite Instability (MSI) Diagnostics market in 2025?

The global Microsatellite Instability (MSI) Diagnostics market is estimated to be valued at USD 569.3 million in 2025.

What will be the size of the Microsatellite Instability (MSI) Diagnostics market in 2035?

The market size for Microsatellite Instability (MSI) Diagnostics is projected to reach USD 991.0 million by 2035.

How much will the Microsatellite Instability (MSI) Diagnostics market grow between 2025 and 2035?

The Microsatellite Instability (MSI) Diagnostics market is expected to grow at a CAGR of 5.7% during this period.

What are the key product types in the Microsatellite Instability (MSI) Diagnostics market?

Key product types include PCR fragment analysis, Real-time PCR beacon, Targeted NGS, NGS comprehensive, and Others.

Which application segment will contribute a significant share in the Microsatellite Instability (MSI) Diagnostics market in 2025?

The Companion diagnostic flow segment is projected to command 28.4% of the market in 2025.

Explore Similar Insights

Future Market Insights

Microsatellite Instability Diagnostics Market