

- Market Size (2026)
- USD 155.0 Mn
- Forecast (2036)
- USD 432.2 Mn
- CAGR (2026 to 2036)
- 10.8%
Monopropionin Feed Additives Market Size, Market Forecast and Outlook By FMI
USD 155.0 million in 2026 and USD 432.2 million by 2036 at a 10.8% CAGR.
Feed preservation and gut-stability decisions are moving closer to ingredient review, mill handling, and species-specific output. FDA’s 2025 animal food ingredient consultation process gives developers another route to discuss animal food ingredients, which is expected to sharpen documentation expectations before feed additives enter commercial formulas. Monopropionin products often comes between preservative chemistry and nutrition service. Buyers are likely to use the category where propionate-based control and safer handling reduce formulation risk across high-volume feed programs.
Feed mills, premix suppliers, integrators, and livestock producers are expected to treat this category as a performance-control purchase. Grain variability and protein-cost pressure keep feed efficiency inside routine buying discussions. Suppliers gain attention when they connect acidifier chemistry to shelf stability, palatability protection and species-level performance evidence. The buyer value is practical: fewer failed trials, clearer specification records and a stronger basis for repeat use in commercial diets.
Product value is expected to rise in programs that connect organic acids to feed hygiene, premix stability, and gut-health positioning. Mature markets are projected to weight audit records and supply continuity. Also, higher-growth markets are likely to weight access, local service and channel reach. Sourcing teams are expected to favor partners that reduce technical handoffs before formulation risk spreads across nutrition, quality and farm operations teams.
Summary of the Monopropionin Feed Additives Market
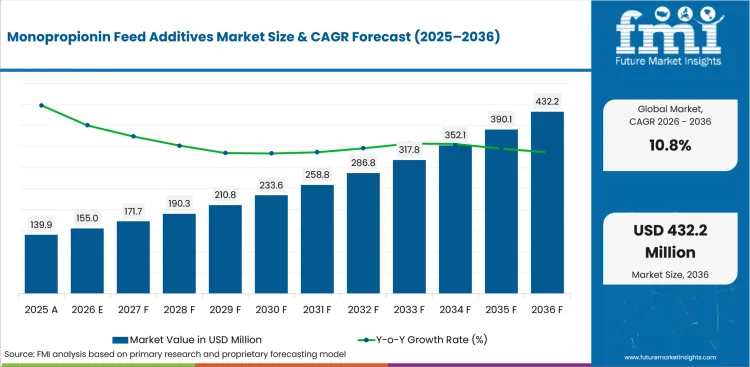
| Parameter | Details |
|---|---|
| 2025 Market Size | USD 139.9 million |
| 2026 Market Size | USD 155.0 million |
| 2036 Market Size | USD 432.2 million |
| Forecast CAGR (2026 to 2036) | 10.8% |
| Form Focus | Dry (38.5% share in 2026) |
| Source Focus | Microbial (36.0% share in 2026) |
| Livestock Focus | Poultry (38.5% share in 2026) |
| Key Countries | USA, Germany, France, UK |
| Market Signal | Commercial Impact |
|---|---|
| Demand and Growth Drivers |
Feed mills and livestock integrators are expected to increase use of monopropionin feed additives where preservation control and gut-health support sit inside the same purchasing decision.
|
| Product and Segment View |
Dry form, microbial source positioning and poultry use lead their respective categories in 2026. These segments are supported by easier mill handling, traceability needs and feed-conversion pressure in high-volume diets.
|
| Geography and Growth Outlook |
Country-wise expansion is expected to be led by India and China due to animal-protein demand and wider premix adoption. North America is likely to grow through documentation-led purchasing and species-specific formulation programs.
|
| Competitive Landscape |
Competition is projected to focus on acidifier expertise, species support and local technical service. Suppliers with reliable delivery and stronger formulation support are expected to receive better consideration in commercial feed accounts.
|
| Analyst Perspective | The primary adoption factor is expected to be proof that preservation control improves feed handling and diet consistency. Suppliers are expected to retain accounts when they reduce formulation uncertainty and support feed mills after scale-up.
|
How is the Monopropionin Feed Additives Market segmented?
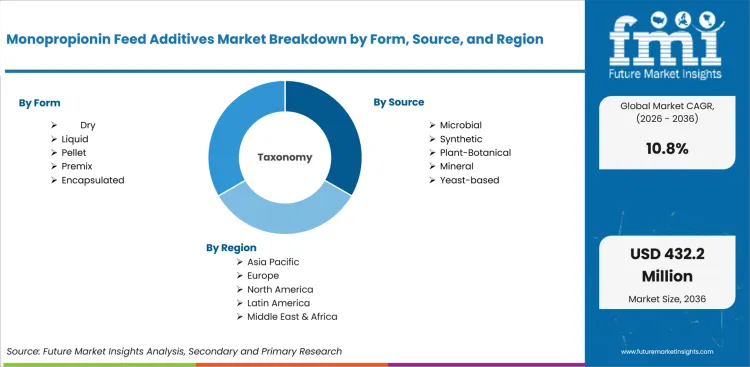
The monopropionin feed additives industry is segmented by form, source, livestock, function, and region.
The monopropionin feed additives market is segmented by form, source, livestock, function, and region. By form, the market covers dry, liquid, pellet, premix, and encapsulated products. By source, it covers synthetic, microbial, plant or botanical, mineral, and yeast-based inputs. By livestock, it covers poultry, swine, ruminants, aquaculture, and equine and pets. By function, it covers gut health, growth performance, immunity, nutrient utilization, and stress management. Regional coverage includes North America, Europe, East Asia, South Asia, and Latin America, supported by adjacent demand in animal feed protein ingredients.
How does dry shape demand within the form category?
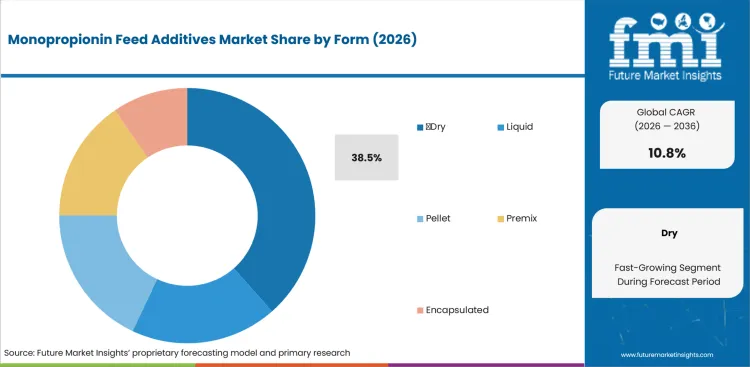
Form selection is expected to influence feed-mill adoption before a buyer approves broader use. Dry formats carry sourcing importance due to dosing familiarity and lower handling friction. Mills need additives that fit storage routines and blending lines. Supplier records need to address flow behavior, shelf stability, and line compatibility before production teams move beyond trial batches.
- Dry is expected to account for 38.5% market share in 2026, supported by dosing familiarity and mill-storage fit. FDA’s 2025 ingredient consultation process gives animal-food developers a clearer route for ingredient discussion, which explains why dry-format suppliers need stronger documentation before scale-up.
- The executive case for dry centers on lower handling risk which is feed mills gain a format that fits existing storage and blending routines. Dry programs also support feed premix programs decisions, helping quality control teams compare line behavior and supplier records before wider purchase approval.
What supports demand for microbial source choices?
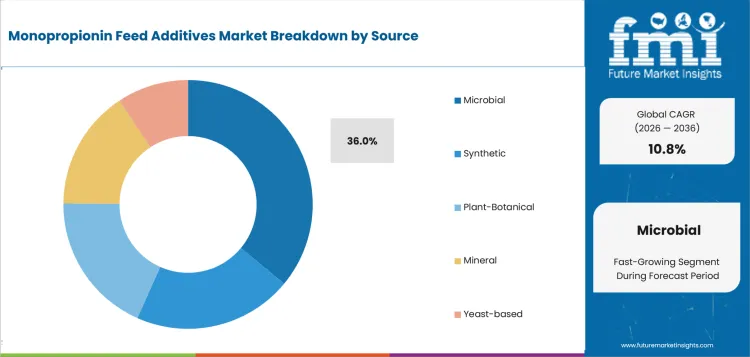
Source decisions are anticipated to shape buyer trust before additive programs move into species-specific diets. Microbial positioning fits buyers seeking traceability and a more defined biological claim. The purchase decision still depends on evidence depth and batch consistency. Sourcing teams need suppliers that explain source control and performance evidence in terms understood by formulation and quality staff.
- Microbial is projected to represent 36.0% of the market in 2026, driven by traceability needs and biological positioning. OECD-FAO expects poultry to account for 62% of additional meat produced over the next decade, which supports closer review of feed-input consistency.
- Premix formulators in animal nutrition gain from microbial inputs due to clearer source narratives and species-fit positioning. The buying decision remains practical due to proof needs for stability and nutrient interaction before broader purchasing. Suppliers must show batch consistency before teams extend the source into more commercial diets.
How do buyers evaluate poultry within the livestock category?
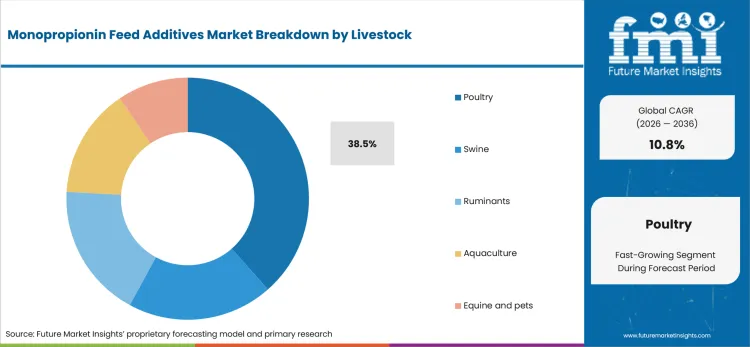
Livestock selection is poised to influence the evidence burden for feed additive suppliers. Poultry buyers face fast production cycles and tight feed-conversion scrutiny. A small issue in feed quality moves quickly into farm performance records. Nutrition teams need additive programs that connect gut-health support to measurable flock outcomes and mill-level handling control.
- Poultry is anticipated to hold 38.5% share in 2026, attributable to fast feed-conversion cycles and diet-frequency pressure. India’s 2024-25 poultry meat output reached 5.18 million tonnes, which indicates why additive suppliers need poultry-specific service depth in expanding markets.
- For integrators, poultry reduces tolerance for inconsistent additive behavior due to frequent diet changes and flock-level performance tracking. Buyers seeking antimicrobial feed additives alternatives are expected to prefer suppliers that connect preservation control to gut-stability evidence before commercial use.
How is gut health positioned within the function category?
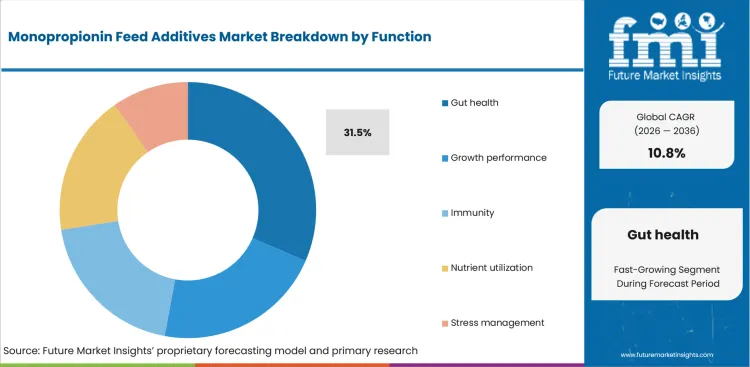
Function selection is likely to move the discussion from preservation alone toward animal performance control. Gut health creates a direct buyer promise that must fit formulation evidence and farm records. The category requires proof that an additive improves diet stability without disrupting intake or handling. Technical support becomes part of the product review before supplier approval.
- Gut health is estimated to reach 31.5% share in 2026, due to buyer need for measurable nutrition outcomes and stability support. Cargill reported new mycotoxin and poultry gut-health research in 2025, which shows how suppliers are linking additive programs to practical risk evidence.
- The buying decision for gut health is about outcome confidence: nutrition teams need a product story that survives trial review and farm feedback. Products adjacent to feed phytogenics are likely to face similar evidence demands where buyers compare gut stability and performance claims.
What are the drivers, restraints, and opportunities in the Monopropionin Feed Additives Market?
Near-term purchases are being shaped by preservation control and trial evidence. Species expansion shapes the supplier access route outlined below.
- Driver: Feed-cost pressure and raw-material variability are expected to push buyers toward additives that support diet predictability and handling control.
- Restraint: Weak trial evidence is anticipated to delay approval in accounts that need species data and mill-ready handling records.
- Opportunity: Species-specific premixes are projected to create entry routes for suppliers that provide technical service and clear documentation.
Feed mills are expected to increase spending activity if additive briefs connect preservation control to stable production. FDA’s 2025 AFIC process reinforces the need for clearer animal-food ingredient records during supplier review. Suppliers that explain documentation needs in operational language are likely to gain trial access before broader supply contracts are discussed.
Quality control teams are likely to slow adoption in accounts that lack clear ownership across formulation and mill operations. Handling control also needs a named owner before rollout. Adisseo launched Sanion Tetra protected sodium butyrate products in 2026, reflecting how suppliers are packaging acid-based nutrition claims for more controlled application review.
Implementation barriers are projected to create a route for vendors that bundle acidifier knowledge and application service. Cargill completed a 2025 micronutrition expansion in Austria, raising annual capacity to 30,000 metric tons and increasing support for premix reliability. The capacity signal favors suppliers that combine feed-additive know-how with dependable regional supply.
Which country CAGRs are profiled in the Monopropionin Feed Additives Market?
.webp "Top Country Growth Comparison Monopropionin Feed Additives Market Cagr (2026 2036)")
| Country | CAGR |
|---|---|
| United States | 6.5% |
| China | 8.1% |
| India | 9.7% |
| Germany | 5.5% |
| United Kingdom | 5.9% |
| Japan | 4.6% |
| South Korea | 6.3% |
Source: FMI's proprietary forecasting model and primary research
How do country-level CAGRs compare in the Monopropionin Feed Additives Market?
Country CAGR profiles in the monopropionin feed additives market reflect animal-production intensity, feed-cost discipline, and supplier documentation needs. India and China show higher conversion potential due to production scale and feed-modernization pressure. The United States and South Korea sit in a mid-tier adoption band shaped by technical service and traceability needs. The United Kingdom and Germany show steadier purchasing through compliance-led feed programs. Japan reflects a careful evidence cycle where supplier trust and handling proof guide account conversion.
- By 2036, the United States is projected to grow at 6.5% CAGR due to documentation-led buying and high-volume animal nutrition programs. USDA ERS reported milk production of 19.470 billion pounds in October 2025. Dairy, poultry and swine buyers are expected to keep additive review tied to feed-cost control and formulation stability. Perstorp and Cargill are positioned to gain traction where acidifier support and commercial supply reliability guide account approval.
- China’s demand outlook is anticipated to advance at 8.1% CAGR over the assessment period, supported by high livestock output and feed-mill modernization. The National Bureau of Statistics reported 100.72 million tons of pork, beef, mutton, and poultry output in 2025. Large integrated producers are expected to prioritize additives that protect feed quality during rapid production cycles. Companies such as BASF and Cargill stand to build account presence where propionate know-how and mill service align.
- India is forecast to rise at 9.7% CAGR over the forecast period, attributable to poultry expansion and rising premix sophistication. PIB reported poultry meat production of 5.18 million tonnes during 2024-25. Integrators and regional feed mills are expected to expand additive trials where gut-health support reduces performance variability. dsm-firmenich and Novonesis are likely to gain repeat discussions where biosolutions support nutrition teams.
- Adoption in Germany is estimated to post 5.5% CAGR over the forecast period, owing to strict feed documentation and established quality systems. Destatis commercial meat-production data cover the market through 2025, keeping species output visible for feed planners. Buyers are expected to favor suppliers that support traceability and preservative evidence before additive adoption widens. Perstorp, BASF, and Addcon remain practical options where organic acid experience carries priortize sourcing.
- The United Kingdom outlook is projected to record 5.9% CAGR over the assessment period, driven by feed-cost pressure and supply reliability needs. Defra reported compound animal feed value of £4.4 billion in 2025. Feed mills and integrated livestock buyers are expected to compare additive performance against raw-material variability and handling costs. Distributors with application support are likely to gain access where regional service reduces trial friction.
- In Japan, monopropionin feed additive demand is predicted to advance at 4.6% CAGR over the forecast period due to conservative trial review and quality discipline. USDA FAS expected Japan’s 2026 chicken production to match 2025 levels amid feed-cost and biosecurity pressure. Feed buyers are likely to use additives selectively where performance proof fits stable production routines. Specialist suppliers are expected to build presence where documentation depth guides approvals.
- South Korea is estimated to post 6.3% CAGR over the forecast period, supported by concentrated livestock systems and performance-focused purchasing. Statistics Korea reported that Korean beef cattle production costs rose by 13 thousand won per 100 kg live weight in 2025. Cost pressure is expected to keep feed-efficiency tools inside purchasing reviews.
Who are the notable companies in the Monopropionin Feed Additives Market?
Perstorp, Cargill, ADM, dsm-firmenich, Kemin Industries, Alltech, Novonesis, Adisseo, Trouw Nutrition (Nutreco), BASF, and Addcon are the notable companies shaping this market.
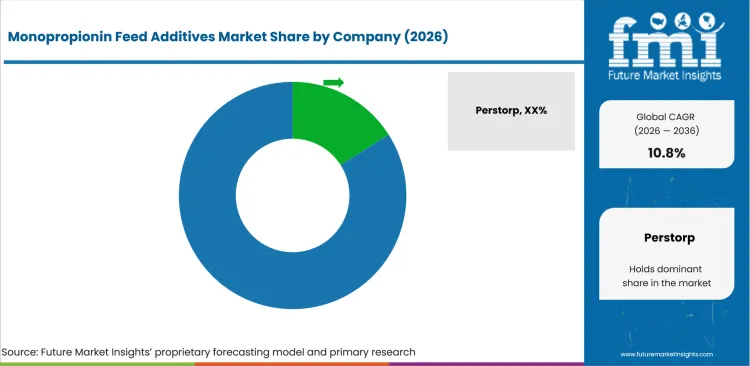
Competition in the monopropionin feed additives market is split by organic-acid know-how, premix access, and applied nutrition service. Perstorp, BASF, and Addcon are more suited to preservation-led accounts. Cargill, ADM, and Trouw Nutrition are practical choices for integrated feed customers. Kemin Industries, Alltech, and Adisseo gain preference in species and gut-health programs. Novonesis and dsm-firmenich retain visibility in biosolutions environments. The buyer decision is expected to center on which supplier reduces trial risk and documentation work.
- Perstorp and BASF focus on organic acid and propionate experience, which addresses mills needing preservation support and handling proof in one supplier screen. Buyers use these portfolios to compare acidifier chemistry, stability records, and feed hygiene support before commercial diet approval.
- Buyers choosing Cargill or ADM are typically looking for premix access due to broader ingredient reach and local service networks. Cargill’s micronutrition capacity expansion helps sourcing teams reduce supply risk during scale-up and routine feed programs.
- Kemin Industries, Alltech and Adisseo gain preference in species-focused environments due to technical service and gut-health positioning. These companies help nutrition teams translate feed additive claims into trial plans that farm operations teams can evaluate.
- In biosolutions-led accounts, Novonesis and dsm-firmenich are prominent due to enzyme and microbial feed expertise. Sourcing teams select these suppliers in accounts whose internal R&D needs help linking biological inputs to nutrition performance.
Competitive Benchmarking: Monopropionin Feed Additives Market
| Company | Acidifier Fit | Feed-Mill Service | Species Support | Geographic Reach |
|---|---|---|---|---|
| Perstorp | High | Strong | Medium | Global |
| Cargill | Strong | High | Strong | Global |
| ADM | Medium | Strong | Medium | Global |
| dsm-firmenich | Medium | Strong | High | Global |
| Kemin Industries | Strong | Strong | High | Global |
| Alltech | Medium | Strong | High | Global |
| Novonesis | Medium | High | Strong | Global |
| Adisseo | Strong | Strong | High | Global |
| Trouw Nutrition (Nutreco) | Medium | High | Strong | Global |
| BASF | High | Medium | Medium | Global |
| Addcon | High | Medium | Medium | Regional |
Source: Future Market Insights competitive analysis, 2026. Ratings reflect relative portfolio relevance and workflow fit. Service capability and geographic reach shape the remaining comparison.
Key Developments in the Monopropionin Feed Additives Market
- In June 2025, Novonesis completed the acquisition of dsm-firmenich’s share of the Feed Enzyme Alliance. The deal brought sales and distribution for animal feed enzymes and microbes closer to one commercial structure. Feed additive buyers are expected to review Novonesis more often where enzyme and microbial expertise supports nutrition programs.
- In November 2025, Cargill completed expansion of its Engerwitzdorf micronutrition facility in Austria. The site reached annual capacity of 30,000 metric tons and supports feed fortification at larger scale. Premix buyers are likely to view the expansion as evidence of stronger supply continuity and quality-control depth.
- In March 2026, Adisseo launched Sanion Tetra 50 and Sanion Tetra 70 protected sodium butyrate feed additives. The launch widened its protected organic-acid portfolio for gut-health programs. Nutrition teams are expected to compare these products where handling control and intestinal performance support are both required.
- In August 2025, dsm-firmenich opened a new Animal Nutrition & Health feed additive plant in Jadcherla, India. The facility strengthened its local manufacturing presence for feed additives. Indian feed buyers are expected to prefer suppliers that combine regional availability and technical support during formulation trials.
Key Players in the Monopropionin Feed Additives Market
Organic acid and preservation specialists
- Perstorp
- BASF
- Addcon
Integrated feed and ingredient suppliers
- Cargill
- ADM
- Trouw Nutrition (Nutreco)
Specialty feed additive suppliers
- Kemin Industries
- Alltech
- Adisseo
Biotechnology and biosolutions suppliers
- dsm-firmenich
- Novonesis
Monopropionin Feed Additives Market - Report Scope
| Coverage field | Report scope |
|---|---|
| Market breakdown | Monopropionin Feed Additives Market Breakdown by form, source, livestock, function, and region |
| Market Definition | Monopropionin and related propionate-based feed additive products used by feed mills, premix suppliers, and livestock producers to support feed preservation, handling control, and species-specific nutrition programs. |
| Regions Covered | North America, Latin America, Europe, East Asia, South Asia and Pacific, Middle East and Africa |
| Countries Covered | United States, China, India, Germany, United Kingdom, Japan, South Korea and additional country markets |
| Key Companies Profiled | Perstorp, Cargill, ADM, dsm-firmenich, Kemin Industries, Alltech, Novonesis, Adisseo, Trouw Nutrition (Nutreco), BASF, Addcon |
| Forecast Period | 2026 to 2036 |
| Approach | Hybrid methodology using segment adoption, buyer use cases, country CAGRs, supplier portfolios, and verified public-source signals |
Source: Future Market Insights - analysis driven by proprietary forecasting models and primary research
Monopropionin Feed Additives Market - Research Methodology
| Method | Approach |
|---|---|
| Primary Research | FMI analysts gathered input from manufacturers, service providers, technology developers, distributors, end users, procurement teams, and subject-matter experts. Interviews examined purchasing decisions, product or service evaluation, adoption barriers, approval requirements, pricing considerations, and expectations for technical or commercial support. Respondents were also asked what evidence is required before a trial, pilot, or initial order develops into regular purchasing. |
| Desk Research | Desk research covered government statistics, regulatory publications, trade data, industry associations, technical literature, standards, company filings, product information, and official corporate announcements. Sources were reviewed for relevance, publication date, geographic coverage, and consistency with the defined market scope. Claims relating to performance, applications, approvals, capacity, investment, and commercial activity were retained only when supported by credible public evidence. |
| Market Sizing and Forecasting | The market model combined the baseline value with historical performance, segment structure, pricing and volume indicators, adoption levels, company participation, and country-level demand conditions. Forecast assumptions considered economic activity, investment trends, regulatory developments, technology adoption, purchasing cycles, supply availability, and barriers to wider market use. Segment and regional estimates were reconciled before the final market total was calculated. |
| Data Validation | Estimates were checked against multiple independent indicators, including public data, company activity, trade patterns, industry developments, and findings from primary interviews. Validation also tested whether products, services, applications, and company revenues fell within the defined market boundaries. Adjacent categories, unsupported claims, overlapping revenues, and activities without direct market relevance were excluded to reduce double counting and maintain consistency across segments and countries. |
Source: Future Market Insights (FMI) analysis, based on proprietary forecasting model and primary research
Monopropionin Feed Additives Market by Segments
Monopropionin Feed Additives Market segmented by Form:
- Dry
- Liquid
- Pellet
- Premix
- Encapsulated
Monopropionin Feed Additives Market segmented by Source:
- Synthetic
- Microbial
- Plant/Botanical
- Mineral
- Yeast-based
Monopropionin Feed Additives Market segmented by Livestock:
- Poultry
- Swine
- Ruminants
- Aquaculture
- Equine and pets
Monopropionin Feed Additives Market segmented by Function:
- Gut health
- Growth performance
- Immunity
- Nutrient utilization
- Stress management
Monopropionin Feed Additives Market by Region:
- North America
- United States
- Canada
- Mexico
- Latin America
- Brazil
- Chile
- Rest of Latin America
- Western Europe
- Germany
- United Kingdom
- Italy
- Spain
- France
- Nordic
- BENELUX
- Rest of Western Europe
- Eastern Europe
- Poland
- Hungary
- Balkan and Baltic
- Rest of Eastern Europe
- East Asia
- China
- Japan
- South Korea
- South Asia and Pacific
- India
- ASEAN
- Australia and New Zealand
- Rest of South Asia and Pacific
- Middle East and Africa
- Kingdom of Saudi Arabia
- Other GCC Countries
- Turkiye
- South Africa
- Other African Union
- Rest of Middle East and Africa
Research Sources and Bibliography
- USA Food and Drug Administration. (2025, September). Animal Food Ingredient Consultation (AFIC).
- USA Food and Drug Administration. (2025, September). FDA Issues Two Draft Guidances on Animal Food Ingredient Consultation and Enforcement Policy.
- National Bureau of Statistics of China. (2026, February). Statistical Communiqué of the People’s Republic of China on the 2025 National Economic and Social Development.
- Press Information Bureau, Government of India. (2025, November). Union Minister releases Basic Animal Husbandry Statistics 2025.
- Department for Environment, Food & Rural Affairs. (2026, June). Agriculture in the United Kingdom 2025.
- USA Department of Agriculture Economic Research Service. (2025, December). Livestock, Dairy, and Poultry Outlook: December 2025.
- Statistics Korea. (2026, May). 2025 Livestock Production Cost Survey Results.
- USA Department of Agriculture Foreign Agricultural Service. (2025, September). Poultry and Products Annual: Japan.
- OECD and Food and Agriculture Organization of the United Nations. (2025, July). OECD-FAO Agricultural Outlook 2025-2034.
- Perstorp. (2026). Animal nutrition solutions.
- Cargill. (2025, March). Cargill Animal Nutrition & Health presents new mycotoxin insights at World Mycotoxin Forum 2025.
- Cargill. (2025, November). Cargill Animal Nutrition & Health increases micronutrition capacity with major expansion in Austria.
- Adisseo. (2026, March). Adisseo expands butyrate portfolio with Sanion Tetra.
- Novonesis. (2025, June). Deal to acquire dsm-firmenich’s share of the Feed Enzyme Alliance is completed.
- dsm-firmenich. (2025, August). dsm-firmenich opens new Animal Nutrition & Health feed additive plant in Jadcherla, India.
- BASF. (2026). Animal nutrition solutions for feed preservation and livestock performance.
- Kemin Industries. (2026). Animal nutrition and health solutions.
- Alltech. (2025, September). ADM and Alltech announce intention to create North American animal feed joint venture.
This bibliography is provided for reader reference and uses primary government, standards-body, official trade body, and company sources.
This Report Answers
- What is the expected value of the monopropionin feed additives market in 2026 and 2036?
- What CAGR is forecast for the monopropionin feed additives market from 2026 to 2036?
- Which segments shape form and source demand alongside livestock and function demand?
- Which buyer pressures are expected to support monopropionin feed additive adoption?
- How do country CAGRs differ across the profiled markets?
- Which companies compete across acidifier chemistry, premix access, and feed-additive service?
- How does FMI validate forecasts and avoid duplicate external statistics?
- What buyer factors should suppliers address before broader account expansion?
- How do handling proof and documentation affect supplier selection?
Frequently Asked Questions
Why should executives track the Monopropionin Feed Additives Market?
Executives should track this market because feed additive choices are shifting from simple preservation to documented performance and handling control.
What business problem does the Monopropionin Feed Additives Market address?
It helps feed buyers reduce uncertainty around formulation behavior, feed preservation, gut-health support, and repeatable mill use.
What should procurement leaders evaluate before selecting suppliers?
Procurement leaders should evaluate acidifier evidence, species support, handling behavior, regional supply, and trial documentation before broader approval.
What can limit return on investment for buyers?
Return on investment can be limited by weak species evidence, unclear internal ownership, and handling changes that have not been planned.
How can suppliers build executive confidence?
Suppliers build confidence by providing tested product records, formulation support, local service continuity, and measured trial outcomes for buyer teams.
Preview the report firsthand - request a free sample
Get SampleGet the brochure for pricing and purchase details.
Get PDFTable of Content
- Key Takeaways
- Market Size and CAGR
- Top Growth Driver
- Fastest Growing Segment
- Leading Region
- Key Companies
- Emerging Opportunities
- Executive Summary
- Global Market Outlook
- Demand-side Trends
- Supply-side Trends
- Technology Roadmap Analysis
- Analysis and Recommendations
- Analyst Perspective (What is happening? Why now? What should investors know?)
- Key Questions Answered
- How large is the market?
- What is the CAGR?
- What are key trends?
- Which region dominates?
- Who are the leaders?
- Market Overview
- Market Coverage / Taxonomy
- Market Definition / Scope / Limitations
- Research Methodology
- Chapter Orientation
- Analytical Lens and Working Hypotheses
- Market Structure, Signals, and Trend Drivers
- Benchmarking and Cross-market Comparability
- Market Sizing, Forecasting, and Opportunity Mapping
- Research Design and Evidence Framework
- Desk Research Programme (Secondary Evidence)
- Expert Input and Fieldwork (Primary Evidence)
- Tooling, Models, and Reference Databases
- Data Engineering and Model Build
- Quality Assurance and Audit Trail
- Market Background
- Market Dynamics (Drivers, Restraints, Opportunity, Trends)
- Scenario Forecast (Optimistic, Likely, Conservative)
- Impact Analysis
- AI Impact
- Sustainability Impact
- Regulatory Impact
- Technology Impact
- Consumer / Buyer Analysis
- Purchase Drivers
- Adoption Barriers
- Buyer Journey
- Opportunity Map Analysis
- Product Life Cycle Analysis
- Supply Chain Analysis
- Investment Feasibility Matrix
- Value Chain Analysis
- PESTLE and Porter's Analysis
- Regulatory Landscape
- Regional Parent Market Outlook
- Production and Consumption Statistics
- Import and Export Statistics
- Global Market Analysis and Forecast, 2021 to 2036
- Historical Market Size Value (USD Million) & Volume (Unit) Analysis, 2021 to 2025
- Current and Future Market Size Value (USD Million) & Volume (Unit) Projections, 2026 to 2036
- Y-o-Y Growth Trend Analysis
- Absolute $ Opportunity Analysis
- Global Market Pricing Analysis, 2021 to 2036
- Global Market Analysis and Forecast, By Form, 2021 to 2036
- Introduction / Key Findings
- Historical Market Size Value (USD Million) & Volume (Unit) Analysis By Form, 2021 to 2025
- Current and Future Market Size Value (USD Million) & Volume (Unit) Analysis and Forecast By Form, 2026 to 2036
- Dry
- Liquid
- Pellet
- Premix
- Encapsulated
- Dry
- Y-o-Y Growth Trend Analysis By Form, 2021 to 2025
- Absolute $ Opportunity Analysis By Form, 2026 to 2036
- Global Market Analysis and Forecast, By Source, 2021 to 2036
- Introduction / Key Findings
- Historical Market Size Value (USD Million) & Volume (Unit) Analysis By Source, 2021 to 2025
- Current and Future Market Size Value (USD Million) & Volume (Unit) Analysis and Forecast By Source, 2026 to 2036
- Microbial
- Synthetic
- Plant-Botanical
- Mineral
- Yeast-based
- Microbial
- Y-o-Y Growth Trend Analysis By Source, 2021 to 2025
- Absolute $ Opportunity Analysis By Source, 2026 to 2036
- Global Market Analysis and Forecast, By Livestock, 2021 to 2036
- Introduction / Key Findings
- Historical Market Size Value (USD Million) & Volume (Unit) Analysis By Livestock, 2021 to 2025
- Current and Future Market Size Value (USD Million) & Volume (Unit) Analysis and Forecast By Livestock, 2026 to 2036
- Poultry
- Swine
- Ruminants
- Aquaculture
- Equine and pets
- Poultry
- Y-o-Y Growth Trend Analysis By Livestock, 2021 to 2025
- Absolute $ Opportunity Analysis By Livestock, 2026 to 2036
- Global Market Analysis and Forecast, By Function, 2021 to 2036
- Introduction / Key Findings
- Historical Market Size Value (USD Million) & Volume (Unit) Analysis By Function, 2021 to 2025
- Current and Future Market Size Value (USD Million) & Volume (Unit) Analysis and Forecast By Function, 2026 to 2036
- Gut health
- Growth performance
- Immunity
- Nutrient utilization
- Stress management
- Gut health
- Y-o-Y Growth Trend Analysis By Function, 2021 to 2025
- Absolute $ Opportunity Analysis By Function, 2026 to 2036
- Global Market Analysis and Forecast, By Region, 2021 to 2036
- Introduction
- Historical Market Size Value (USD Million) & Volume (Unit) Analysis By Region, 2021 to 2025
- Current Market Size Value (USD Million) & Volume (Unit) Analysis and Forecast By Region, 2026 to 2036
- North America
- Latin America
- Western Europe
- Eastern Europe
- East Asia
- South Asia and Pacific
- Middle East & Africa
- Market Attractiveness Analysis By Region
- North America Market Analysis and Forecast, By Country, 2021 to 2036
- Historical Market Size Value (USD Million) & Volume (Unit) Trend Analysis By Market Taxonomy, 2021 to 2025
- Market Size Value (USD Million) & Volume (Unit) Forecast By Market Taxonomy, 2026 to 2036
- By Country
- USA
- Canada
- Mexico
- By Form
- By Source
- By Livestock
- By Function
- By Country
- Market Attractiveness Analysis
- By Country
- By Form
- By Source
- By Livestock
- By Function
- Key Takeaways
- Latin America Market Analysis and Forecast, By Country
- Historical Market Size Value (USD Million) & Volume (Unit) Trend Analysis By Market Taxonomy, 2021 to 2025
- Market Size Value (USD Million) & Volume (Unit) Forecast By Market Taxonomy, 2026 to 2036
- By Country
- Brazil
- Chile
- Rest of Latin America
- By Form
- By Source
- By Livestock
- By Function
- By Country
- Market Attractiveness Analysis
- By Country
- By Form
- By Source
- By Livestock
- By Function
- Key Takeaways
- Western Europe Market Analysis and Forecast, By Country
- Historical Market Size Value (USD Million) & Volume (Unit) Trend Analysis By Market Taxonomy, 2021 to 2025
- Market Size Value (USD Million) & Volume (Unit) Forecast By Market Taxonomy, 2026 to 2036
- By Country
- Germany
- UK
- Italy
- Spain
- France
- Nordic
- BENELUX
- Rest of Western Europe
- By Form
- By Source
- By Livestock
- By Function
- By Country
- Market Attractiveness Analysis
- By Country
- By Form
- By Source
- By Livestock
- By Function
- Key Takeaways
- Eastern Europe Market Analysis and Forecast, By Country
- Historical Market Size Value (USD Million) & Volume (Unit) Trend Analysis By Market Taxonomy, 2021 to 2025
- Market Size Value (USD Million) & Volume (Unit) Forecast By Market Taxonomy, 2026 to 2036
- By Country
- Russia
- Poland
- Hungary
- Balkan & Baltic
- Rest of Eastern Europe
- By Form
- By Source
- By Livestock
- By Function
- By Country
- Market Attractiveness Analysis
- By Country
- By Form
- By Source
- By Livestock
- By Function
- Key Takeaways
- East Asia Market Analysis and Forecast, By Country
- Historical Market Size Value (USD Million) & Volume (Unit) Trend Analysis By Market Taxonomy, 2021 to 2025
- Market Size Value (USD Million) & Volume (Unit) Forecast By Market Taxonomy, 2026 to 2036
- By Country
- China
- Japan
- South Korea
- By Form
- By Source
- By Livestock
- By Function
- By Country
- Market Attractiveness Analysis
- By Country
- By Form
- By Source
- By Livestock
- By Function
- Key Takeaways
- South Asia and Pacific Market Analysis and Forecast, By Country
- Historical Market Size Value (USD Million) & Volume (Unit) Trend Analysis By Market Taxonomy, 2021 to 2025
- Market Size Value (USD Million) & Volume (Unit) Forecast By Market Taxonomy, 2026 to 2036
- By Country
- India
- ASEAN
- Australia & New Zealand
- Rest of South Asia and Pacific
- By Form
- By Source
- By Livestock
- By Function
- By Country
- Market Attractiveness Analysis
- By Country
- By Form
- By Source
- By Livestock
- By Function
- Key Takeaways
- Middle East & Africa Market Analysis and Forecast, By Country
- Historical Market Size Value (USD Million) & Volume (Unit) Trend Analysis By Market Taxonomy, 2021 to 2025
- Market Size Value (USD Million) & Volume (Unit) Forecast By Market Taxonomy, 2026 to 2036
- By Country
- Kingdom of Saudi Arabia
- Other GCC Countries
- Türkiye
- South Africa
- Other African Union
- Rest of Middle East & Africa
- By Form
- By Source
- By Livestock
- By Function
- By Country
- Market Attractiveness Analysis
- By Country
- By Form
- By Source
- By Livestock
- By Function
- Key Takeaways
- Key Countries Market Analysis
- USA
- Pricing Analysis
- Market Share Analysis, 2025
- By Form
- By Source
- By Livestock
- By Function
- Canada
- Pricing Analysis
- Market Share Analysis, 2025
- By Form
- By Source
- By Livestock
- By Function
- Mexico
- Pricing Analysis
- Market Share Analysis, 2025
- By Form
- By Source
- By Livestock
- By Function
- Brazil
- Pricing Analysis
- Market Share Analysis, 2025
- By Form
- By Source
- By Livestock
- By Function
- Chile
- Pricing Analysis
- Market Share Analysis, 2025
- By Form
- By Source
- By Livestock
- By Function
- Germany
- Pricing Analysis
- Market Share Analysis, 2025
- By Form
- By Source
- By Livestock
- By Function
- UK
- Pricing Analysis
- Market Share Analysis, 2025
- By Form
- By Source
- By Livestock
- By Function
- Italy
- Pricing Analysis
- Market Share Analysis, 2025
- By Form
- By Source
- By Livestock
- By Function
- Spain
- Pricing Analysis
- Market Share Analysis, 2025
- By Form
- By Source
- By Livestock
- By Function
- France
- Pricing Analysis
- Market Share Analysis, 2025
- By Form
- By Source
- By Livestock
- By Function
- India
- Pricing Analysis
- Market Share Analysis, 2025
- By Form
- By Source
- By Livestock
- By Function
- ASEAN
- Pricing Analysis
- Market Share Analysis, 2025
- By Form
- By Source
- By Livestock
- By Function
- Australia & New Zealand
- Pricing Analysis
- Market Share Analysis, 2025
- By Form
- By Source
- By Livestock
- By Function
- China
- Pricing Analysis
- Market Share Analysis, 2025
- By Form
- By Source
- By Livestock
- By Function
- Japan
- Pricing Analysis
- Market Share Analysis, 2025
- By Form
- By Source
- By Livestock
- By Function
- South Korea
- Pricing Analysis
- Market Share Analysis, 2025
- By Form
- By Source
- By Livestock
- By Function
- Russia
- Pricing Analysis
- Market Share Analysis, 2025
- By Form
- By Source
- By Livestock
- By Function
- Poland
- Pricing Analysis
- Market Share Analysis, 2025
- By Form
- By Source
- By Livestock
- By Function
- Hungary
- Pricing Analysis
- Market Share Analysis, 2025
- By Form
- By Source
- By Livestock
- By Function
- Kingdom of Saudi Arabia
- Pricing Analysis
- Market Share Analysis, 2025
- By Form
- By Source
- By Livestock
- By Function
- Türkiye
- Pricing Analysis
- Market Share Analysis, 2025
- By Form
- By Source
- By Livestock
- By Function
- South Africa
- Pricing Analysis
- Market Share Analysis, 2025
- By Form
- By Source
- By Livestock
- By Function
- USA
- Market Structure Analysis
- Competition Dashboard
- Competition Benchmarking
- Market Share Analysis of Top Players
- By Regional
- By Form
- By Source
- By Livestock
- By Function
- Emerging Startups
- Innovation Benchmarking
- Competition Analysis
- Competition Deep Dive
- Perstorp
- Overview
- Product Portfolio
- Profitability by Market Segments (Product/Region/Sales Channel)
- Sales Footprint
- Strategy Overview
- Marketing Strategy
- Product Strategy
- Channel Strategy
- BASF
- Addcon
- Cargill
- ADM
- Trouw Nutrition (Nutreco)
- Kemin Industries
- Alltech
- Adisseo
- Perstorp
- Case Studies
- Success Stories
- Recent Developments
- Competition Deep Dive
- Assumptions & Acronyms Used


