Antimicrobial Feed Additives Market Size and Share Forecast Outlook 2025 to 2035

The Antimicrobial Feed Additives Market is expected to record a valuation of USD 3,640.0 million in 2025 and USD 6,515.9 million in 2035, with an increase of USD 2,875.9 million, which equals a growth of nearly 79% over the decade. The overall expansion represents a CAGR of 6.0% and a 2X increase in market size.
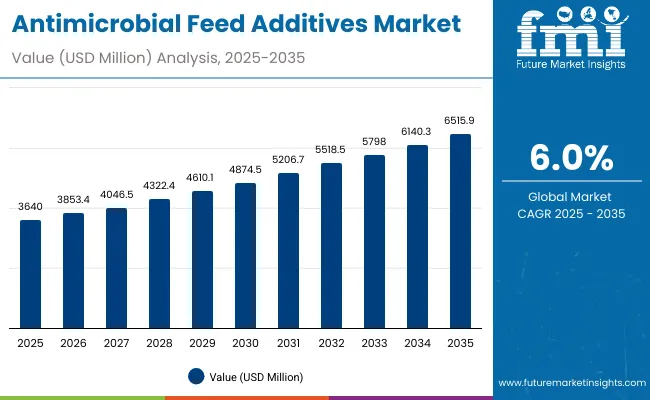
Quick Stats for Antimicrobial Feed Additives Market

  • Antimicrobial Feed Additives Market Value (2025): USD 3,640.0 million
  • Antimicrobial Feed Additives Market Forecast Value (2035): USD 6,515.9 million
  • Antimicrobial Feed Additives Market Forecast CAGR: 6.0%
  • Leading Segment in Antimicrobial Feed Additives Market in 2025: Acidifiers (24.9%) Key Growth Regions in the Antimicrobial Feed Additives Market: South Asia, Europe, East Asia
  • Top Key Players in Antimicrobial Feed Additives Market: Cargill, ADM, DSM-Firmenich, Elanco, Zoetis, Bayer, Kemin, Alltech, Novus International, Chr. Hansen, Phibro, Evonik, Nutreco, Adisseo, Biomin

Antimicrobial Feed Additives Market

Antimicrobial Feed Additives Market Key Takeaways

Metric Value
Global Market Estimated Value (2025E) USD 3,640.0 million
Global Market Forecast Value (2035F) USD 6,515.9 million
Forecast CAGR (2025 to 2035) 6.0%

During the first five-year period from 2025 to 2030, the market increases from USD 3,640.0 million to USD 4,874.5 million, adding USD 1,234.5 million, which accounts for 43% of the total decade growth. This phase records steady adoption in poultry, swine, and aquaculture nutrition, driven by rising concerns over disease resistance, productivity enhancement, and regulatory transitions reducing antibiotics. Acidifiers and probiotics dominate this period as they cater to over 45% of applications requiring safe and compliant alternatives to antibiotics.

The second half from 2030 to 2035 contributes USD 1,641.4 million, equal to 57% of total growth, as the market jumps from USD 4,874.5 million to USD 6,515.9 million. This acceleration is powered by widespread deployment of phytogenics, probiotics, and enzyme-based additives, aligning with global regulatory frameworks and consumer demand for antibiotic-free meat and dairy. Aquaculture and pet feed segments gain pace in this period, supported by rising aquafeed innovation and premiumization of companion animal diets. By the end of the decade, phytogenics and probiotics together capture a larger share above 35% of the market. Liquid formulations gain momentum due to higher bioavailability, lifting their share beyond 27% of total value by 2035.

From 2020 to 2024, the Antimicrobial Feed Additives Market expanded steadily from a hardware-style antibiotics-driven market to a diversified landscape with probiotics, acidifiers, and phytogenics gaining traction. During this period, the competitive landscape was dominated by multinational feed additive suppliers controlling nearly 70% of revenue, with leaders such as Cargill, DSM-Firmenich, and Evonik focusing on integrated feed solutions for livestock. Differentiation relied on cost efficiency, proven efficacy, and regulatory adaptability, while probiotics and prebiotics were often bundled with enzyme packages rather than a primary revenue stream. Service-based nutrition consulting had minimal traction, contributing less than 10% of the total market value.

Demand for antimicrobial feed additives will expand to USD 3,640.0 million in 2025, and the revenue mix will shift as probiotics, phytogenics, and acidifiers grow to over 60% share. Traditional antibiotic leaders face rising competition from plant-extract players, probiotic innovators, and organic acid producers offering customized formulations and integrated programs. Major feed additive vendors are pivoting to hybrid models, integrating digital feed formulation platforms, gut health analytics, and sustainability certification to retain relevance. Emerging entrants specializing in essential oil blends, bacteriophage applications, and peptide-based antimicrobials are gaining share. The competitive advantage is moving away from antibiotic efficacy alone to ecosystem strength, compliance, and recurring contracts with integrators.

Why the Antimicrobial Feed Additives Market is Growing?

Advances in acidifiers, phytogenics, and enzyme-based feed technologies have improved efficiency and pathogen resistance management, allowing more effective replacement of antibiotics. Acidifiers have gained popularity due to their suitability for gut health management, pathogen inhibition, and improved feed conversion ratios. The rise of organic acids and essential oils has contributed to enhanced productivity while meeting consumer preferences for sustainable, antibiotic-free meat and dairy. Industries such as poultry, swine, and aquaculture are driving demand for antimicrobial feed solutions that integrate seamlessly into existing feeding systems.

Expansion of automated feed formulation, precision livestock farming, and antibiotic-reduction policies has fueled market growth. Innovations in probiotics, prebiotics, and enzyme blends, along with synergistic combinations of acidifiers and plant extracts, are expected to open new application areas. Segment growth is expected to be led by acidifiers in type categories, poultry in livestock, and liquid formulations in delivery, due to their adaptability and compliance with regulations across major markets.

Segmental Analysis

The market is segmented by type, livestock, form, distribution channel, and region. Types include antibiotics, acidifiers, enzyme-based additives, probiotics & prebiotics, phytogenics, and others, highlighting the diverse portfolio of antimicrobial strategies. Livestock classification covers poultry, swine, ruminants, aquaculture, and pets to cater to different nutritional requirements. Based on form, the segmentation includes dry premixes and liquid formulations, balancing cost-effectiveness and bioavailability. Distribution channels span direct sales (B2B to feed manufacturers and integrators), distributors/wholesalers, and online platforms, reflecting evolving procurement models. Regionally, the scope spans North America, Latin America, Europe, East Asia, South Asia & Pacific, and the Middle East & Africa.
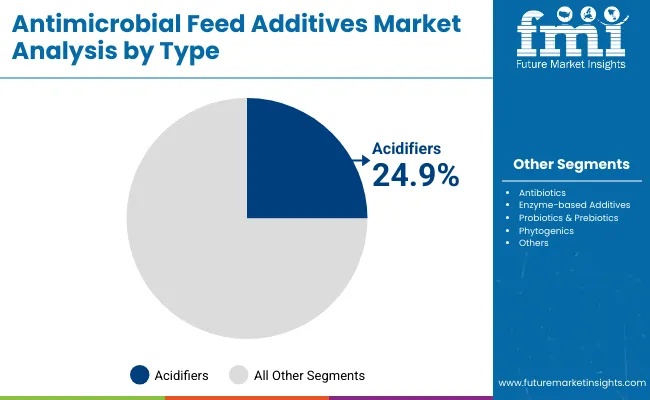
Insights into the Type Segment with Acidifiers Leading in Market Share

Antimicrobial Feed Additives Market By Type

Type Market Value Share (%)
Acidifiers 24.9%
Others 75.1%

The acidifiers segment is projected to contribute 24.9% of the Antimicrobial Feed Additives Market revenue in 2025, maintaining its lead as the dominant type category. This is driven by ongoing demand for organic and inorganic acids that effectively improve digestive health, nutrient absorption, and pathogen inhibition in poultry and swine. Acidifiers are prioritized by feed manufacturers as reliable antibiotic alternatives that deliver consistent performance without regulatory hurdles.

The segment’s growth is also supported by the development of blended acidifier solutions that enhance stability and improve gut microbiota modulation. As antibiotic bans and restrictions intensify across Europe, North America, and Asia-Pacific, acidifier manufacturers are enhancing portfolios with next-generation synergistic formulations combining acids with phytogenics and probiotics.

While acidifiers dominate, other categories such as probiotics & prebiotics (20.0%) and phytogenics (15.0%) are rapidly expanding, reflecting the market’s shift toward holistic gut health management and natural alternatives. Antibiotics, although still holding a 20.1% share, are on a declining growth trajectory with just 1.5% CAGR, underscoring the structural transformation of the industry.
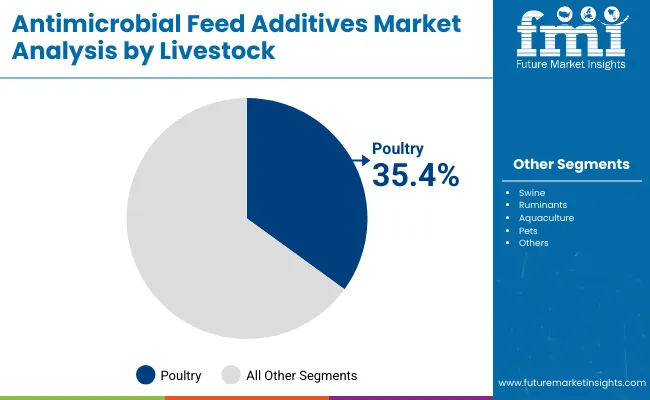
Insights into the Livestock Segment with Poultry Dominating the Demand

Antimicrobial Feed Additives Market By Livestock

Livestock Market Value Share (%)
Poultry 35.4%
Others 64.6%

The poultry segment is forecasted to hold 35.4% of the market share in 2025, led by its high demand for antimicrobial feed additives to improve feed conversion ratios, disease resistance, and growth performance. Poultry production particularly broilers and layers relies heavily on acidifiers, probiotics, and enzyme blends to ensure flock health under intensive farming conditions.

Other categories include swine (24.6%), supported by gut health strategies to counter post-weaning diarrhea; ruminants (20.0%), focusing on rumen fermentation stability; aquaculture (12.0%), which is the fastest growing at 8.0% CAGR; pets (5.0%), driven by premium pet nutrition; and others (3.0%), including minor livestock categories. Together, these segments underscore poultry’s role as the largest consumer, but highlight aquaculture and pets as fast-emerging growth pockets.
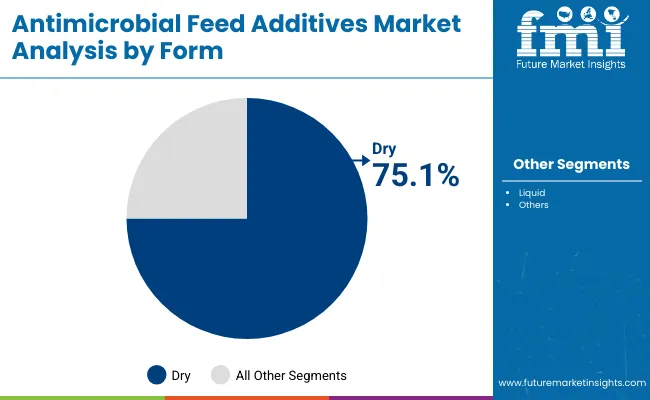
Insights into the Form Segment with Dry Premixes Leading in Market Share

Antimicrobial Feed Additives Market By Form

Form Market Value Share (%)
Dry 75.1%
Others 24.6%

The dry form segment is projected to contribute 75.1% of the Antimicrobial Feed Additives Market revenue in 2025, maintaining its dominance due to the ease of handling, stability, and suitability for premixes and bulk feed manufacturing. Dry forms such as powders and premixes are cost-effective and preferred by integrators for large-scale feed applications.

In contrast, liquid formulations (24.9%) are gaining share at a faster CAGR of 6.8%, driven by their higher bioavailability, easier dosing in water systems, and adaptability in aquaculture and pet feed. By 2035, liquid formulations are expected to exceed 27% of the global market value, signaling their growing role in specialized nutrition strategies.

What are the Drivers, Restraints, and Key Trends of the Antimicrobial Feed Additives Market?

Growing regulatory restrictions on antibiotics, coupled with rising livestock disease burdens and consumer demand for antibiotic-free animal products, are shaping the Antimicrobial Feed Additives Market. While the industry is moving toward probiotics, phytogenics, and acidifiers, challenges persist in cost structures and inconsistent performance across geographies. These factors define the market’s momentum, where compliance, innovation, and integration into livestock farming systems dictate adoption.

Drivers

Rising Demand for Antibiotic Alternatives in Poultry and Swine

The poultry and swine industries together accounting for more than 60% of global demand are increasingly dependent on antimicrobial feed additives such as acidifiers and probiotics. Regulatory bans in Europe and pressure in North America and Asia-Pacific to curb antibiotic use have accelerated adoption of alternatives that ensure gut health and reduce mortality. Probiotics and phytogenics are seeing strong uptake, supported by poultry integrators’ need to deliver consistent weight gain and meat quality under intensive farming conditions.

Expansion of Aquaculture and Premium Pet Nutrition

Aquaculture is emerging as one of the fastest-growing livestock categories, posting an 8% CAGR, with antimicrobial feed solutions critical for disease management in high-density farming. Concurrently, premiumization in the pet food sector is boosting demand for safe, functional additives. Pet owners prefer antibiotic-free formulations enhanced with probiotics, prebiotics, and natural extracts. This dual growth in aquaculture and pet nutrition expands market scope beyond traditional livestock and offers suppliers opportunities to diversify portfolios.

Restraints

Cost Volatility of Specialty Ingredients and Formulations

Phytogenics, probiotics, and enzyme-based additives often rely on high-quality raw materials such as essential oils, proprietary microbial strains, and advanced fermentation processes. Their production costs fluctuate due to agricultural volatility and complex manufacturing. As a result, small and mid-sized feed producers face pricing barriers, limiting large-scale adoption, especially in cost-sensitive markets like Latin America and parts of Asia.

Performance Variability Across Geographies

Unlike antibiotics, whose outcomes are predictable, the efficacy of acidifiers, phytogenics, and probiotics varies with feed composition, climate conditions, and livestock genetics. For example, certain probiotic strains may deliver measurable benefits in European poultry farms but show inconsistent results in tropical conditions. This variability creates hesitancy among integrators and farmers, who are wary of investing in solutions without guaranteed returns, slowing penetration in emerging markets.

Key Trends

Synergistic Blends and Customized Formulations

Suppliers are increasingly combining acidifiers, probiotics, and phytogenics into synergistic blends tailored for specific livestock species and farm conditions. These customized formulations improve consistency of outcomes and align with precision livestock farming systems. Companies like DSM-Firmenich and Adisseo are developing integrated gut health packages, ensuring broader adoption among feed manufacturers and integrators.

Digital Integration and Data-Backed Validation

The use of digital tools for feed formulation, microbiome analysis, and additive efficacy tracking is accelerating. Precision livestock farming technologies are enabling real-time monitoring of gut health, allowing validation of additive performance. This trend supports adoption by providing measurable outcomes, reducing skepticism, and creating recurring opportunities for suppliers offering data-backed antimicrobial solutions.
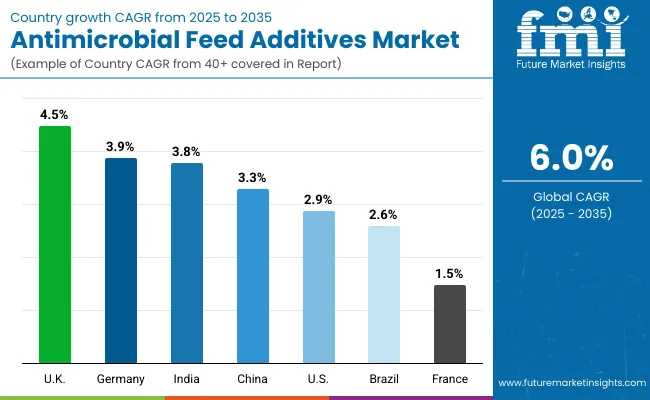
Analysis of Antimicrobial Feed Additives Market By Key Countries

Antimicrobial Feed Additives Market By Country

Countries CAGR (2025 to 2035)
China 3.3%
India 3.8%
Germany 3.9%
France 1.5%
UK 4.5%
USA 2.9%
Brazil 2.6%

The Antimicrobial Feed Additives Market shows a pronounced regional disparity in adoption speed, strongly influenced by livestock density, feed production modernization, and regulatory mandates on antibiotic alternatives.

South Asia emerges as the fastest-growing region, anchored by India at 3.8% CAGR, supported by a large poultry and aquaculture ecosystem and government-backed initiatives for livestock disease management. East Asia is shaped by China at 3.3% CAGR, where regulatory tightening and productivity enhancement drive consistent demand.

Europe maintains a strong growth profile, led by Germany (3.9%), France (1.5%), and the UK (4.5%), reflecting the region’s long-standing leadership in animal nutrition compliance and innovation. Adoption is boosted by stringent EU bans on antibiotic growth promoters, compelling feed manufacturers to integrate acidifiers, probiotics, and phytogenics. North America shows moderate expansion, with the USA at 2.9% CAGR, reflecting maturity in poultry and swine systems but facing slower regulatory-driven shifts compared to Europe and Asia.

Growth in North America is increasingly service-oriented, with feed integrators favoring bundle-based nutrition programs combining additives with consultancy and digital feed formulation platforms.
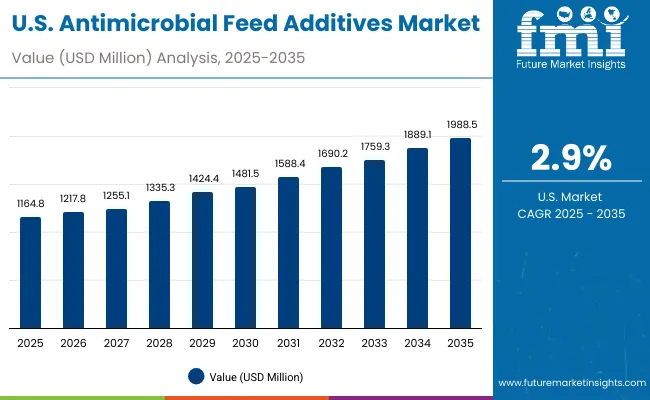
Sales Outlook for Antimicrobial Feed Additives in the United States

Antimicrobial Feed Additives Market Usa

Year USA Antimicrobial Feed Additives Market (USD Million)
2025 1,164.8
2026 1,217.8
2027 1,255.1
2028 1,335.3
2029 1,424.4
2030 1,481.5
2031 1,588.4
2032 1,690.2
2033 1,759.3
2034 1,889.1
2035 1,988.5

The Antimicrobial Feed Additives Market in the United States is projected to grow at a CAGR of 5.5%, led by consistent demand from the poultry and swine industries. Acidifiers dominate adoption, while probiotics and enzyme-based additives are expanding due to antibiotic restrictions. Growth is reinforced by strong integrator systems where bundled nutrition programs ensure scale-driven procurement. Pet feed applications are also gaining traction as premium brands integrate probiotics and phytogenics.

  • Poultry integrators are the largest users, relying heavily on acidifiers and probiotics.
  • Swine producers emphasize enzyme-based solutions for gut stability.
  • Premium pet food manufacturers adopt phytogenics for natural health positioning.

Growth and Expansion Outlook for Antimicrobial Feed Additives Market in the United Kingdom

The Antimicrobial Feed Additives Market in the United Kingdom is expected to grow at a CAGR of 4.5%, supported by applications across poultry and ruminant sectors. Integrators are focusing on compliance-driven feed formulations, with probiotics and phytogenics gaining strong adoption. The pet food segment is particularly dynamic in the UK, leveraging premium formulations that incorporate natural antimicrobials. Government support for antibiotic reduction and sustainability goals is further fueling innovation.

  • Poultry feed formulations are increasingly integrating probiotics and acidifiers.
  • Ruminant producers are adopting enzyme-based blends to optimize feed efficiency.
  • Pet food manufacturers highlight phytogenics as "clean-label" antimicrobial solutions.

Growth and Expansion Outlook for Antimicrobial Feed Additives Market in India

India is witnessing rapid growth in the Antimicrobial Feed Additives Market, forecast to expand at a CAGR of 3.8% through 2035. Poultry, which consumes the largest volume of feed additives, drives the bulk of demand, while aquaculture is emerging as the fastest-growing sector. Government initiatives to promote disease control, combined with rising consumer demand for antibiotic-free meat, support adoption. Educational institutes and veterinary training centers are increasingly promoting awareness of safe feed additive usage.

  • Poultry integrators adopt acidifiers and probiotics to combat disease challenges.
  • Aquaculture producers rely on enzyme blends and phytogenics for waterborne pathogen control.
  • Pet nutrition adoption is rising in urban centers, creating niche but high-value demand.

Sales Outlook for Antimicrobial Feed Additives in China

The Antimicrobial Feed Additives Market in China is expected to grow at a CAGR of 3.3%, reflecting regulatory-led transformation of its large livestock sector. The government’s ban on antibiotic growth promoters has accelerated adoption of probiotics, phytogenics, and acidifiers. Poultry and swine remain the largest consumers, while aquaculture is steadily growing as China expands inland fish farming. Local manufacturers are introducing affordable additive blends to penetrate small and mid-scale farms.
  • Poultry and swine integrators dominate additive consumption.
  • Aquaculture additives grow with inland fish production expansion.
  • Domestic brands focus on cost-effective blends for mass-market adoption.

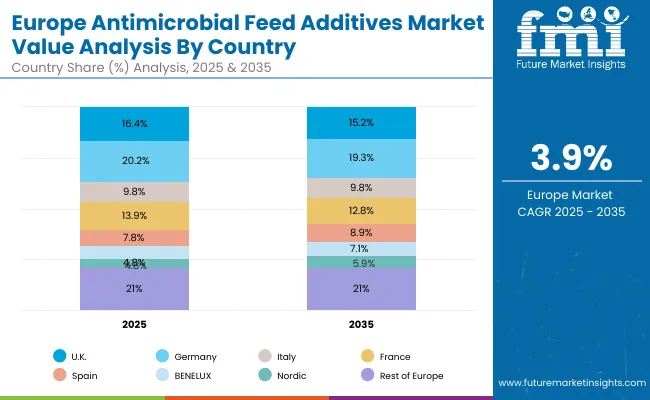
In-depth Analysis of Antimicrobial Feed Additives Market in Germany

Antimicrobial Feed Additives Market Europe

Countries / Sub-region 2025
UK 16.4%
Germany 20.2%
Italy 9.8%
France 13.9%
Spain 7.8%
BENELUX 6.1%
Nordic 4.8%
Rest of Europe 21.0%
Countries / Sub-region 2035
UK 15.2%
Germany 19.3%
Italy 9.8%
France 12.8%
Spain 8.9%
BENELUX 7.1%
Nordic 5.9%
Rest of Europe 21.0%

The Antimicrobial Feed Additives Market in Germany is projected to grow at a CAGR of 3.9%, underpinned by its leadership in precision animal nutrition and strict EU compliance frameworks. Feed mills and integrators in Germany are integrating phytogenics, probiotics, and enzyme blends into standard formulations. Regulatory frameworks mandate the elimination of antibiotic growth promoters, reinforcing consistent additive adoption. Collectively, the European market reflects its position as the largest global region with sustained growth in antibiotic alternatives.
  • Poultry feed remains the primary driver of additive adoption.
  • Dairy producers focus on enzyme and acidifier integration for milk yield stability.
  • Sustainability and clean-label pressures accelerate phytogenic demand.

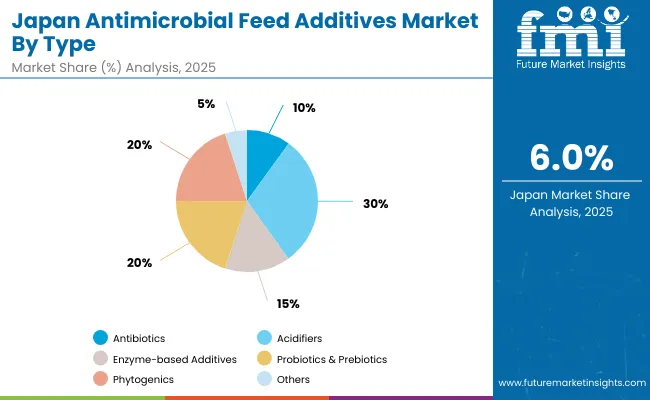
Growth Outlook for Antimicrobial Feed Additives Market in Japan

Antimicrobial Feed Additives Market Japan

Type Market Value Share (%)
Acidifiers 30.1%
Others 69.9%

The Antimicrobial Feed Additives Market in Japan is projected at USD 195.8 million in 2025, growing to USD 350.4 million by 2035 at a 6.0% CAGR. Acidifiers lead the market with 30.1% share, reflecting their importance in poultry and aquaculture feed. Probiotics and phytogenics each contribute 20%, while enzyme-based additives hold 14.9%. Antibiotics, at 10%, are on a declining trajectory. The shift toward acidifiers and probiotics stems from Japan’s emphasis on food safety, premium meat quality, and regulatory compliance. Advanced aquaculture systems and premium pet food brands are adopting synergistic formulations blending probiotics with essential oils.
  • Acidifiers dominate additive use, especially in poultry and aquaculture.
  • Probiotics and phytogenics collectively exceed 40%, signaling natural product preference.
  • Antibiotic reliance declines under government food safety mandates.

Opportunity Analysis of Antimicrobial Feed Additives Market in South Korea

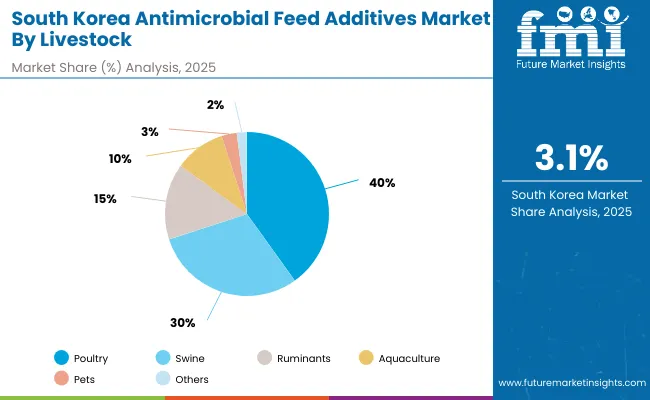
Antimicrobial Feed Additives Market South Korea

Livestock Market Value Share (%)
Poultry 40.1%
Others 59.9%

The Antimicrobial Feed Additives Market in South Korea is valued at USD 113.8 million in 2025, growing to USD 154.9 million by 2035 at a CAGR of 3.1%. Poultry dominates with 40.1% share, followed by swine at 29.9%, ruminants at 15%, aquaculture at 10%, pets at 3%, and others at 2%.The dominance of poultry is linked to South Korea’s intensive production systems where feed conversion efficiency is critical. Acidifiers, probiotics, and enzyme-based solutions are heavily used to improve flock health. Swine remains the second-largest segment, where additives support gut stability in post-weaning pigs.
  • Poultry integrators drive large-scale additive use for disease management.
  • Swine producers rely on enzyme and acidifier blends.
  • Aquaculture adoption is expanding with the growth of marine fish farming.

Competitive Landscape of Antimicrobial Feed Additives Market

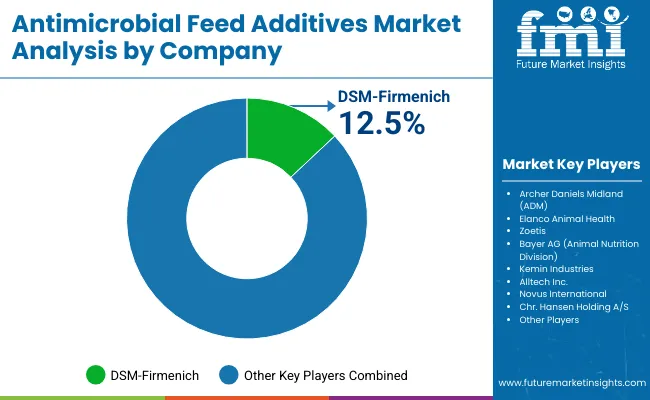
Antimicrobial Feed Additives Market By Company

Company Global Value Share 2025
DSM- Firmenich 12.5%
Others 87.5%

The Antimicrobial Feed Additives Market is moderately fragmented, with global leaders, mid-sized innovators, and specialized nutrition companies competing across diverse livestock and regional markets. Global nutrition leaders such as DSM-Firmenich, Cargill, and Evonik Industries hold significant market share, driven by extensive portfolios in probiotics, acidifiers, and enzyme-based solutions. DSM-Firmenich leads the global market with 12.5% share in 2025, leveraging its integrated brand presence (Biomin, ROVIMIX, and other specialized lines) and strong R&D capabilities. These companies focus on antibiotic alternatives, sustainability certifications, and bundled additive programs for poultry, swine, and aquaculture feed integrators.

Established mid-sized players, including Kemin Industries, Alltech, and Novus International, cater to rising demand for phytogenics, probiotics, and customized blends. Their strength lies in providing portable, farm-ready solutions with proven gut health outcomes. By combining enzyme technologies with organic acids and essential oils, they have accelerated adoption among integrators seeking natural but performance-driven feed strategies.

Specialized providers such as Adisseo, Phibro Animal Health, and Nutreco’sTrouw Nutrition division focus on targeted antimicrobial applications, including aquaculture health, ruminant feed efficiency, and precision nutrition platforms. These players emphasize regional adaptability and niche product innovation, offering tailored formulations to meet the varying requirements of Europe, Asia-Pacific, and Latin America.

Competitive differentiation in the Antimicrobial Feed Additives Market is shifting away from individual product categories toward integrated solutions combining feed additives, digital formulation platforms, and technical support services. Ecosystem strategies such as microbiome analytics, data-backed efficacy trials, and subscription-based nutrition programs are becoming decisive for long-term customer retention and global expansion.

Key Developments in Antimicrobial Feed Additives Market

  • On January 12, 2025, DSM-Firmenich launched its next-generation Biomin® Synbiotic AquaCare, a synergistic blend of probiotics and prebiotics designed to reduce pathogen load in shrimp aquaculture. The launch strengthens DSM’s leadership in functional aquafeed additives.
  • On February 28, 2025, Cargill, Inc. announced the commissioning of its new acidifier production facility in Kansas, USA, aimed at securing a local supply chain for poultry and swine feed integrators. The investment was positioned as a strategic response to growing USA demand for antibiotic alternatives.

Scope of the Report

Item Value
Quantitative Units USD 3,640.0 million
Type Antibiotics, Acidifiers, Enzyme-based Additives, Probiotics & Prebiotics, Phytogenics, and Others (bacteriophages, peptides, novel antimicrobials)
Livestock Poultry, Swine, Ruminants (cattle, sheep, goats), Aquaculture, Pets/Companion Animals, and Others
Form Dry (powders, premixes) and Liquid
Distribution Channel Direct Sales (B2B with feed manufacturers and integrators), Distributors/Wholesalers, and Online Platforms
Regions Covered North America, Europe, East Asia, South Asia & Pacific, Latin America, and Middle East & Africa
Countries Covered United States, Canada, Germany, France, United Kingdom, China, Japan, India, Brazil, South Korea
Key Companies Profiled DSM- Firmenich, Cargill, Inc., Archer Daniels Midland (ADM), Elanco Animal Health, Zoetis, Bayer AG (Animal Nutrition Division), Kemin Industries, Alltech Inc., Novus International, Chr. Hansen Holding A/S, Phibro Animal Health Corporation, Evonik Industries AG, Nutreco N.V. (Trouw Nutrition), Adisseo (Bluestar Adisseo), and Biomin (part of DSM- Firmenich)
Additional Attributes Dollar sales by type, livestock, and form; adoption trends in poultry, swine, and aquaculture; rising demand for probiotics and phytogenics as antibiotic alternatives; growth in liquid formulations; distribution channel transformation with B2B dominance; sector-specific growth in poultry integrators, aquaculture, and premium pet food; regional trends shaped by antibiotic bans in Europe, regulatory tightening in Asia, and integrator-driven adoption in North America; innovations in synergistic blends, acidifier-phytogenic combinations, and data-backed probiotic efficacy.

Key Segments

By Type:

  • Antibiotics (regulated/restricted use)
  • Acidifiers (organic acids, inorganic acids)
  • Enzyme-based Additives
  • Probiotics & Prebiotics
  • Phytogenics (essential oils, plant extracts)
  • Others (e.g., bacteriophages, peptides, novel antimicrobials)

By Livestock:

  • Poultry
  • Swine
  • Ruminants (cattle, sheep, goats)
  • Aquaculture
  • Pets/Companion Animals
  • Others

By Form:

  • Dry (powders, premixes)
  • Liquid

By Distribution Channel:

  • Direct Sales (B2B, feed manufacturers, integrators)
  • Distributors/Wholesalers
  • Online Platforms

By Region:

  • North America
  • Latin America
  • Europe
  • East Asia
  • South Asia & Pacific
  • Middle East and Africa

Table of Content

  1. Executive Summary
    • Global Market Outlook
    • Demand-side Trends
    • Supply-side Trends
    • Technology Roadmap Analysis
    • Analysis and Recommendations
  2. Market Overview
    • Market Coverage / Taxonomy
    • Market Definition / Scope / Limitations
  3. Market Background
    • Market Dynamics
      • Drivers
      • Restraints
      • Opportunity
      • Trends
    • Scenario Forecast
      • Demand in Optimistic Scenario
      • Demand in Likely Scenario
      • Demand in Conservative Scenario
    • Opportunity Map Analysis
    • Product Life Cycle Analysis
    • Supply Chain Analysis
      • Supply Side Participants and their Roles
        • Producers
        • Mid-Level Participants (Traders/ Agents/ Brokers)
        • Wholesalers and Distributors
      • Value Added and Value Created at Node in the Supply Chain
      • List of Raw Material Suppliers
      • List of Existing and Potential Buyer’s
    • Investment Feasibility Matrix
    • Value Chain Analysis
      • Profit Margin Analysis
      • Wholesalers and Distributors
      • Retailers
    • PESTLE and Porter’s Analysis
    • Regulatory Landscape
      • By Key Regions
      • By Key Countries
    • Regional Parent Market Outlook
    • Production and Consumption Statistics
    • Import and Export Statistics
  4. Global Market Analysis 2020 to 2024 and Forecast, 2025 to 2035
    • Historical Market Size Value (USD Million) & Volume (Units) Analysis, 2020 to 2024
    • Current and Future Market Size Value (USD Million) & Volume (Units) Projections, 2025 to 2035
      • Y-o-Y Growth Trend Analysis
      • Absolute $ Opportunity Analysis
  5. Global Market Analysis 2020 to 2024 and Forecast 2025 to 2035, By Type
    • Introduction / Key Findings
    • Historical Market Size Value (USD Million) & Volume (Units) Analysis By Type, 2020 to 2024
    • Current and Future Market Size Value (USD Million) & Volume (Units) Analysis and Forecast By Type, 2025 to 2035
      • Antibiotics (regulated/restricted use)
      • Acidifiers (organic acids, inorganic acids)
      • Enzyme-based Additives
      • Probiotics & Prebiotics
      • Phytogenics (essential oils, plant extracts)
      • Others (e.g., bacteriophages, peptides, novel antimicrobials)
    • Y-o-Y Growth Trend Analysis By Type, 2020 to 2024
    • Absolute $ Opportunity Analysis By Type, 2025 to 2035
  6. Global Market Analysis 2020 to 2024 and Forecast 2025 to 2035, By Livestock
    • Introduction / Key Findings
    • Historical Market Size Value (USD Million) & Volume (Units) Analysis By Livestock, 2020 to 2024
    • Current and Future Market Size Value (USD Million) & Volume (Units) Analysis and Forecast By Livestock, 2025 to 2035
      • Poultry
      • Swine
      • Ruminants (cattle, sheep, goats)
      • Aquaculture
      • Pets/Companion Animals
      • Others
    • Y-o-Y Growth Trend Analysis By Livestock, 2020 to 2024
    • Absolute $ Opportunity Analysis By Livestock, 2025 to 2035
  7. Global Market Analysis 2020 to 2024 and Forecast 2025 to 2035, By Form
    • Introduction / Key Findings
    • Historical Market Size Value (USD Million) & Volume (Units) Analysis By Form, 2020 to 2024
    • Current and Future Market Size Value (USD Million) & Volume (Units) Analysis and Forecast By Form, 2025 to 2035
      • Dry (powders, premixes)
      • Liquid
    • Y-o-Y Growth Trend Analysis By Form, 2020 to 2024
    • Absolute $ Opportunity Analysis By Form, 2025 to 2035
  8. Global Market Analysis 2020 to 2024 and Forecast 2025 to 2035, By Distribution Channel
    • Introduction / Key Findings
    • Historical Market Size Value (USD Million) & Volume (Units) Analysis By Distribution Channel, 2020 to 2024
    • Current and Future Market Size Value (USD Million) & Volume (Units) Analysis and Forecast By Distribution Channel, 2025 to 2035
      • Direct Sales (B2B, feed manufacturers, integrators)
      • Distributors/Wholesalers
      • Online Platforms
    • Y-o-Y Growth Trend Analysis By Distribution Channel, 2020 to 2024
    • Absolute $ Opportunity Analysis By Distribution Channel, 2025 to 2035
  9. Global Market Analysis 2020 to 2024 and Forecast 2025 to 2035, By Region
    • Introduction
    • Historical Market Size Value (USD Million) & Volume (Units) Analysis By Region, 2020 to 2024
    • Current Market Size Value (USD Million) & Volume (Units) Analysis and Forecast By Region, 2025 to 2035
      • North America
      • Latin America
      • Europe
      • East Asia
      • South Asia & Pacific
      • Middle East and Africa
    • Market Attractiveness Analysis By Region
  10. North America Market Analysis 2020 to 2024 and Forecast 2025 to 2035, By Country
    • Historical Market Size Value (USD Million) & Volume (Units) Trend Analysis By Market Taxonomy, 2020 to 2024
    • Market Size Value (USD Million) & Volume (Units) Forecast By Market Taxonomy, 2025 to 2035
      • By Country
        • USA
        • Canada
      • By Type
      • By Livestock
      • By Form
      • By Distribution Channel
    • Market Attractiveness Analysis
      • By Country
      • By Type
      • By Livestock
      • By Form
      • By Distribution Channel
    • Key Takeaways
  11. Latin America Market Analysis 2020 to 2024 and Forecast 2025 to 2035, By Country
    • Historical Market Size Value (USD Million) & Volume (Units) Trend Analysis By Market Taxonomy, 2020 to 2024
    • Market Size Value (USD Million) & Volume (Units) Forecast By Market Taxonomy, 2025 to 2035
      • By Country
        • Brazil
        • Mexico
        • Colombia
        • Rest of Latin America
      • By Type
      • By Livestock
      • By Form
      • By Distribution Channel
    • Market Attractiveness Analysis
      • By Country
      • By Type
      • By Livestock
      • By Form
      • By Distribution Channel
    • Key Takeaways
  12. Europe Market Analysis 2020 to 2024 and Forecast 2025 to 2035, By Country
    • Historical Market Size Value (USD Million) & Volume (Units) Trend Analysis By Market Taxonomy, 2020 to 2024
    • Market Size Value (USD Million) & Volume (Units) Forecast By Market Taxonomy, 2025 to 2035
      • By Country
        • Germany
        • UK
        • France
        • Italy
        • Spain
        • Belgium
        • Netherlands
        • Nordic
        • Switzerland
        • Russia
        • Poland
        • Rest of Europe
      • By Type
      • By Livestock
      • By Form
      • By Distribution Channel
    • Market Attractiveness Analysis
      • By Country
      • By Type
      • By Livestock
      • By Form
      • By Distribution Channel
    • Key Takeaways
  13. East Asia Market Analysis 2020 to 2024 and Forecast 2025 to 2035, By Country
    • Historical Market Size Value (USD Million) & Volume (Units) Trend Analysis By Market Taxonomy, 2020 to 2024
    • Market Size Value (USD Million) & Volume (Units) Forecast By Market Taxonomy, 2025 to 2035
      • By Country
        • China
        • Japan
        • South Korea
      • By Type
      • By Livestock
      • By Form
      • By Distribution Channel
    • Market Attractiveness Analysis
      • By Country
      • By Type
      • By Livestock
      • By Form
      • By Distribution Channel
    • Key Takeaways
  14. South Asia & Pacific Market Analysis 2020 to 2024 and Forecast 2025 to 2035, By Country
    • Historical Market Size Value (USD Million) & Volume (Units) Trend Analysis By Market Taxonomy, 2020 to 2024
    • Market Size Value (USD Million) & Volume (Units) Forecast By Market Taxonomy, 2025 to 2035
      • By Country
        • India
        • Thailand
        • Malaysia
        • Indonesia
        • Singapore
        • Vietnam
        • Australia
        • New Zealand
        • Rest of South Asia
      • By Type
      • By Livestock
      • By Form
      • By Distribution Channel
    • Market Attractiveness Analysis
      • By Country
      • By Type
      • By Livestock
      • By Form
      • By Distribution Channel
    • Key Takeaways
  15. Middle East and Africa Market Analysis 2020 to 2024 and Forecast 2025 to 2035, By Country
    • Historical Market Size Value (USD Million) & Volume (Units) Trend Analysis By Market Taxonomy, 2020 to 2024
    • Market Size Value (USD Million) & Volume (Units) Forecast By Market Taxonomy, 2025 to 2035
      • By Country
        • Turkey
        • UAE
        • Saudi Arabia
        • Israel
        • Other GCC Countries
        • North Africa
        • South Africa
      • By Type
      • By Livestock
      • By Form
      • By Distribution Channel
    • Market Attractiveness Analysis
      • By Country
      • By Type
      • By Livestock
      • By Form
      • By Distribution Channel
    • Key Takeaways
  16. Key Countries Market Analysis
    • USA
      • Pricing Analysis
      • Market Share Analysis, 2024
        • By Type
        • By Livestock
        • By Form
        • By Distribution Channel
    • Canada
      • Pricing Analysis
      • Market Share Analysis, 2024
        • By Type
        • By Livestock
        • By Form
        • By Distribution Channel
    • Brazil
      • Pricing Analysis
      • Market Share Analysis, 2024
        • By Type
        • By Livestock
        • By Form
        • By Distribution Channel
    • Mexico
      • Pricing Analysis
      • Market Share Analysis, 2024
        • By Type
        • By Livestock
        • By Form
        • By Distribution Channel
    • Colombia
      • Pricing Analysis
      • Market Share Analysis, 2024
        • By Type
        • By Livestock
        • By Form
        • By Distribution Channel
    • Germany
      • Pricing Analysis
      • Market Share Analysis, 2024
        • By Type
        • By Livestock
        • By Form
        • By Distribution Channel
    • UK
      • Pricing Analysis
      • Market Share Analysis, 2024
        • By Type
        • By Livestock
        • By Form
        • By Distribution Channel
    • France
      • Pricing Analysis
      • Market Share Analysis, 2024
        • By Type
        • By Livestock
        • By Form
        • By Distribution Channel
    • Italy
      • Pricing Analysis
      • Market Share Analysis, 2024
        • By Type
        • By Livestock
        • By Form
        • By Distribution Channel
    • Spain
      • Pricing Analysis
      • Market Share Analysis, 2024
        • By Type
        • By Livestock
        • By Form
        • By Distribution Channel
    • Belgium
      • Pricing Analysis
      • Market Share Analysis, 2024
        • By Type
        • By Livestock
        • By Form
        • By Distribution Channel
    • Netherlands
      • Pricing Analysis
      • Market Share Analysis, 2024
        • By Type
        • By Livestock
        • By Form
        • By Distribution Channel
    • Nordic
      • Pricing Analysis
      • Market Share Analysis, 2024
        • By Type
        • By Livestock
        • By Form
        • By Distribution Channel
    • Switzerland
      • Pricing Analysis
      • Market Share Analysis, 2024
        • By Type
        • By Livestock
        • By Form
        • By Distribution Channel
    • Russia
      • Pricing Analysis
      • Market Share Analysis, 2024
        • By Type
        • By Livestock
        • By Form
        • By Distribution Channel
    • Poland
      • Pricing Analysis
      • Market Share Analysis, 2024
        • By Type
        • By Livestock
        • By Form
        • By Distribution Channel
    • China
      • Pricing Analysis
      • Market Share Analysis, 2024
        • By Type
        • By Livestock
        • By Form
        • By Distribution Channel
    • Japan
      • Pricing Analysis
      • Market Share Analysis, 2024
        • By Type
        • By Livestock
        • By Form
        • By Distribution Channel
    • South Korea
      • Pricing Analysis
      • Market Share Analysis, 2024
        • By Type
        • By Livestock
        • By Form
        • By Distribution Channel
    • India
      • Pricing Analysis
      • Market Share Analysis, 2024
        • By Type
        • By Livestock
        • By Form
        • By Distribution Channel
    • Thailand
      • Pricing Analysis
      • Market Share Analysis, 2024
        • By Type
        • By Livestock
        • By Form
        • By Distribution Channel
    • Indonesia
      • Pricing Analysis
      • Market Share Analysis, 2024
        • By Type
        • By Livestock
        • By Form
        • By Distribution Channel
    • Australia
      • Pricing Analysis
      • Market Share Analysis, 2024
        • By Type
        • By Livestock
        • By Form
        • By Distribution Channel
    • New Zealand
      • Pricing Analysis
      • Market Share Analysis, 2024
        • By Type
        • By Livestock
        • By Form
        • By Distribution Channel
    • Turkey
      • Pricing Analysis
      • Market Share Analysis, 2024
        • By Type
        • By Livestock
        • By Form
        • By Distribution Channel
    • UAE
      • Pricing Analysis
      • Market Share Analysis, 2024
        • By Type
        • By Livestock
        • By Form
        • By Distribution Channel
    • Saudi Arabia
      • Pricing Analysis
      • Market Share Analysis, 2024
        • By Type
        • By Livestock
        • By Form
        • By Distribution Channel
    • Israel
      • Pricing Analysis
      • Market Share Analysis, 2024
        • By Type
        • By Livestock
        • By Form
        • By Distribution Channel
    • North Africa
      • Pricing Analysis
      • Market Share Analysis, 2024
        • By Type
        • By Livestock
        • By Form
        • By Distribution Channel
    • South Africa
      • Pricing Analysis
      • Market Share Analysis, 2024
        • By Type
        • By Livestock
        • By Form
        • By Distribution Channel
  17. Market Structure Analysis
    • Competition Dashboard
    • Competition Benchmarking
    • Market Share Analysis of Top Players
      • By Regional
      • By Type
      • By Livestock
      • By Form
      • By Distribution Channel
  18. Competition Analysis
    • Competition Deep Dive
      • Cargill, Inc.
        • Overview
        • Product Portfolio
        • Profitability by Market Segments (Product/Age /Sales Channel/Region)
        • Sales Footprint
        • Strategy Overview
          • Marketing Strategy
          • Product Strategy
          • Channel Strategy
      • Archer Daniels Midland (ADM)
        • Overview
        • Product Portfolio
        • Profitability by Market Segments (Product/Age /Sales Channel/Region)
        • Sales Footprint
        • Strategy Overview
          • Marketing Strategy
          • Product Strategy
          • Channel Strategy
      • DSM-Firmenich
        • Overview
        • Product Portfolio
        • Profitability by Market Segments (Product/Age /Sales Channel/Region)
        • Sales Footprint
        • Strategy Overview
          • Marketing Strategy
          • Product Strategy
          • Channel Strategy
      • Elanco Animal Health
        • Overview
        • Product Portfolio
        • Profitability by Market Segments (Product/Age /Sales Channel/Region)
        • Sales Footprint
        • Strategy Overview
          • Marketing Strategy
          • Product Strategy
          • Channel Strategy
      • Zoetis, Inc.
        • Overview
        • Product Portfolio
        • Profitability by Market Segments (Product/Age /Sales Channel/Region)
        • Sales Footprint
        • Strategy Overview
          • Marketing Strategy
          • Product Strategy
          • Channel Strategy
      • Bayer AG
        • Overview
        • Product Portfolio
        • Profitability by Market Segments (Product/Age /Sales Channel/Region)
        • Sales Footprint
        • Strategy Overview
          • Marketing Strategy
          • Product Strategy
          • Channel Strategy
      • Kemin Industries, Inc.
        • Overview
        • Product Portfolio
        • Profitability by Market Segments (Product/Age /Sales Channel/Region)
        • Sales Footprint
        • Strategy Overview
          • Marketing Strategy
          • Product Strategy
          • Channel Strategy
      • Alltech Inc.
        • Overview
        • Product Portfolio
        • Profitability by Market Segments (Product/Age /Sales Channel/Region)
        • Sales Footprint
        • Strategy Overview
          • Marketing Strategy
          • Product Strategy
          • Channel Strategy
      • Novus International
        • Overview
        • Product Portfolio
        • Profitability by Market Segments (Product/Age /Sales Channel/Region)
        • Sales Footprint
        • Strategy Overview
          • Marketing Strategy
          • Product Strategy
          • Channel Strategy
      • Chr. Hansen Holding A/S
        • Overview
        • Product Portfolio
        • Profitability by Market Segments (Product/Age /Sales Channel/Region)
        • Sales Footprint
        • Strategy Overview
          • Marketing Strategy
          • Product Strategy
          • Channel Strategy
      • Phibro Animal Health Corporation
        • Overview
        • Product Portfolio
        • Profitability by Market Segments (Product/Age /Sales Channel/Region)
        • Sales Footprint
        • Strategy Overview
          • Marketing Strategy
          • Product Strategy
          • Channel Strategy
      • Evonik Industries AG
        • Overview
        • Product Portfolio
        • Profitability by Market Segments (Product/Age /Sales Channel/Region)
        • Sales Footprint
        • Strategy Overview
          • Marketing Strategy
          • Product Strategy
          • Channel Strategy
      • Nutreco N.V.
        • Overview
        • Product Portfolio
        • Profitability by Market Segments (Product/Age /Sales Channel/Region)
        • Sales Footprint
        • Strategy Overview
          • Marketing Strategy
          • Product Strategy
          • Channel Strategy
      • Adisseo
        • Overview
        • Product Portfolio
        • Profitability by Market Segments (Product/Age /Sales Channel/Region)
        • Sales Footprint
        • Strategy Overview
          • Marketing Strategy
          • Product Strategy
          • Channel Strategy
      • Biomin
        • Overview
        • Product Portfolio
        • Profitability by Market Segments (Product/Age /Sales Channel/Region)
        • Sales Footprint
        • Strategy Overview
          • Marketing Strategy
          • Product Strategy
          • Channel Strategy
  19. Assumptions & Acronyms Used
  20. Research Methodology

List of Tables

  • Table 1: Global Market Value (USD Million) Forecast by Region, 2020-2035
  • Table 2: Global Market Volume (Units) Forecast by Region, 2020-2035
  • Table 3: Global Market Value (USD Million) Forecast by Type, 2020-2035
  • Table 4: Global Market Volume (Units) Forecast by Type, 2020-2035
  • Table 5: Global Market Value (USD Million) Forecast by Livestock, 2020-2035
  • Table 6: Global Market Volume (Units) Forecast by Livestock, 2020-2035
  • Table 7: Global Market Value (USD Million) Forecast by Form, 2020-2035
  • Table 8: Global Market Volume (Units) Forecast by Form, 2020-2035
  • Table 9: Global Market Value (USD Million) Forecast by Distribution Channel, 2020-2035
  • Table 10: Global Market Volume (Units) Forecast by Distribution Channel, 2020-2035
  • Table 11: North America Market Value (USD Million) Forecast by Country, 2020-2035
  • Table 12: North America Market Volume (Units) Forecast by Country, 2020-2035
  • Table 13: North America Market Value (USD Million) Forecast by Type, 2020-2035
  • Table 14: North America Market Volume (Units) Forecast by Type, 2020-2035
  • Table 15: North America Market Value (USD Million) Forecast by Livestock, 2020-2035
  • Table 16: North America Market Volume (Units) Forecast by Livestock, 2020-2035
  • Table 17: North America Market Value (USD Million) Forecast by Form, 2020-2035
  • Table 18: North America Market Volume (Units) Forecast by Form, 2020-2035
  • Table 19: North America Market Value (USD Million) Forecast by Distribution Channel, 2020-2035
  • Table 20: North America Market Volume (Units) Forecast by Distribution Channel, 2020-2035
  • Table 21: Latin America Market Value (USD Million) Forecast by Country, 2020-2035
  • Table 22: Latin America Market Volume (Units) Forecast by Country, 2020-2035
  • Table 23: Latin America Market Value (USD Million) Forecast by Type, 2020-2035
  • Table 24: Latin America Market Volume (Units) Forecast by Type, 2020-2035
  • Table 25: Latin America Market Value (USD Million) Forecast by Livestock, 2020-2035
  • Table 26: Latin America Market Volume (Units) Forecast by Livestock, 2020-2035
  • Table 27: Latin America Market Value (USD Million) Forecast by Form, 2020-2035
  • Table 28: Latin America Market Volume (Units) Forecast by Form, 2020-2035
  • Table 29: Latin America Market Value (USD Million) Forecast by Distribution Channel, 2020-2035
  • Table 30: Latin America Market Volume (Units) Forecast by Distribution Channel, 2020-2035
  • Table 31: Europe Market Value (USD Million) Forecast by Country, 2020-2035
  • Table 32: Europe Market Volume (Units) Forecast by Country, 2020-2035
  • Table 33: Europe Market Value (USD Million) Forecast by Type, 2020-2035
  • Table 34: Europe Market Volume (Units) Forecast by Type, 2020-2035
  • Table 35: Europe Market Value (USD Million) Forecast by Livestock, 2020-2035
  • Table 36: Europe Market Volume (Units) Forecast by Livestock, 2020-2035
  • Table 37: Europe Market Value (USD Million) Forecast by Form, 2020-2035
  • Table 38: Europe Market Volume (Units) Forecast by Form, 2020-2035
  • Table 39: Europe Market Value (USD Million) Forecast by Distribution Channel, 2020-2035
  • Table 40: Europe Market Volume (Units) Forecast by Distribution Channel, 2020-2035
  • Table 41: East Asia Market Value (USD Million) Forecast by Country, 2020-2035
  • Table 42: East Asia Market Volume (Units) Forecast by Country, 2020-2035
  • Table 43: East Asia Market Value (USD Million) Forecast by Type, 2020-2035
  • Table 44: East Asia Market Volume (Units) Forecast by Type, 2020-2035
  • Table 45: East Asia Market Value (USD Million) Forecast by Livestock, 2020-2035
  • Table 46: East Asia Market Volume (Units) Forecast by Livestock, 2020-2035
  • Table 47: East Asia Market Value (USD Million) Forecast by Form, 2020-2035
  • Table 48: East Asia Market Volume (Units) Forecast by Form, 2020-2035
  • Table 49: East Asia Market Value (USD Million) Forecast by Distribution Channel, 2020-2035
  • Table 50: East Asia Market Volume (Units) Forecast by Distribution Channel, 2020-2035
  • Table 51: South Asia & Pacific Market Value (USD Million) Forecast by Country, 2020-2035
  • Table 52: South Asia & Pacific Market Volume (Units) Forecast by Country, 2020-2035
  • Table 53: South Asia & Pacific Market Value (USD Million) Forecast by Type, 2020-2035
  • Table 54: South Asia & Pacific Market Volume (Units) Forecast by Type, 2020-2035
  • Table 55: South Asia & Pacific Market Value (USD Million) Forecast by Livestock, 2020-2035
  • Table 56: South Asia & Pacific Market Volume (Units) Forecast by Livestock, 2020-2035
  • Table 57: South Asia & Pacific Market Value (USD Million) Forecast by Form, 2020-2035
  • Table 58: South Asia & Pacific Market Volume (Units) Forecast by Form, 2020-2035
  • Table 59: South Asia & Pacific Market Value (USD Million) Forecast by Distribution Channel, 2020-2035
  • Table 60: South Asia & Pacific Market Volume (Units) Forecast by Distribution Channel, 2020-2035
  • Table 61: Middle East and Africa Market Value (USD Million) Forecast by Country, 2020-2035
  • Table 62: Middle East and Africa Market Volume (Units) Forecast by Country, 2020-2035
  • Table 63: Middle East and Africa Market Value (USD Million) Forecast by Type, 2020-2035
  • Table 64: Middle East and Africa Market Volume (Units) Forecast by Type, 2020-2035
  • Table 65: Middle East and Africa Market Value (USD Million) Forecast by Livestock, 2020-2035
  • Table 66: Middle East and Africa Market Volume (Units) Forecast by Livestock, 2020-2035
  • Table 67: Middle East and Africa Market Value (USD Million) Forecast by Form, 2020-2035
  • Table 68: Middle East and Africa Market Volume (Units) Forecast by Form, 2020-2035
  • Table 69: Middle East and Africa Market Value (USD Million) Forecast by Distribution Channel, 2020-2035
  • Table 70: Middle East and Africa Market Volume (Units) Forecast by Distribution Channel, 2020-2035

List of Figures

  • Figure 1: Global Market Value (USD Million) by Type, 2025-2035
  • Figure 2: Global Market Value (USD Million) by Livestock, 2025-2035
  • Figure 3: Global Market Value (USD Million) by Form, 2025-2035
  • Figure 4: Global Market Value (USD Million) by Distribution Channel, 2025-2035
  • Figure 5: Global Market Value (USD Million) by Region, 2025-2035
  • Figure 6: Global Market Value (USD Million) Analysis by Region, 2020-2035
  • Figure 7: Global Market Volume (Units) Analysis by Region, 2020-2035
  • Figure 8: Global Market Value Share (%) and BPS Analysis by Region, 2025-2035
  • Figure 9: Global Market Y-o-Y Growth (%) Projections by Region, 2025-2035
  • Figure 10: Global Market Value (USD Million) Analysis by Type, 2020-2035
  • Figure 11: Global Market Volume (Units) Analysis by Type, 2020-2035
  • Figure 12: Global Market Value Share (%) and BPS Analysis by Type, 2025-2035
  • Figure 13: Global Market Y-o-Y Growth (%) Projections by Type, 2025-2035
  • Figure 14: Global Market Value (USD Million) Analysis by Livestock, 2020-2035
  • Figure 15: Global Market Volume (Units) Analysis by Livestock, 2020-2035
  • Figure 16: Global Market Value Share (%) and BPS Analysis by Livestock, 2025-2035
  • Figure 17: Global Market Y-o-Y Growth (%) Projections by Livestock, 2025-2035
  • Figure 18: Global Market Value (USD Million) Analysis by Form, 2020-2035
  • Figure 19: Global Market Volume (Units) Analysis by Form, 2020-2035
  • Figure 20: Global Market Value Share (%) and BPS Analysis by Form, 2025-2035
  • Figure 21: Global Market Y-o-Y Growth (%) Projections by Form, 2025-2035
  • Figure 22: Global Market Value (USD Million) Analysis by Distribution Channel, 2020-2035
  • Figure 23: Global Market Volume (Units) Analysis by Distribution Channel, 2020-2035
  • Figure 24: Global Market Value Share (%) and BPS Analysis by Distribution Channel, 2025-2035
  • Figure 25: Global Market Y-o-Y Growth (%) Projections by Distribution Channel, 2025-2035
  • Figure 26: Global Market Attractiveness by Type, 2025-2035
  • Figure 27: Global Market Attractiveness by Livestock, 2025-2035
  • Figure 28: Global Market Attractiveness by Form, 2025-2035
  • Figure 29: Global Market Attractiveness by Distribution Channel, 2025-2035
  • Figure 30: Global Market Attractiveness by Region, 2025-2035
  • Figure 31: North America Market Value (USD Million) by Type, 2025-2035
  • Figure 32: North America Market Value (USD Million) by Livestock, 2025-2035
  • Figure 33: North America Market Value (USD Million) by Form, 2025-2035
  • Figure 34: North America Market Value (USD Million) by Distribution Channel, 2025-2035
  • Figure 35: North America Market Value (USD Million) by Country, 2025-2035
  • Figure 36: North America Market Value (USD Million) Analysis by Country, 2020-2035
  • Figure 37: North America Market Volume (Units) Analysis by Country, 2020-2035
  • Figure 38: North America Market Value Share (%) and BPS Analysis by Country, 2025-2035
  • Figure 39: North America Market Y-o-Y Growth (%) Projections by Country, 2025-2035
  • Figure 40: North America Market Value (USD Million) Analysis by Type, 2020-2035
  • Figure 41: North America Market Volume (Units) Analysis by Type, 2020-2035
  • Figure 42: North America Market Value Share (%) and BPS Analysis by Type, 2025-2035
  • Figure 43: North America Market Y-o-Y Growth (%) Projections by Type, 2025-2035
  • Figure 44: North America Market Value (USD Million) Analysis by Livestock, 2020-2035
  • Figure 45: North America Market Volume (Units) Analysis by Livestock, 2020-2035
  • Figure 46: North America Market Value Share (%) and BPS Analysis by Livestock, 2025-2035
  • Figure 47: North America Market Y-o-Y Growth (%) Projections by Livestock, 2025-2035
  • Figure 48: North America Market Value (USD Million) Analysis by Form, 2020-2035
  • Figure 49: North America Market Volume (Units) Analysis by Form, 2020-2035
  • Figure 50: North America Market Value Share (%) and BPS Analysis by Form, 2025-2035
  • Figure 51: North America Market Y-o-Y Growth (%) Projections by Form, 2025-2035
  • Figure 52: North America Market Value (USD Million) Analysis by Distribution Channel, 2020-2035
  • Figure 53: North America Market Volume (Units) Analysis by Distribution Channel, 2020-2035
  • Figure 54: North America Market Value Share (%) and BPS Analysis by Distribution Channel, 2025-2035
  • Figure 55: North America Market Y-o-Y Growth (%) Projections by Distribution Channel, 2025-2035
  • Figure 56: North America Market Attractiveness by Type, 2025-2035
  • Figure 57: North America Market Attractiveness by Livestock, 2025-2035
  • Figure 58: North America Market Attractiveness by Form, 2025-2035
  • Figure 59: North America Market Attractiveness by Distribution Channel, 2025-2035
  • Figure 60: North America Market Attractiveness by Country, 2025-2035
  • Figure 61: Latin America Market Value (USD Million) by Type, 2025-2035
  • Figure 62: Latin America Market Value (USD Million) by Livestock, 2025-2035
  • Figure 63: Latin America Market Value (USD Million) by Form, 2025-2035
  • Figure 64: Latin America Market Value (USD Million) by Distribution Channel, 2025-2035
  • Figure 65: Latin America Market Value (USD Million) by Country, 2025-2035
  • Figure 66: Latin America Market Value (USD Million) Analysis by Country, 2020-2035
  • Figure 67: Latin America Market Volume (Units) Analysis by Country, 2020-2035
  • Figure 68: Latin America Market Value Share (%) and BPS Analysis by Country, 2025-2035
  • Figure 69: Latin America Market Y-o-Y Growth (%) Projections by Country, 2025-2035
  • Figure 70: Latin America Market Value (USD Million) Analysis by Type, 2020-2035
  • Figure 71: Latin America Market Volume (Units) Analysis by Type, 2020-2035
  • Figure 72: Latin America Market Value Share (%) and BPS Analysis by Type, 2025-2035
  • Figure 73: Latin America Market Y-o-Y Growth (%) Projections by Type, 2025-2035
  • Figure 74: Latin America Market Value (USD Million) Analysis by Livestock, 2020-2035
  • Figure 75: Latin America Market Volume (Units) Analysis by Livestock, 2020-2035
  • Figure 76: Latin America Market Value Share (%) and BPS Analysis by Livestock, 2025-2035
  • Figure 77: Latin America Market Y-o-Y Growth (%) Projections by Livestock, 2025-2035
  • Figure 78: Latin America Market Value (USD Million) Analysis by Form, 2020-2035
  • Figure 79: Latin America Market Volume (Units) Analysis by Form, 2020-2035
  • Figure 80: Latin America Market Value Share (%) and BPS Analysis by Form, 2025-2035
  • Figure 81: Latin America Market Y-o-Y Growth (%) Projections by Form, 2025-2035
  • Figure 82: Latin America Market Value (USD Million) Analysis by Distribution Channel, 2020-2035
  • Figure 83: Latin America Market Volume (Units) Analysis by Distribution Channel, 2020-2035
  • Figure 84: Latin America Market Value Share (%) and BPS Analysis by Distribution Channel, 2025-2035
  • Figure 85: Latin America Market Y-o-Y Growth (%) Projections by Distribution Channel, 2025-2035
  • Figure 86: Latin America Market Attractiveness by Type, 2025-2035
  • Figure 87: Latin America Market Attractiveness by Livestock, 2025-2035
  • Figure 88: Latin America Market Attractiveness by Form, 2025-2035
  • Figure 89: Latin America Market Attractiveness by Distribution Channel, 2025-2035
  • Figure 90: Latin America Market Attractiveness by Country, 2025-2035
  • Figure 91: Europe Market Value (USD Million) by Type, 2025-2035
  • Figure 92: Europe Market Value (USD Million) by Livestock, 2025-2035
  • Figure 93: Europe Market Value (USD Million) by Form, 2025-2035
  • Figure 94: Europe Market Value (USD Million) by Distribution Channel, 2025-2035
  • Figure 95: Europe Market Value (USD Million) by Country, 2025-2035
  • Figure 96: Europe Market Value (USD Million) Analysis by Country, 2020-2035
  • Figure 97: Europe Market Volume (Units) Analysis by Country, 2020-2035
  • Figure 98: Europe Market Value Share (%) and BPS Analysis by Country, 2025-2035
  • Figure 99: Europe Market Y-o-Y Growth (%) Projections by Country, 2025-2035
  • Figure 100: Europe Market Value (USD Million) Analysis by Type, 2020-2035
  • Figure 101: Europe Market Volume (Units) Analysis by Type, 2020-2035
  • Figure 102: Europe Market Value Share (%) and BPS Analysis by Type, 2025-2035
  • Figure 103: Europe Market Y-o-Y Growth (%) Projections by Type, 2025-2035
  • Figure 104: Europe Market Value (USD Million) Analysis by Livestock, 2020-2035
  • Figure 105: Europe Market Volume (Units) Analysis by Livestock, 2020-2035
  • Figure 106: Europe Market Value Share (%) and BPS Analysis by Livestock, 2025-2035
  • Figure 107: Europe Market Y-o-Y Growth (%) Projections by Livestock, 2025-2035
  • Figure 108: Europe Market Value (USD Million) Analysis by Form, 2020-2035
  • Figure 109: Europe Market Volume (Units) Analysis by Form, 2020-2035
  • Figure 110: Europe Market Value Share (%) and BPS Analysis by Form, 2025-2035
  • Figure 111: Europe Market Y-o-Y Growth (%) Projections by Form, 2025-2035
  • Figure 112: Europe Market Value (USD Million) Analysis by Distribution Channel, 2020-2035
  • Figure 113: Europe Market Volume (Units) Analysis by Distribution Channel, 2020-2035
  • Figure 114: Europe Market Value Share (%) and BPS Analysis by Distribution Channel, 2025-2035
  • Figure 115: Europe Market Y-o-Y Growth (%) Projections by Distribution Channel, 2025-2035
  • Figure 116: Europe Market Attractiveness by Type, 2025-2035
  • Figure 117: Europe Market Attractiveness by Livestock, 2025-2035
  • Figure 118: Europe Market Attractiveness by Form, 2025-2035
  • Figure 119: Europe Market Attractiveness by Distribution Channel, 2025-2035
  • Figure 120: Europe Market Attractiveness by Country, 2025-2035
  • Figure 121: East Asia Market Value (USD Million) by Type, 2025-2035
  • Figure 122: East Asia Market Value (USD Million) by Livestock, 2025-2035
  • Figure 123: East Asia Market Value (USD Million) by Form, 2025-2035
  • Figure 124: East Asia Market Value (USD Million) by Distribution Channel, 2025-2035
  • Figure 125: East Asia Market Value (USD Million) by Country, 2025-2035
  • Figure 126: East Asia Market Value (USD Million) Analysis by Country, 2020-2035
  • Figure 127: East Asia Market Volume (Units) Analysis by Country, 2020-2035
  • Figure 128: East Asia Market Value Share (%) and BPS Analysis by Country, 2025-2035
  • Figure 129: East Asia Market Y-o-Y Growth (%) Projections by Country, 2025-2035
  • Figure 130: East Asia Market Value (USD Million) Analysis by Type, 2020-2035
  • Figure 131: East Asia Market Volume (Units) Analysis by Type, 2020-2035
  • Figure 132: East Asia Market Value Share (%) and BPS Analysis by Type, 2025-2035
  • Figure 133: East Asia Market Y-o-Y Growth (%) Projections by Type, 2025-2035
  • Figure 134: East Asia Market Value (USD Million) Analysis by Livestock, 2020-2035
  • Figure 135: East Asia Market Volume (Units) Analysis by Livestock, 2020-2035
  • Figure 136: East Asia Market Value Share (%) and BPS Analysis by Livestock, 2025-2035
  • Figure 137: East Asia Market Y-o-Y Growth (%) Projections by Livestock, 2025-2035
  • Figure 138: East Asia Market Value (USD Million) Analysis by Form, 2020-2035
  • Figure 139: East Asia Market Volume (Units) Analysis by Form, 2020-2035
  • Figure 140: East Asia Market Value Share (%) and BPS Analysis by Form, 2025-2035
  • Figure 141: East Asia Market Y-o-Y Growth (%) Projections by Form, 2025-2035
  • Figure 142: East Asia Market Value (USD Million) Analysis by Distribution Channel, 2020-2035
  • Figure 143: East Asia Market Volume (Units) Analysis by Distribution Channel, 2020-2035
  • Figure 144: East Asia Market Value Share (%) and BPS Analysis by Distribution Channel, 2025-2035
  • Figure 145: East Asia Market Y-o-Y Growth (%) Projections by Distribution Channel, 2025-2035
  • Figure 146: East Asia Market Attractiveness by Type, 2025-2035
  • Figure 147: East Asia Market Attractiveness by Livestock, 2025-2035
  • Figure 148: East Asia Market Attractiveness by Form, 2025-2035
  • Figure 149: East Asia Market Attractiveness by Distribution Channel, 2025-2035
  • Figure 150: East Asia Market Attractiveness by Country, 2025-2035
  • Figure 151: South Asia & Pacific Market Value (USD Million) by Type, 2025-2035
  • Figure 152: South Asia & Pacific Market Value (USD Million) by Livestock, 2025-2035
  • Figure 153: South Asia & Pacific Market Value (USD Million) by Form, 2025-2035
  • Figure 154: South Asia & Pacific Market Value (USD Million) by Distribution Channel, 2025-2035
  • Figure 155: South Asia & Pacific Market Value (USD Million) by Country, 2025-2035
  • Figure 156: South Asia & Pacific Market Value (USD Million) Analysis by Country, 2020-2035
  • Figure 157: South Asia & Pacific Market Volume (Units) Analysis by Country, 2020-2035
  • Figure 158: South Asia & Pacific Market Value Share (%) and BPS Analysis by Country, 2025-2035
  • Figure 159: South Asia & Pacific Market Y-o-Y Growth (%) Projections by Country, 2025-2035
  • Figure 160: South Asia & Pacific Market Value (USD Million) Analysis by Type, 2020-2035
  • Figure 161: South Asia & Pacific Market Volume (Units) Analysis by Type, 2020-2035
  • Figure 162: South Asia & Pacific Market Value Share (%) and BPS Analysis by Type, 2025-2035
  • Figure 163: South Asia & Pacific Market Y-o-Y Growth (%) Projections by Type, 2025-2035
  • Figure 164: South Asia & Pacific Market Value (USD Million) Analysis by Livestock, 2020-2035
  • Figure 165: South Asia & Pacific Market Volume (Units) Analysis by Livestock, 2020-2035
  • Figure 166: South Asia & Pacific Market Value Share (%) and BPS Analysis by Livestock, 2025-2035
  • Figure 167: South Asia & Pacific Market Y-o-Y Growth (%) Projections by Livestock, 2025-2035
  • Figure 168: South Asia & Pacific Market Value (USD Million) Analysis by Form, 2020-2035
  • Figure 169: South Asia & Pacific Market Volume (Units) Analysis by Form, 2020-2035
  • Figure 170: South Asia & Pacific Market Value Share (%) and BPS Analysis by Form, 2025-2035
  • Figure 171: South Asia & Pacific Market Y-o-Y Growth (%) Projections by Form, 2025-2035
  • Figure 172: South Asia & Pacific Market Value (USD Million) Analysis by Distribution Channel, 2020-2035
  • Figure 173: South Asia & Pacific Market Volume (Units) Analysis by Distribution Channel, 2020-2035
  • Figure 174: South Asia & Pacific Market Value Share (%) and BPS Analysis by Distribution Channel, 2025-2035
  • Figure 175: South Asia & Pacific Market Y-o-Y Growth (%) Projections by Distribution Channel, 2025-2035
  • Figure 176: South Asia & Pacific Market Attractiveness by Type, 2025-2035
  • Figure 177: South Asia & Pacific Market Attractiveness by Livestock, 2025-2035
  • Figure 178: South Asia & Pacific Market Attractiveness by Form, 2025-2035
  • Figure 179: South Asia & Pacific Market Attractiveness by Distribution Channel, 2025-2035
  • Figure 180: South Asia & Pacific Market Attractiveness by Country, 2025-2035
  • Figure 181: Middle East and Africa Market Value (USD Million) by Type, 2025-2035
  • Figure 182: Middle East and Africa Market Value (USD Million) by Livestock, 2025-2035
  • Figure 183: Middle East and Africa Market Value (USD Million) by Form, 2025-2035
  • Figure 184: Middle East and Africa Market Value (USD Million) by Distribution Channel, 2025-2035
  • Figure 185: Middle East and Africa Market Value (USD Million) by Country, 2025-2035
  • Figure 186: Middle East and Africa Market Value (USD Million) Analysis by Country, 2020-2035
  • Figure 187: Middle East and Africa Market Volume (Units) Analysis by Country, 2020-2035
  • Figure 188: Middle East and Africa Market Value Share (%) and BPS Analysis by Country, 2025-2035
  • Figure 189: Middle East and Africa Market Y-o-Y Growth (%) Projections by Country, 2025-2035
  • Figure 190: Middle East and Africa Market Value (USD Million) Analysis by Type, 2020-2035
  • Figure 191: Middle East and Africa Market Volume (Units) Analysis by Type, 2020-2035
  • Figure 192: Middle East and Africa Market Value Share (%) and BPS Analysis by Type, 2025-2035
  • Figure 193: Middle East and Africa Market Y-o-Y Growth (%) Projections by Type, 2025-2035
  • Figure 194: Middle East and Africa Market Value (USD Million) Analysis by Livestock, 2020-2035
  • Figure 195: Middle East and Africa Market Volume (Units) Analysis by Livestock, 2020-2035
  • Figure 196: Middle East and Africa Market Value Share (%) and BPS Analysis by Livestock, 2025-2035
  • Figure 197: Middle East and Africa Market Y-o-Y Growth (%) Projections by Livestock, 2025-2035
  • Figure 198: Middle East and Africa Market Value (USD Million) Analysis by Form, 2020-2035
  • Figure 199: Middle East and Africa Market Volume (Units) Analysis by Form, 2020-2035
  • Figure 200: Middle East and Africa Market Value Share (%) and BPS Analysis by Form, 2025-2035
  • Figure 201: Middle East and Africa Market Y-o-Y Growth (%) Projections by Form, 2025-2035
  • Figure 202: Middle East and Africa Market Value (USD Million) Analysis by Distribution Channel, 2020-2035
  • Figure 203: Middle East and Africa Market Volume (Units) Analysis by Distribution Channel, 2020-2035
  • Figure 204: Middle East and Africa Market Value Share (%) and BPS Analysis by Distribution Channel, 2025-2035
  • Figure 205: Middle East and Africa Market Y-o-Y Growth (%) Projections by Distribution Channel, 2025-2035
  • Figure 206: Middle East and Africa Market Attractiveness by Type, 2025-2035
  • Figure 207: Middle East and Africa Market Attractiveness by Livestock, 2025-2035
  • Figure 208: Middle East and Africa Market Attractiveness by Form, 2025-2035
  • Figure 209: Middle East and Africa Market Attractiveness by Distribution Channel, 2025-2035
  • Figure 210: Middle East and Africa Market Attractiveness by Country, 2025-2035

Frequently Asked Questions

How big is the Antimicrobial Feed Additives Market in 2025?

The Antimicrobial Feed Additives Market is estimated to be valued at USD 3,640.0 million in 2025.

What will be the size of the Antimicrobial Feed Additives Market in 2035?

The market size for the Antimicrobial Feed Additives Market is projected to reach USD 6,515.9 million by 2035.

How much will be the Antimicrobial Feed Additives Market growth between 2025 and 2035?

The Antimicrobial Feed Additives Market is expected to grow at a 6.0% CAGR between 2025 and 2035.

What are the key product types in the Antimicrobial Feed Additives Market?

The key product types in the Antimicrobial Feed Additives Market are antibiotics, acidifiers, enzyme-based additives, probiotics & prebiotics, phytogenics, and others.

Which livestock segment will contribute a significant share in the Antimicrobial Feed Additives Market in 2025?

In terms of livestock, the poultry segment is expected to command 35.4% share in the Antimicrobial Feed Additives Market in 2025.

Explore Similar Insights

Future Market Insights

Antimicrobial Feed Additives Market

Chat With

MaRIA

Hi There, I am MaRIA, Your Market Research Intelligence Assistant. How may I help you?