The global multi colored LED beads market is poised for substantial expansion over the next decade, driven by accelerating demand for energy-efficient lighting solutions, rapid urbanization requiring advanced architectural illumination, and technological innovations in semiconductor manufacturing enabling superior color rendering and operational longevity. The multi colored LED beads market is projected to grow from USD 26.4 billion in 2025 to approximately USD 31.8 billion by 2035, representing an absolute increase of USD 5.4 billion over the forecast period. This translates into a total growth of 20.5%, with the multi colored LED beads market expanding at a CAGR of 1.9% between 2025 and 2035.
The relatively modest but steady growth trajectory reflects market maturation in developed economies, offset by accelerating adoption in emerging markets where smart city initiatives and infrastructure modernization programs are driving comprehensive LED implementation. The overall market size is expected to grow by approximately 1.2X during the forecast period, supported by ongoing technological advancement in color mixing algorithms, miniaturization enabling diverse application integration, and declining production costs making multi colored LED solutions increasingly accessible across various lighting applications and geographic markets.
Industry dynamics are characterized by continuous innovation in phosphor coating technologies, improvements in thermal management systems, and development of intelligent control interfaces that enable dynamic color adjustment and energy optimization. The transition from traditional lighting infrastructure to smart, connected LED systems creates sustained demand for multi colored beads capable of supporting complex lighting scenarios across entertainment venues, commercial buildings, public spaces, and residential applications. Growing environmental consciousness and regulatory mandates promoting energy efficiency are accelerating replacement cycles and driving premium product adoption.
The competitive landscape features established semiconductor manufacturers with comprehensive production capabilities, specialized LED component suppliers focusing on application-specific solutions, and emerging players leveraging cost advantages in high-volume manufacturing. Regional production concentration in Asia Pacific, particularly China, continues to influence global supply chain dynamics, while Western markets maintain technological leadership in premium segments requiring advanced color consistency and reliability standards. The interplay between cost optimization pressures and quality requirements shapes procurement strategies across diverse end-use applications, from cost-sensitive architectural lighting to performance-critical stage and entertainment systems.
Market participants are increasingly investing in R&D initiatives focused on improving luminous efficacy, expanding color gamut capabilities, and developing intelligent driver integration that enables seamless connectivity with building management and IoT platforms. These technological advances, combined with favorable regulatory environments promoting LED adoption and declining total cost of ownership compared to conventional lighting alternatives, position the multi colored LED beads market for sustained growth throughout the forecast period despite the mature nature of core lighting technologies.
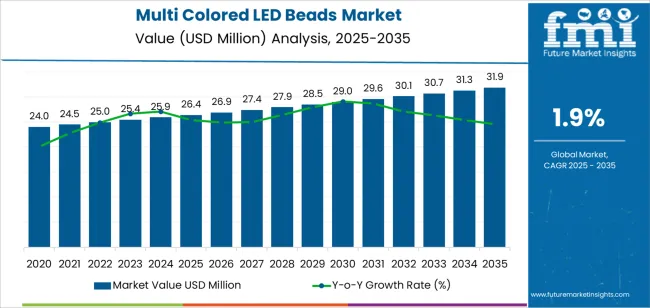
| Metric | Value |
|---|---|
| Market Value (2025) | USD 26.4 billion |
| Market Forecast Value (2035) | USD 31.8 billion |
| Forecast CAGR (2025-2035) | 1.9% |
| ENERGY EFFICIENCY DRIVERS | SMART INFRASTRUCTURE DEVELOPMENT | TECHNOLOGICAL ADVANCEMENT |
|---|---|---|
| Global Sustainability Mandates Worldwide regulatory frameworks establishing stringent energy efficiency standards driving comprehensive LED adoption across commercial, residential, and public lighting infrastructure. |
Smart City Integration Urban development programs requiring intelligent lighting systems with dynamic color control capabilities supporting aesthetic enhancement and energy optimization. |
Color Rendering Innovation Advanced phosphor coating technologies and quantum dot integration enabling superior color accuracy and expanded gamut capabilities for demanding applications. |
| Cost Reduction Acceleration Declining LED production costs and improving operational efficiency making multi colored solutions economically competitive with conventional lighting alternatives. |
Architectural Lighting Evolution Growing emphasis on building facade illumination and landscape lighting requiring programmable color solutions supporting brand expression and environmental adaptation. |
Miniaturization Progress Ongoing component size reduction enabling integration into diverse form factors and supporting emerging applications in automotive, consumer electronics, and specialty lighting. |
| Replacement Cycle Momentum Aging conventional lighting infrastructure reaching end-of-life creating sustained demand for energy-efficient LED alternatives with extended operational lifespans. |
Entertainment Industry Growth Expanding live events, concerts, and theatrical productions requiring sophisticated stage lighting with precise color control and dynamic programming capabilities. |
Intelligent Control Systems Development of IoT-enabled drivers and wireless control protocols enabling seamless integration with building management platforms and user interfaces. |
| Category | Segments Covered |
|---|---|
| By Power Rating | High Power, Medium and Low Power |
| By Application | Stage Lighting, Architectural and Landscape Lighting, Indoor Intelligent Luminaires, Others |
| By Region | Asia Pacific, Europe, North America, Latin America, Middle East & Africa |
| Segment | 2025 to 2035 Outlook |
|---|---|
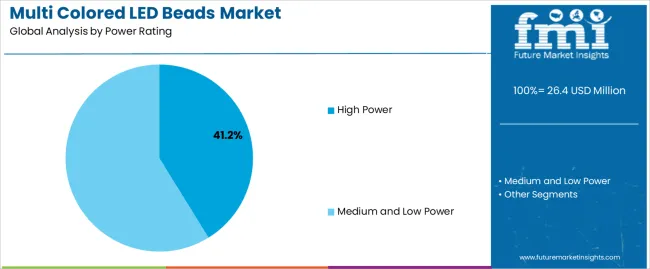
| High Power | Dominates market in 2025 with 41.2% share, driven by stage lighting, large-venue illumination, and outdoor architectural applications requiring superior luminous output and color intensity. Superior thermal performance and concentrated light output make high power beads essential for professional entertainment installations and commercial facade lighting. Momentum: steady growth through 2030 driven by venue construction and architectural lighting adoption, moderating thereafter as market matures. Watchouts: thermal management complexity, higher unit costs limiting residential penetration, competition from emerging mid-power alternatives offering improved efficiency. |
| Medium and Low Power | Commands 58.8% market share in 2025, benefiting from indoor lighting applications, residential adoption, and consumer electronics integration. Cost advantages, simplified thermal management, and sufficient output for most indoor applications drive broad adoption across luminaire manufacturing. Momentum: moderate but sustained growth supported by smart home integration, IoT-enabled lighting systems, and expanding residential LED penetration in emerging markets. Watchouts: commoditization pressure, intense price competition from Asian manufacturers, limited differentiation in standard applications. |
| Segment | 2025 to 2035 Outlook |
|---|---|
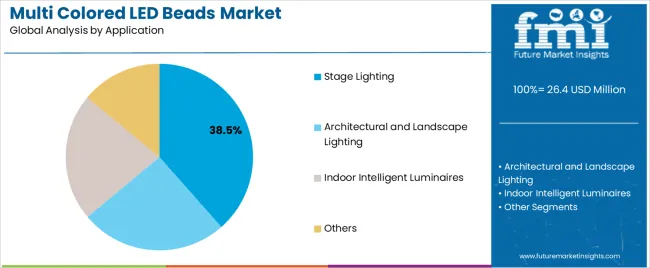
| Stage Lighting | Largest application segment with 38.5% market share in 2025, driven by professional entertainment industry requirements for precise color control, high intensity output, and dynamic programming capabilities. Live events, theatrical productions, and concert tours require sophisticated multi colored LED systems supporting complex lighting designs. Momentum: strong growth through 2028 supported by event industry recovery and venue modernization, moderating as installation base matures. Watchouts: cyclical demand tied to entertainment industry health, long replacement cycles, price pressure from increased competition. |
| Architectural and Landscape Lighting | Holds 29.7% share in 2025, experiencing rapid adoption driven by smart city initiatives, commercial building facade illumination, and outdoor public space enhancement projects. RGB and RGBW solutions enable dynamic building lighting supporting brand expression and seasonal celebrations. Momentum: fastest-growing application segment through 2030 as urban development accelerates and architectural lighting becomes standard for premium buildings. Watchouts: project-based lumpiness, weather durability requirements, municipal budget constraints affecting public projects. |
| Indoor Intelligent Luminaires | Commands 21.4% market share, benefiting from smart home adoption, circadian lighting systems, and IoT integration in residential and commercial spaces. Tunable white and RGB capabilities enable wellness-focused lighting supporting human-centric design principles. Momentum: moderate growth driven by smart home penetration and wellness trend adoption, with acceleration in premium residential and hospitality segments. Watchouts: consumer price sensitivity, complexity of control system integration, competition from basic fixed-color alternatives. |
| Others | Represents 10.4% share encompassing automotive interior lighting, consumer electronics backlighting, and specialty applications. Diverse requirements across applications create fragmented demand patterns with varying technical specifications. Momentum: selective growth in automotive mood lighting and premium consumer electronics, offset by display technology shifts in some segments. Watchouts: rapid technology evolution, automotive OEM qualification requirements, consumer electronics margin pressure. |
| DRIVERS | RESTRAINTS | KEY TRENDS |
|---|---|---|
| Energy Efficiency Mandates Global regulatory frameworks establishing comprehensive LED adoption standards across commercial and residential sectors driving sustained replacement demand. Infrastructure Modernization Urbanization and smart city development creating opportunities for intelligent lighting systems with dynamic color control capabilities. Entertainment Industry Expansion Growing live event sector and venue construction requiring sophisticated stage lighting with precise color rendering and programming flexibility. |
Technology Commoditization Mature product categories experiencing intense price competition reducing profit margins and creating pressure for continuous cost reduction. Installation Complexity Control system integration requirements and programming complexity creating barriers for some residential and small commercial applications. Regional Manufacturing Concentration Supply chain dependencies on Asian production centers creating delivery lead time variability and quality consistency concerns. |
Intelligent Control Integration Development of IoT-enabled drivers, wireless protocols, and building management system integration enabling sophisticated lighting automation. Human-Centric Lighting Growing adoption of circadian rhythm-supporting lighting systems in healthcare, hospitality, and premium residential applications. Quantum Dot Enhancement Emerging integration of quantum dot technologies enabling expanded color gamut and improved color rendering index for premium applications. Miniaturization Advancement Ongoing component size reduction enabling integration into compact luminaires and expanding application possibilities in consumer electronics and automotive sectors. |
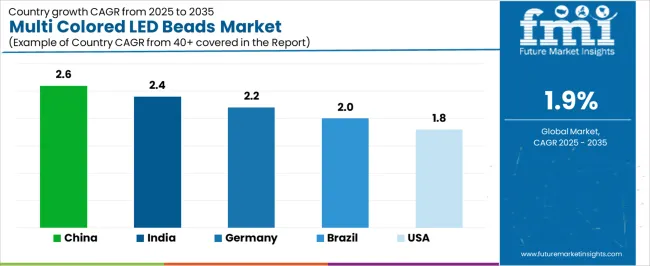
| Country | CAGR (2025-2035) |
|---|---|
| China | 2.6% |
| India | 2.4% |
| Germany | 2.2% |
| Brazil | 2.0% |
| United States | 1.8% |
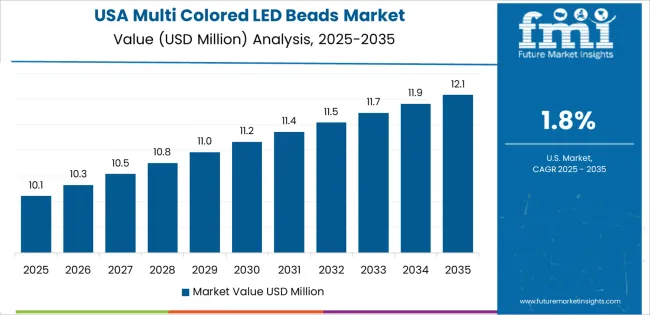
Revenue from Multi Colored LED Beads in China is projected to reach significant market value by 2035, driven by the country's comprehensive semiconductor manufacturing infrastructure, extensive stage lighting production ecosystem, and expanding architectural lighting adoption across urban development projects. China's position as global manufacturing hub for LED components creates substantial competitive advantages through vertical integration, supply chain efficiency, and cost optimization capabilities supporting both domestic consumption and export operations.
Major LED manufacturers including Dongguan Bestop, Guangdong Taishi, and Shenzhen TCWIN maintain comprehensive production facilities supporting diverse power rating and color specification requirements across multiple application segments. The country's ongoing smart city initiatives and urban modernization programs are driving sustained demand for architectural and landscape lighting solutions requiring multi colored LED components with reliable performance characteristics.
Revenue from Multi Colored LED Beads in India is expanding significantly by 2035, supported by comprehensive infrastructure modernization programs, growing entertainment industry, and government initiatives promoting LED adoption across residential and commercial sectors. India's Smart Cities Mission and urban development projects are creating sustained demand for architectural lighting solutions requiring sophisticated color control capabilities.
Domestic LED manufacturing capabilities are expanding through government production-linked incentive schemes, reducing import dependence and supporting local value chain development. Major infrastructure projects including metro systems, airports, and commercial complexes are incorporating advanced lighting systems featuring multi colored LED components.
Demand for Multi Colored LED Beads in Germany is projected to show steady growth by 2035, supported by the country's leadership in lighting technology innovation, stringent quality standards, and comprehensive building automation adoption requiring sophisticated color control capabilities. German lighting manufacturers maintain premium market positioning through technical excellence and reliability standards.
The country's emphasis on energy efficiency, circadian lighting systems, and human-centric design principles drives demand for high-quality multi colored LED components supporting wellness-focused applications in healthcare, hospitality, and premium residential sectors. Major lighting manufacturers maintain close relationships with LED component suppliers ensuring specification compliance and performance consistency.
Revenue from Multi Colored LED Beads in Brazil is growing to reach substantial value by 2035, driven by entertainment industry development, commercial building construction, and increasing LED adoption across urban centers. The country's vibrant entertainment culture and growing event industry create sustained demand for stage lighting solutions featuring sophisticated color control capabilities.
Commercial real estate development and shopping center construction incorporate architectural lighting features requiring multi colored LED components supporting brand expression and aesthetic differentiation. Growing middle class and improving economic conditions support residential LED adoption with increasing interest in smart lighting systems.
Demand for Multi Colored LED Beads in United States is projected to expand moderately by 2035, driven by building automation adoption, smart home integration, and entertainment industry requirements for advanced lighting systems. The mature market demonstrates sustained replacement demand and selective growth in premium segments emphasizing connectivity and intelligent control.
Commercial building retrofits and new construction increasingly incorporate IoT-enabled lighting systems with tunable white and color capabilities supporting occupant wellness and energy management objectives. Entertainment venues and hospitality projects maintain demand for high-quality stage lighting components meeting professional performance standards.
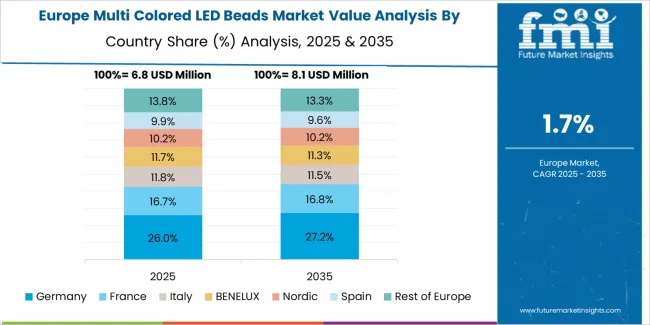
The multi colored LED beads market in Europe is projected to grow from USD 5.8 billion in 2025 to USD 7.1 billion by 2035, registering a CAGR of 2.1% over the forecast period. Germany is expected to maintain its leadership position with a 28.4% market share in 2025, declining slightly to 27.8% by 2035, supported by its advanced lighting technology industry, stringent quality standards, and comprehensive building automation adoption requiring sophisticated color control capabilities.
France follows with a 19.6% share in 2025, projected to reach 20.1% by 2035, driven by architectural lighting adoption in commercial developments and entertainment venue modernization programs. The United Kingdom holds a 16.8% share in 2025, expected to stabilize at 16.5% by 2035 despite market maturity. Italy commands a 15.3% share, benefiting from design-focused lighting applications and architectural heritage illumination projects, while Spain accounts for 11.2% in 2025. The Rest of Europe region is anticipated to gain momentum, expanding its collective share from 8.7% to 9.3% by 2035, attributed to smart city initiatives in Nordic countries and LED adoption acceleration in Eastern European markets implementing energy efficiency programs.
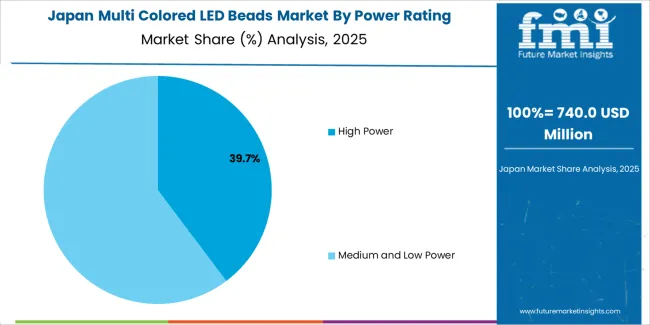
Japanese Multi Colored LED Beads operations reflect the country's exacting quality standards and technological leadership in lighting systems. Major electronics manufacturers including Nichia, Toshiba Materials, and Stanley Electric maintain rigorous quality control processes ensuring superior color consistency, operational longevity, and reliability standards that often exceed international benchmarks. This commitment to quality creates premium market positioning supporting higher pricing in professional and commercial applications.
The Japanese market demonstrates unique application preferences, with significant demand for tunable white LED systems supporting circadian lighting applications in healthcare facilities, hospitality properties, and premium residential developments. Companies require precise color temperature control and high color rendering index specifications that differ from cost-focused approaches in other markets, driving demand for premium component solutions.
Regulatory oversight through the Ministry of Economy, Trade and Industry emphasizes comprehensive energy efficiency standards and lighting performance requirements that support continued LED adoption. The building standard law requires compliance with illumination guidelines that favor high-quality LED solutions over budget alternatives, creating sustained demand for premium multi colored beads.
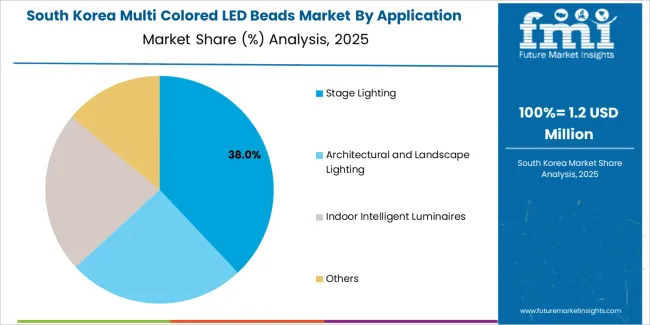
South Korean Multi Colored LED Beads operations reflect the country's advanced electronics manufacturing capabilities and export-oriented lighting industry. Major conglomerates including Samsung Electronics, LG Innotek, and Seoul Semiconductor drive sophisticated LED development strategies, establishing comprehensive R&D programs focused on improving luminous efficacy, color rendering performance, and miniaturization capabilities supporting diverse application requirements.
The Korean market demonstrates particular strength in integrating LED technology with smart building systems and IoT platforms, with companies like Samsung and LG developing comprehensive lighting control ecosystems that enable seamless connectivity with building management and home automation systems. This technology leadership creates demand for advanced multi colored LED components supporting intelligent lighting applications.
Regulatory frameworks emphasize energy efficiency and green building standards, with the Korean Energy Agency implementing progressive LED adoption programs. Government initiatives supporting smart city development and building automation create opportunities for lighting systems featuring sophisticated color control capabilities. The regulatory environment particularly favors suppliers demonstrating technological innovation and energy performance optimization.
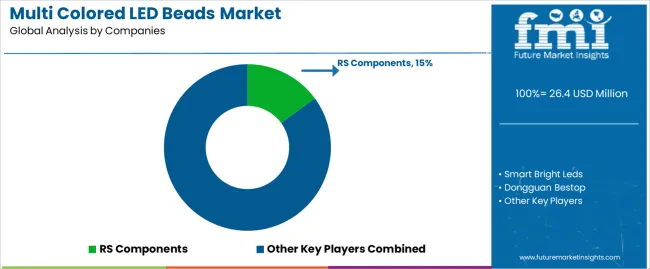
The competitive landscape in the multi colored LED beads market reflects consolidation around manufacturing scale, technology leadership, and application-specific expertise. Profit pools concentrate in three distinct tiers: upstream semiconductor manufacturers commanding premium pricing through proprietary phosphor formulations and color consistency capabilities; mid-stream component integrators leveraging supply chain efficiency and specification management; and downstream application specialists providing custom solutions for professional lighting and entertainment applications.
Value migration accelerates toward suppliers demonstrating comprehensive quality documentation, reliable color binning capabilities, and responsive technical support that reduces customer qualification cycles and operational risk. Asian manufacturers, particularly Chinese producers including Dongguan Bestop, Guangdong Taishi, and Shenzhen TCWIN, dominate volume segments through aggressive pricing and acceptable quality levels for cost-sensitive applications. Meanwhile, Japanese and Korean suppliers including Nichia, Seoul Semiconductor, and LG Innotek maintain premium positioning through superior color rendering, operational longevity, and stringent quality control processes.
European and North American players including RS Components and Smart Bright Leds focus on distribution excellence, technical support capabilities, and application engineering services that support specifiers and lighting manufacturers requiring reliable supply and comprehensive documentation. These companies leverage relationships with professional lighting designers, entertainment industry contractors, and architectural firms to maintain market access despite higher pricing compared to direct Asian sourcing alternatives.
Switching costs remain significant in professional applications where color consistency, reliability standards, and technical specifications require extensive qualification processes that can span 6-12 months for critical entertainment and architectural lighting projects. This creates incumbent advantages for established suppliers maintaining proven track records, particularly in stage lighting and premium architectural applications where performance failures create substantial reputational and financial risks.
Market consolidation continues as larger semiconductor manufacturers acquire smaller specialized producers to expand color capabilities and application expertise. Vertical integration increases with lighting fixture manufacturers establishing direct relationships with LED component suppliers or acquiring production capabilities to secure supply and control quality. Digital procurement platforms emerging for commodity grades, but premium specifications requiring tight color binning and reliability documentation remain relationship-driven with direct supplier engagement.
Strategic imperatives for market participants include hardwiring supply chain resilience through multi-region sourcing strategies, investing in color consistency improvement programs that reduce binning waste, and developing IoT-enabled driver integration capabilities that enable seamless connectivity with building management platforms. Companies must also address ESG scrutiny through transparent semiconductor manufacturing processes and comprehensive energy efficiency documentation supporting customer sustainability reporting requirements.
| Items | Values |
|---|---|
| Quantitative Units | USD 26.4 billion |
| Product | High Power, Medium and Low Power LED Beads |
| Application | Stage Lighting, Architectural and Landscape Lighting, Indoor Intelligent Luminaires, Others |
| Regions Covered | Asia Pacific, Europe, North America, Latin America, Middle East & Africa |
| Country Covered | China, India, Germany, Brazil, United States, and other 40+ countries |
| Key Companies Profiled | RS Components, Smart Bright Leds, Dongguan Bestop, Guangdong Taishi, Shenzhen TCWIN, Guangdong Taihong LED, Shenzhen Huayao, Nichia Corporation, Seoul Semiconductor, LG Innotek |
| Additional Attributes | Dollar sales by power rating/application, regional demand (Asia Pacific, Europe, North America), competitive landscape, smart lighting integration, color rendering advancement, and IoT connectivity developments driving energy efficiency, design flexibility, and application diversification |
The global multi colored LED beads market is estimated to be valued at USD 26.4 million in 2025.
The market size for the multi colored LED beads market is projected to reach USD 31.9 million by 2035.
The multi colored LED beads market is expected to grow at a 1.9% CAGR between 2025 and 2035.
The key product types in multi colored LED beads market are high power and medium and low power.
In terms of application, stage lighting segment to command 38.5% share in the multi colored LED beads market in 2025.


Full Research Suite comprises of:
Market outlook & trends analysis
Interviews & case studies
Strategic recommendations
Vendor profiles & capabilities analysis
5-year forecasts
8 regions and 60+ country-level data splits
Market segment data splits
12 months of continuous data updates
DELIVERED AS:
PDF EXCEL ONLINE
Multi-Drug/Combination Injectable Market Forecast and Outlook 2025 to 2035
Multiplex Sepsis Biomarker Panels Market Size and Share Forecast Outlook 2025 to 2035
Multiplex Protein Profiling Market Size and Share Forecast Outlook 2025 to 2035
Multihead Weighers Market Size and Share Forecast Outlook 2025 to 2035
Multi-Cloud Networking Market Forecast Outlook 2025 to 2035
Multispectral Camera Market Size and Share Forecast Outlook 2025 to 2035
Multi-functional Packaging Market Size and Share Forecast Outlook 2025 to 2035
Multiplex Biomarker Imaging Market Forecast and Outlook 2025 to 2035
Multichannel Order Management Market Forecast and Outlook 2025 to 2035
Multiexperience Development Platform Market Forecast and Outlook 2025 to 2035
Multi Depth Corrugated Box Market Size and Share Forecast Outlook 2025 to 2035
Multilayer Flexible Packaging Market Size and Share Forecast Outlook 2025 to 2035
Multi Attachment Loaders Market Size and Share Forecast Outlook 2025 to 2035
Multi Pocket Holders Market Size and Share Forecast Outlook 2025 to 2035
Multi-Screen Super Glass Market Size and Share Forecast Outlook 2025 to 2035
Multichannel Reagent Reservoir Market Size and Share Forecast Outlook 2025 to 2035
Multi-Functional Point Of Care Testing Market Size and Share Forecast Outlook 2025 to 2035
Multi-layer Film Recycling Market Size and Share Forecast Outlook 2025 to 2035
Multifunctional Household Robot Market Size and Share Forecast Outlook 2025 to 2035
Multistage Ring Section Pumps Market Size and Share Forecast Outlook 2025 to 2035

Thank you!
You will receive an email from our Business Development Manager. Please be sure to check your SPAM/JUNK folder too.
Chat With
MaRIA