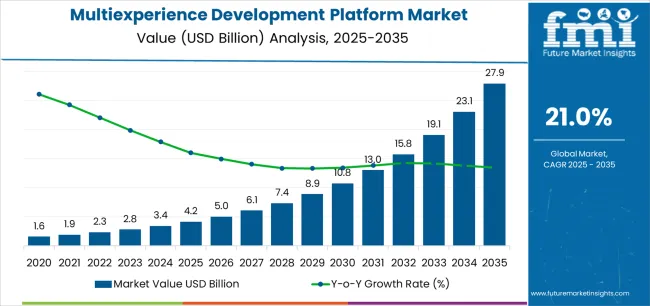
The Multiexperience Development Platform Market is estimated to be valued at USD 4.2 billion in 2025 and is projected to reach USD 27.9 billion by 2035, registering a compound annual growth rate (CAGR) of 21.0% over the forecast period.
The Multiexperience Development Platform (MXDP) market is experiencing significant growth, driven by the increasing demand for integrated digital experiences across multiple touchpoints and devices. Organizations are prioritizing platforms that allow seamless development and deployment of applications across web, mobile, voice, and IoT interfaces, enhancing user engagement and operational efficiency. Adoption is being fueled by the growing emphasis on digital transformation initiatives, accelerated cloud adoption, and the need for rapid application delivery.
The integration of AI, analytics, and low-code/no-code capabilities is enabling businesses to optimize development workflows, reduce time-to-market, and lower operational costs. Enterprises are increasingly seeking solutions that support real-time collaboration, secure data management, and scalable deployment models.
As organizations focus on customer-centric strategies and omnichannel experience delivery, the MXDP market is poised for sustained growth Rising investments in digital infrastructure, coupled with the increasing adoption of cloud and hybrid deployment models, are expected to further accelerate demand for flexible and future-ready development platforms in the coming years.
| Metric | Value |
|---|---|
| Multiexperience Development Platform Market Estimated Value in (2025 E) | USD 4.2 billion |
| Multiexperience Development Platform Market Forecast Value in (2035 F) | USD 27.9 billion |
| Forecast CAGR (2025 to 2035) | 21.0% |
The market is segmented by Component, Deployment Mode, Enterprise Size, and Industry Vertical and region. By Component, the market is divided into Platforms and Services. In terms of Deployment Mode, the market is classified into Cloud and On Premises. Based on Enterprise Size, the market is segmented into Large Enterprises and Small And Medium Sized Enterprises. By Industry Vertical, the market is divided into IT And Telecom, BFSI, Retail And Consumer Goods, Manufacturing, Energy And Utilities, Healthcare And Life Sciences, Government And Public Sector, and Others. Regionally, the market is classified into North America, Latin America, Western Europe, Eastern Europe, Balkan & Baltic Countries, Russia & Belarus, Central Asia, East Asia, South Asia & Pacific, and the Middle East & Africa.
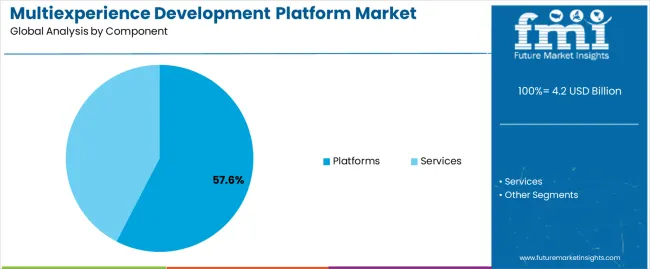
The platforms component segment is projected to hold 57.6% of the MXDP market revenue in 2025, establishing it as the leading component. Growth is driven by the increasing need for centralized development environments that allow organizations to design, deploy, and manage applications across multiple channels from a single platform. Platforms enable rapid prototyping, testing, and scaling of applications, reducing dependency on traditional development processes and lowering operational costs.
Integration with AI, analytics, and low-code/no-code tools enhances productivity and accelerates innovation cycles. Enterprises leverage these platforms to ensure consistency in user experience, streamline workflows, and improve application performance.
The ability to support multiple deployment environments, maintain compliance standards, and integrate with enterprise IT systems further reinforces adoption As organizations increasingly prioritize omnichannel engagement and agile development methodologies, the platforms segment is expected to maintain its leadership, driven by its scalability, flexibility, and capability to deliver high-performance multiexperience applications across industries.
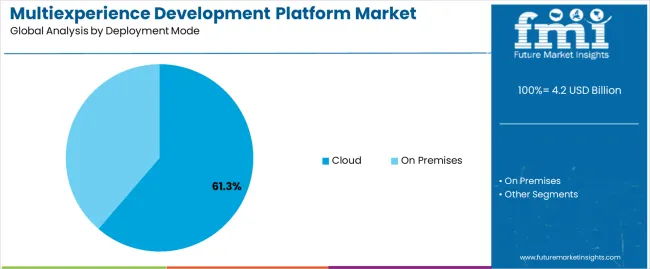
The cloud deployment mode segment is anticipated to account for 61.3% of the market revenue in 2025, making it the leading deployment option. Growth in this segment is driven by the scalability, flexibility, and cost efficiency provided by cloud-based solutions, which allow enterprises to manage multiexperience applications without extensive on-premises infrastructure. Cloud deployment facilitates real-time collaboration, centralized control, and seamless updates, enhancing operational efficiency and reducing IT overhead.
Organizations benefit from rapid deployment, high availability, and simplified maintenance, enabling faster innovation cycles and better time-to-market. Security, compliance, and integration capabilities have improved, increasing confidence in cloud adoption for critical enterprise applications.
Rising cloud adoption trends, accelerated digital transformation initiatives, and the need for flexible, scalable, and future-ready platforms are further supporting growth As enterprises continue to embrace cloud-first strategies, the cloud deployment mode is expected to remain the preferred choice, maintaining its leading share and driving market expansion.
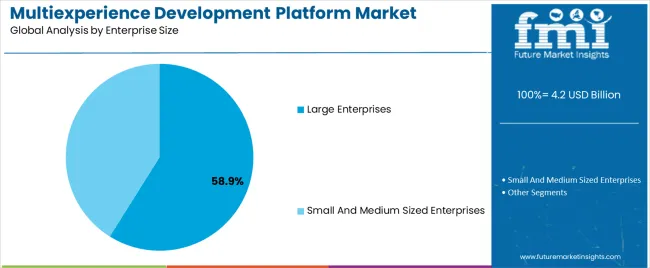
The large enterprises segment is projected to hold 58.9% of the MXDP market revenue in 2025, establishing it as the leading enterprise size category. Growth is being driven by the increasing adoption of multiexperience development platforms to streamline digital operations, enhance customer engagement, and accelerate application development across multiple business units.
Large enterprises benefit from centralized platforms that support multiple teams, cross-functional collaboration, and governance standards while ensuring scalability and performance. The integration of AI, analytics, and low-code/no-code capabilities allows large organizations to optimize workflows, reduce development cycles, and achieve faster time-to-market.
Additionally, compliance requirements, data security considerations, and the need for high availability further reinforce adoption within this segment As large enterprises continue to pursue digital transformation strategies and prioritize omnichannel experiences, they are expected to remain the primary drivers of market growth, supported by platforms that provide flexibility, efficiency, and enterprise-grade reliability for multiexperience application delivery.
The scope for multiexperience development platform rose at a 26.9% CAGR between 2020 and 2025. The global market is achieving heights to grow at a moderate CAGR of 22.1% over the forecast period 2025 to 2035.
The market experienced significant growth during the historical period, attributed to the proliferation of digital touchpoints, the rise of multiexperience development, as well as the increasing demand for unified development environments.
Businesses increasingly prioritized user centric design as well as development, which LED to the adoption of the platforms that enable seamless and consistent user experiences across multiple channels.
The market saw rapid innovation and competition, with vendors introducing new features, tools, and services to differentiate their offerings and capture market share.
Looking forward to the forecast period, the platforms will increasingly integrate with emerging technologies such as edge computing, blockchain, and extended reality to enable the development of innovative and immersive multiexperience applications.
The market will witness further global expansion as organizations worldwide embrace digital transformation initiatives and seek solutions to enhance their digital capabilities and reach new markets.
The platform providers will focus on expanding into vertical markets such as healthcare, retail, finance, and manufacturing, offering industry specific solutions that address unique business needs and regulatory requirements.
The below table showcases revenues in terms of the top 5 leading countries, spearheaded by Korea and the United Kingdom. The countries will lead the market through 2035.
| Countries | Forecast CAGRs from 2025 to 2035 |
|---|---|
| The United States | 22.4% |
| The United Kingdom | 23.2% |
| China | 22.8% |
| Japan | 23.1% |
| Korea | 24.0% |
The multiexperience development platform market in the United States will expand at a CAGR of 22.4% through 2035. The country has one of the highest smartphone penetration rates globally, with a large percentage of the population relying on mobile devices.
The reliance is for various activities such as communication, entertainment, shopping, and productivity. There is a significant demand for mobile applications developed using multiexperience development platforms, as mobile usage continues to grow.
The platforms provide seamless and engaging user experiences across different devices and platforms. The United States is witnessing rapid digital transformation across industries, with businesses embracing digital technologies to enhance customer experiences, improve operational efficiency, and drive innovation.
The platforms play a crucial role in enabling organizations to develop and deploy multiexperience applications that meet the evolving needs of customers and users, boosting the market growth.
The multiexperience development platform market in the United Kingdom to expand at a CAGR of 23.2% through 2035. User experience is a critical factor in the success of digital products and services.
Businesses in the United Kingdom prioritize delivering intuitive, visually appealing, and seamless user experiences across all digital touchpoints. The multiexperience development platforms offer features and tools that enable developers to design and create engaging user interfaces, optimize usability, and enhance overall customer satisfaction.
The United Kingdom has a mature e-commerce market, with a significant portion of retail sales conducted online. Businesses are investing in mobile commerce applications to capture a larger share of the digital retail market, with the increasing popularity of mobile shopping.
The platforms provide the tools and capabilities necessary to develop feature rich and user friendly mobile commerce applications that drive sales and customer engagement.
Multiexperience development platform trends in China are taking a turn for the better. A 22.8% CAGR is forecast for the country from 2025 to 2035. China has a mobile first culture, with a large portion of internet users primarily accessing online services through mobile devices.
Businesses, as a result, prioritize mobile app development and invest in platforms that enable them to create mobile first and mobile optimized experiences that resonate with the preferences and behaviors of Chinese consumers.
The Chinese government has been actively promoting digital innovation and entrepreneurship through policies, incentives, and investments in infrastructure and technology development.
Government support for initiatives such as smart cities, digital healthcare, and industrial automation creates opportunities for multiexperience development platforms.
The multiexperience development platform market in Japan is poised to expand at a CAGR of 23.1% through 2035. Japanese developers seek platforms that support cross platform development, allowing them to build applications that run seamlessly on multiple devices and operating systems.
Cross platform development tools and frameworks enable developers to reduce development time, costs, and complexity while ensuring consistent user experiences across different platforms, driving adoption of platforms in Japan. Japan is investing in smart city initiatives and IoT infrastructure to improve urban living, enhance sustainability, and optimize resource utilization.
MXDPs that enable the development of IoT enabled applications for smart cities, transportation, energy management, and environmental monitoring are in demand in the Japanese market. The platforms help municipalities, businesses, and organizations leverage IoT data to make informed decisions and improve quality of life.
The multiexperience development platform market in Korea will expand at a CAGR of 24.0% through 2035. The fintech sector in Korea is experiencing rapid growth, driven by government support, regulatory reforms, and technological advancements.
The platforms enable fintech startups and financial institutions to develop innovative financial services, mobile banking apps, payment solutions, and digital wallets that cater to the needs of Korean consumers and businesses. The growing adoption of fintech solutions drives demand for MXDPs that facilitate the development of secure, reliable, and user friendly financial applications.
Korea is investing in smart manufacturing initiatives and Industry 4.0 technologies to enhance productivity, efficiency, and competitiveness in manufacturing sectors such as automotive, electronics, and semiconductor.
The platforms that support the development of industrial IoT applications, smart factory solutions, and digital twins enable Korean manufacturers to optimize operations, monitor equipment performance.
The below table highlights how platforms segment is leading the market in terms of component, and will account for a CAGR of 21.8% through 2035.
Based on deployment mode, the on premises segment is gaining heights and will to account for a CAGR of 21.6% through 2035.
| Category | CAGR through 2035 |
|---|---|
| Platforms | 21.8% |
| On Premises | 21.6% |
Based on component, the platforms segment will dominate the multiexperience development platform market. The multiexperience development platforms provide comprehensive toolsets, frameworks, and libraries that facilitate multiexperience development, including mobile app development, web development, IoT integration, AR/VR development, and AI/ML capabilities.
The toolsets empower developers to create feature rich and immersive experiences, attracting businesses seeking to deliver innovative digital solutions to their users.
Platforms offer developers a unified environment for building, deploying, and managing multiexperience applications across various channels and devices. The unified approach streamlines the development process, reduces complexity, and enhances productivity, accelerating the demand for platform solutions in the market.
By deployment mode, the on premises segment will dominate the multiexperience development platform market. In regions with stringent data sovereignty and privacy regulations, organizations prefer to keep sensitive data within their own premises to maintain control over data sovereignty and comply with data protection laws.
On premises solutions enable organizations to store and process data locally, addressing concerns related to data sovereignty, privacy, and cross border data transfer restrictions.
Many organizations, particularly those in highly regulated industries such as finance, healthcare, and government, have strict data security and compliance requirements that necessitate on premises deployment of software solutions.
On premises solutions offer greater control over data security and compliance, as organizations can manage and secure their data within their own infrastructure, minimizing the risk of data breaches and ensuring compliance with regulatory mandates.
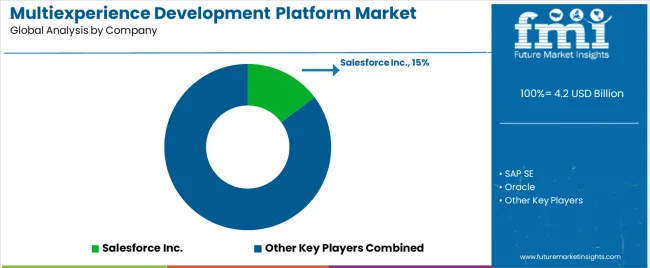
The multiexperience development platform market is characterized by intense competition among key players striving to maintain or enhance their market share through strategic initiatives, product innovation, and differentiation strategies.
Company Portfolio
| Attribute | Details |
|---|---|
| Estimated Market Size in 2025 | USD 4.2 billion |
| Projected Market Valuation in 2035 | USD 27.9 billion |
| Value-based CAGR 2025 to 2035 | 21.0% |
| Forecast Period | 2025 to 2035 |
| Historical Data Available for | 2020 to 2025 |
| Market Analysis | Value in USD billion |
| Key Regions Covered | North America; Latin America; Western Europe; Eastern Europe; South Asia and Pacific; East Asia; The Middle East & Africa |
| Key Market Segments Covered | Component, Deployment Mode, Enterprise Size, Industry Vertical, Region |
| Key Countries Profiled | The United States, Canada, Brazil, Mexico, Germany, France, France, Spain, Italy, Russia, Poland, Czech Republic, Romania, India, Bangladesh, Australia, New Zealand, China, Japan, South Korea, GCC countries, South Africa, Israel |
| Key Companies Profiled | Neptune Software; Pegasystems Inc.; Mendix Technology BV; Temenos; OutSystems; Salesforce Inc.; ServiceNow; GeneXus; Oracle; SAP SE |
The global multiexperience development platform market is estimated to be valued at USD 4.2 billion in 2025.
The market size for the multiexperience development platform market is projected to reach USD 27.9 billion by 2035.
The multiexperience development platform market is expected to grow at a 21.0% CAGR between 2025 and 2035.
The key product types in multiexperience development platform market are platforms and services.
In terms of deployment mode, cloud segment to command 61.3% share in the multiexperience development platform market in 2025.


Full Research Suite comprises of:
Market outlook & trends analysis
Interviews & case studies
Strategic recommendations
Vendor profiles & capabilities analysis
5-year forecasts
8 regions and 60+ country-level data splits
Market segment data splits
12 months of continuous data updates
DELIVERED AS:
PDF EXCEL ONLINE
Developmental and Epileptic Encephalopathies (DEE) Treatment Market Size and Share Forecast Outlook 2025 to 2035
IoT Development Kit Market Size and Share Forecast Outlook 2025 to 2035
Sensor Development Kit Market Size and Share Forecast Outlook 2025 to 2035
Low Code Development Platform Market Size and Share Forecast Outlook 2025 to 2035
Cell Line Development Market Analysis – Growth & Industry Outlook 2025 to 2035
Cell Line Development Services Market Growth – Trends & Forecast 2025 to 2035
Leadership Development Program Market Analysis - Size, Share, and Forecast 2025 to 2035
Examining Market Share Trends in Leadership Development Programs
Application Development and Modernization (ADM) Market Size and Share Forecast Outlook 2025 to 2035
Formulation Development Outsourcing Market Size and Share Forecast Outlook 2025 to 2035
Fiber Optic Development Tools Market
Research And Development (R&D) Analytics Market Size and Share Forecast Outlook 2025 to 2035
Viral Vector Development Market – Growth & Demand 2025 to 2035
IoT in Product Development Market Analysis - Growth & Forecast 2025 to 2035
Optoelectronic Development Tools Market
IoT Application Development Services Market Size and Share Forecast Outlook 2025 to 2035
Stable Cell Line Development Market Size and Share Forecast Outlook 2025 to 2035
Covid-19 Vaccine Development Tools Market - Growth & Forecast 2024 to 2034
Online Leadership Development Program Market Forecast and Outlook 2025 to 2035
Custom Leadership Development Program Market Growth, Trends and Forecast from 2025 to 2035

Thank you!
You will receive an email from our Business Development Manager. Please be sure to check your SPAM/JUNK folder too.
Chat With
MaRIA