Multi-foil Rotor Market Forecast and Outlook 2025 to 2035

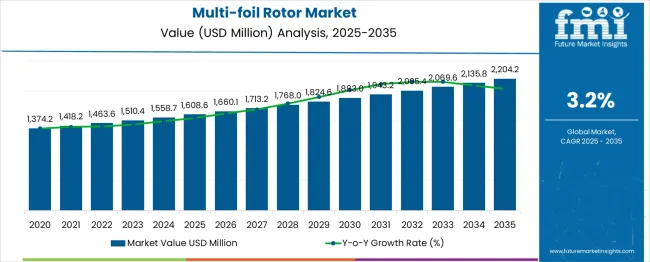
The global multi-foil rotor market is projected to grow from USD 1,608.6 million in 2025 to approximately USD 2,204.1 million by 2035, recording an absolute increase of USD 595.6 million over the forecast period. This translates into a total growth of 37.0%, with the market forecast to expand at a compound annual growth rate (CAGR) of 3.2% between 2025 and 2035. The overall market size is expected to grow by nearly 1.37X during the same period, supported by the rising adoption of advanced turbomachinery systems and increasing demand for high-efficiency rotating equipment across industrial applications.
Quick Stats for Multi-foil Rotor Market

  • Multi-foil Rotor Market Value (2025): USD 1,608.6 million
  • Multi-foil Rotor Market Forecast Value (2035): USD 2,204.1 million
  • Multi-foil Rotor Market Forecast CAGR: 3.2%
  • Leading Capacity/Size Class in Multi-foil Rotor Market: Medium (45.0%)
  • Key Growth Regions in Multi-foil Rotor Market: North America, Asia Pacific, and Europe
  • Top Key Players in Multi-foil Rotor Market: Calnetix Technologies, Capstone Green Energy, Doosan Enerbility, Honeywell Aerospace, Mitsubishi Heavy Industries, Mohawk Innovative Technology, Parker Aerospace, Rolls-Royce, SKF, TURBONIK GmbH

Multi Foil Rotor Market Market Value Analysis

Between 2025 and 2030, the multi-foil rotor market is projected to expand from USD 1,608.6 million to USD 1,883.0 million, resulting in a value increase of USD 274.4 million, which represents 46.1% of the total forecast growth for the decade. This phase of growth will be shaped by rising penetration of advanced turbomachinery in power generation facilities, increasing industrial automation requiring precision rotating equipment, and growing awareness among operators about the importance of high-efficiency rotor systems. Equipment manufacturers are expanding their multi-foil rotor capabilities to address the growing complexity of modern industrial applications.

From 2030 to 2035, the market is forecast to grow from USD 1,883.0 million to USD 2,204.1 million, adding another USD 321.2 million, which constitutes 53.9% of the overall ten-year expansion. This period is expected to be characterized by expansion of specialized rotor manufacturing capabilities, integration of advanced materials and coating technologies, and development of standardized performance protocols across different industrial applications. The growing adoption of sustainable energy systems and advanced manufacturing processes will drive demand for more sophisticated multi-foil rotor solutions and specialized technical expertise.

Multi-foil Rotor Market Key Takeaways

Between 2020 and 2025, the multi-foil rotor market experienced steady expansion from USD 1,403.9 million to USD 1,608.6 million, driven by increasing adoption of advanced turbomachinery in industrial applications and growing awareness of efficiency requirements in rotating equipment. The market developed as industrial facilities recognized the need for specialized rotor technologies to achieve optimal performance and reliability. Equipment manufacturers and end-users began emphasizing advanced multi-foil rotor systems to maintain operational efficiency and reduce maintenance costs.

Metric Value
Estimated Value in (2025E) USD 1,608.6 million
Forecast Value in (2035F) USD 2,204.1 million
Forecast CAGR (2025 to 2035) 3.2%

Why the Multi-foil Rotor Market is Growing?

Market expansion is being supported by the rapid increase in advanced industrial applications requiring high-precision rotating equipment and the corresponding need for specialized multi-foil rotor systems. Modern industrial facilities rely on precise rotor performance and advanced bearing technologies to ensure proper functioning of critical equipment including turbines, compressors, and high-speed machinery. Even minor improvements in rotor design can result in significant performance gains and operational cost reductions.

The growing complexity of industrial processes and increasing efficiency requirements are driving demand for professional multi-foil rotor solutions from certified manufacturers with appropriate expertise and quality standards. Industrial operators are increasingly requiring advanced rotor documentation and performance guarantees to maintain operational reliability and meet regulatory compliance. Technical specifications and manufacturer requirements are establishing standardized rotor performance criteria that require specialized materials and precision manufacturing processes.

Segmental Analysis

The market is segmented by product construction, capacity/size class, end-use sector, compliance/standard, and region. By product construction, the market is divided into standard-duty, heavy-duty/corrosion-resistant, and hygienic/cleanroom configurations. Based on capacity/size class, the market is categorized into small, medium, and large rotors. In terms of end-use sector, the market spans food & beverage processing, chemicals & petrochemicals, power generation & utilities, water & wastewater utilities, metals & mining, pulp & paper, automotive & transportation, electronics & semiconductors, oil & gas, and construction & building services. By compliance/standard, the market is classified into ISO/EN, ANSI/ASME, and customer/other specifications.
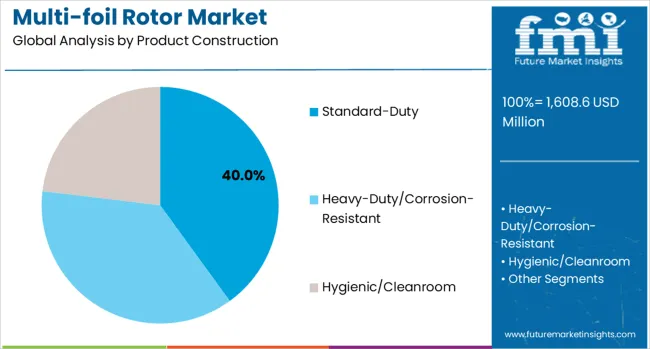
By Product Construction, Standard-Duty Segment Accounts for 40% Market Share

Multi Foil Rotor Market Analysis By Product Construction

The standard-duty construction segment is projected to account for 40% of the multi-foil rotor market in 2025, reflecting its widespread use across conventional industrial environments. These rotors are designed using proven materials and established manufacturing processes, ensuring dependable performance under normal operating conditions. Their ability to deliver reliable results in general-purpose applications makes them the default choice for most industries, particularly where specialized or heavy-duty configurations are unnecessary.

This segment benefits from cost-effectiveness, easy availability, and well-established design frameworks that simplify both procurement and maintenance. Multiple suppliers provide standardized models, ensuring consistency and broad accessibility across regions. Standard-duty rotors also offer compatibility with a wide range of equipment, reinforcing their versatility. By balancing durability with affordability, they remain the most attractive option for facilities looking to optimize rotating equipment investments without over-specifying system requirements.

By Capacity/Size Class, Medium Segment Accounts for 45% Market Share

Medium-capacity/size class rotors are expected to represent 45% of market demand in 2025, establishing themselves as the dominant category. These rotors deliver an optimal balance between performance and cost-effectiveness, making them suitable for diverse industrial applications. Medium-sized units are often deployed in facilities where equipment must combine efficiency, flexibility, and manageable operating costs. Their versatility allows them to support a broad range of process requirements, ensuring wide applicability.

The segment also benefits from advancements in rotor design that improve energy efficiency and reliability while maintaining reasonable manufacturing costs. Medium-sized rotors are favored in new facility installations as well as retrofit projects, where scalability and adaptability are critical. Growing industrial development worldwide, particularly in food processing, chemicals, and utilities, continues to fuel demand for medium-capacity solutions that can handle varying workloads while maintaining consistent performance.
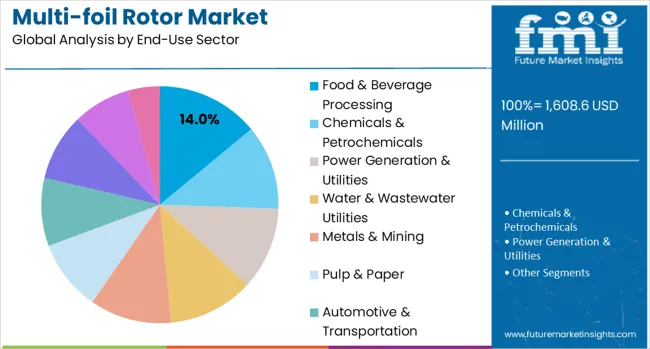
By End-Use Sector, Food & Beverage Processing Segment Accounts for 14% Market Share

Multi Foil Rotor Market Analysis By End Use Sector

The food and beverage processing sector is projected to account for 14% of the multi-foil rotor market in 2025, making it the largest single end-use application. Facilities in this industry require rotor systems that ensure contamination-free operation, precise speed control, and long-term reliability across multiple production lines. Stainless steel construction and hygienic designs are often essential to meet stringent safety and regulatory standards.

This segment is also driven by the rise of automation and advanced process equipment in modern food plants. Multi-foil rotors are integrated into mixers, conveyors, and packaging systems, where consistent performance is vital to maintaining product quality. With global demand for processed foods and beverages continuing to rise, food manufacturers are investing in rotor technologies that combine efficiency with compliance. These factors secure food and beverage as a key growth driver for the market.

By Compliance/Standard, ISO/EN Segment Accounts for 40% Market Share

The ISO/EN compliance segment is forecasted to hold 40% of the multi-foil rotor market in 2025, reflecting its role as the benchmark for international quality standards. These certifications provide assurance of performance, safety, and environmental responsibility, making them widely preferred by both equipment manufacturers and industrial operators. Facilities adopting ISO/EN-compliant rotors benefit from reduced regulatory risks and simplified global procurement processes.

For suppliers, adherence to ISO/EN standards enables access to international markets while ensuring compatibility across diverse applications. Standardized documentation, testing procedures, and service requirements further strengthen their appeal, particularly in industries where consistency is essential. As cross-border trade and multinational operations expand, demand for ISO/EN-certified equipment continues to grow. This ensures the segment’s dominance, reinforcing its role in maintaining global quality assurance for industrial rotating equipment.

What are the Drivers, Restraints, and Key Trends of the Multi-foil Rotor Market?

The multi-foil rotor market is advancing steadily due to increasing industrial automation and growing recognition of high-efficiency rotor system importance. However, the market faces challenges including high manufacturing costs, need for specialized materials and precision manufacturing processes, and varying performance requirements across different industrial applications. Standardization efforts and quality certification programs continue to influence manufacturing quality and market development patterns.

Expansion of Advanced Materials and Manufacturing Technologies

The growing deployment of advanced materials and precision manufacturing techniques is enabling enhanced rotor performance characteristics, improved operational reliability, and extended service life. Advanced materials including specialized alloys and surface coatings provide superior performance and reduced maintenance requirements for demanding industrial applications. These technologies are particularly valuable for high-temperature and corrosive environment applications that require exceptional durability and reliability.

Integration of Digital Monitoring and Predictive Maintenance Systems

Modern multi-foil rotor applications are incorporating advanced monitoring systems and predictive maintenance technologies that improve operational efficiency and reduce unplanned downtime. Integration of sensor technologies and real-time performance monitoring enables more precise operational control and comprehensive maintenance planning. Advanced monitoring systems also support optimization of next-generation rotor technologies including active magnetic bearings and intelligent control systems.
Analysis of Multi-foil Rotor Market by Key Country

Multi Foil Rotor Market Cagr Analysis By Country

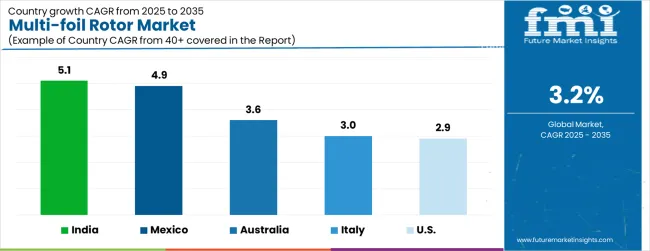
Countries CAGR (2025-2035)
India 5.1%
Mexico 4.9%
Australia 3.6%
Italy 3.0%
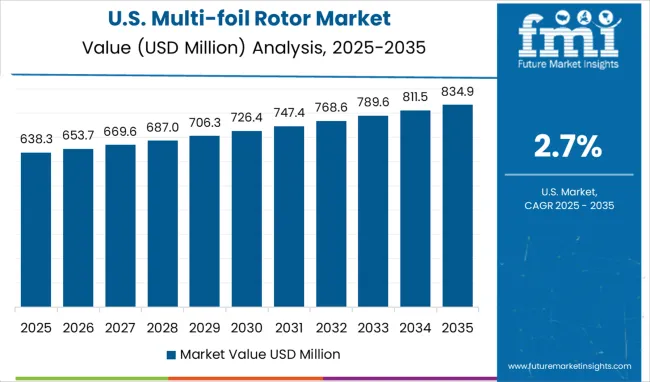
United States 2.9%

The multi-foil rotor market is growing rapidly, with India leading at a 5.1% CAGR through 2035, driven by strong industrial expansion, infrastructure development, and expanding manufacturing capabilities. Mexico follows at 4.9%, supported by rising industrial automation in manufacturing facilities and increasing adoption of advanced turbomachinery systems. Australia grows steadily at 3.6%, integrating advanced rotor technologies into its established mining and energy sectors. Italy records 3.0%, emphasizing precision manufacturing, quality standards, and specialized industrial applications. The USA shows steady growth at 2.9%, focusing on technological innovation, performance optimization, and advanced manufacturing processes. Overall, India and Mexico emerge as the leading drivers of global multi-foil rotor market expansion.

The report covers an in-depth analysis of 40+ countries; five top-performing countries are highlighted below.

India Leads Global Market Growth with Industrial Development

Revenue from multi-foil rotors in India is projected to exhibit the highest growth rate with a CAGR of 5.1% through 2035, driven by rapid industrial expansion and increasing adoption of advanced manufacturing technologies in domestic production facilities. The country's expanding industrial infrastructure and growing process industries are creating significant demand for high-performance rotating equipment. Major industrial manufacturers and equipment suppliers are establishing comprehensive rotor manufacturing capabilities to support the growing population of advanced industrial facilities across urban and rural markets.

  • Government industrial development programs are supporting establishment of advanced manufacturing facilities and technical training programs, driving demand for high-performance rotor systems throughout major industrial regions.
  • Industrial modernization initiatives are facilitating development of specialized rotor manufacturing facilities and quality certification programs that enhance production capability and technical expertise across industrial networks.

Mexico Demonstrates Strong Market Potential with Manufacturing Growth

Revenue from multi-foil rotors in Mexico is expanding at a CAGR of 4.9%, supported by increasing industrial automation in manufacturing facilities and growing adoption of advanced process equipment technologies. The country's expanding manufacturing sector and increasing industrial investment are driving demand for professional rotor solutions. Industrial facilities and specialized equipment suppliers are gradually establishing capabilities to serve the growing population of advanced manufacturing operations.

  • Manufacturing industry growth and industrial facility development are creating opportunities for specialized rotor manufacturers that can support diverse industrial technologies and application requirements.
  • Professional training and certification programs are developing technical expertise among manufacturing providers, enabling comprehensive rotor solutions that meet international quality and performance standards nationwide.

Australia Maintains Steady Growth with Resource Sector Development

Revenue from multi-foil rotors in Australia is growing at a CAGR of 3.6%, driven by established mining and energy sectors and growing recognition of advanced rotor technology importance in critical applications. The country's mature industrial infrastructure is gradually integrating advanced rotor capabilities to serve modern equipment requirements. Mining operations and energy facilities are investing in rotor technologies and maintenance programs to address growing performance demands.

  • Resource sector modernization is facilitating adoption of advanced rotor technologies that support comprehensive industrial capabilities across major mining and energy production regions.
  • Professional service development programs are enhancing technical capabilities among industrial facilities, enabling specialized rotor applications that meet evolving equipment technology requirements and operational expectations.

Italy Focuses on Precision Manufacturing and Technical Excellence

Demand for multi-foil rotors in Italy is projected to grow at a CAGR of 3.0%, supported by the country's emphasis on precision manufacturing and advanced industrial technology development. Italian industrial manufacturers are implementing comprehensive rotor capabilities that meet stringent quality standards and application specifications. The market is characterized by focus on technical excellence, advanced materials integration, and compliance with comprehensive industrial quality regulations.
  • Industrial manufacturing investments are prioritizing advanced rotor technologies that demonstrate superior precision and reliability while meeting Italian industrial quality and performance standards.
  • Professional certification programs are ensuring comprehensive technical expertise among manufacturers, enabling specialized rotor solutions that support diverse industrial technologies and application requirements.

United States Emphasizes Innovation and Performance Optimization

Multi Foil Rotor Market Country Value Analysis

Demand for multi-foil rotors in the USA is expanding at a CAGR of 2.9%, driven by technological innovation and growing emphasis on performance optimization across industrial applications. Large industrial networks and specialized equipment manufacturers are establishing comprehensive rotor capabilities to serve diverse application needs. The market benefits from advanced research and development programs and manufacturer requirements for performance documentation and quality compliance following installation and commissioning activities.
  • Industrial equipment consolidation is enabling standardized rotor solution delivery across multiple facilities, providing consistent performance quality and comprehensive coverage throughout regional markets.
  • Professional development and certification programs are advancing specialized technical expertise among manufacturers, enabling comprehensive rotor capabilities that support evolving industrial technology requirements.

Japan Market Analysis by Product Construction

Multi Foil Rotor Market Japan Market Share Analysis By Product Construction

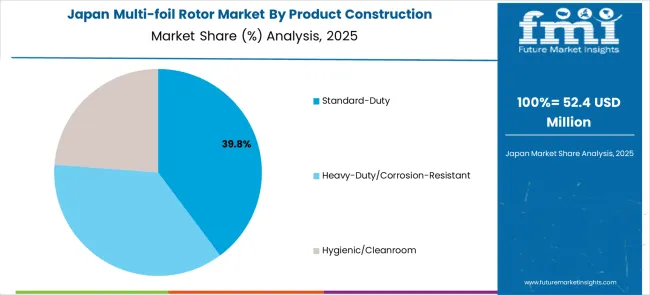
In Japan, the multi-foil rotor market is largely driven by power generation applications, which account for 45% of total service revenues in 2025. The high penetration of advanced turbomachinery in the domestic power sector and the stringent performance protocols mandated for critical rotating equipment are key contributing factors. Petrochemical applications follow with a 30% share, primarily in refining and chemical processing facilities that integrate precision rotating systems. Other industrial applications contribute 25% as advanced rotor adoption across diverse sectors continues to expand.
  • Power generation facilities continue to drive demand for high-performance rotor systems
  • Increasing integration of advanced turbomachinery in petrochemical processing facilities
  • Growing adoption of precision rotor technologies across diverse industrial applications
  • Industrial facility modernization driving comprehensive rotor system upgrades

Europe Market Split by Country

Multi Foil Rotor Market Europe Country Market Share Analysis, 2025 & 2035

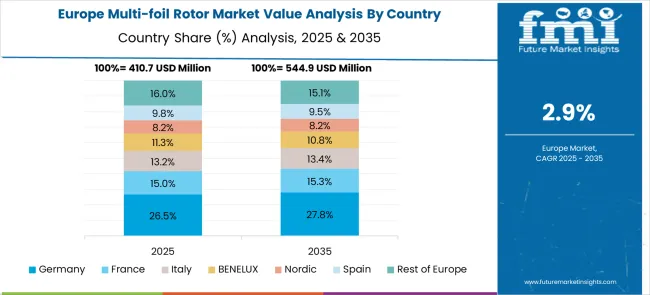
The European multi-foil rotor market demonstrates advanced development across major economies with the UK leading through its aerospace engineering expertise and turbomachinery innovation, supported by companies like Rolls-Royce (microturbines/R&D) and SKF pioneering cutting-edge rotor technologies for high-speed applications. Germany shows significant strength through TURBONIK GmbH, leveraging precision manufacturing capabilities and advanced materials engineering for specialized rotor solutions. The UK contributes through aerospace industry leadership and research excellence, while international players like Honeywell Aerospace and Parker Aerospace establish strong European presence.

France and Italy exhibit expanding adoption in power generation and industrial applications, driven by energy transition requirements and advanced manufacturing needs. Nordic countries emphasize sustainable energy solutions and high-efficiency turbomachinery, while Eastern European markets show growing interest in modern power generation infrastructure. The market benefits from strict performance standards, advanced materials research, and the region's leadership in turbomachinery technology, positioning Europe as a key innovation center for next-generation multi-foil rotor solutions across aerospace, power generation, and industrial applications requiring high-speed rotation, precision engineering, and advanced materials capabilities.
Competitive Landscape of Multi-foil Rotor Market

Multi Foil Rotor Market Analysis By Company

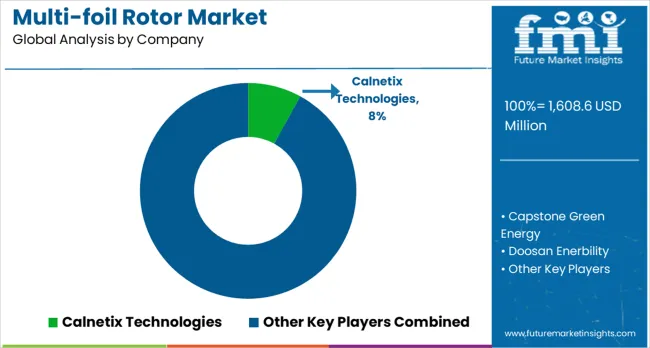
The multi-foil rotor market is defined by competition among specialized manufacturers, industrial equipment suppliers, and advanced technology companies. Companies are investing in advanced materials research, precision manufacturing capabilities, standardized quality procedures, and technical expertise development to deliver reliable, efficient, and cost-effective rotor solutions. Strategic partnerships, technological innovation, and geographic expansion are central to strengthening product portfolios and market presence.

Calnetix Technologies, USA-based, offers advanced multi-foil rotor solutions with a focus on magnetic bearing systems, high-speed applications, and technical innovation. Capstone Green Energy, operating globally, provides comprehensive rotor systems integrated with microturbine technology and distributed energy solutions. Doosan Enerbility, South Korea, delivers technologically advanced rotor systems with standardized procedures and industrial integration. Honeywell Aerospace, USA, emphasizes aerospace-grade rotor technologies and high-reliability applications.

Mitsubishi Heavy Industries, Japan, offers rotor solutions integrated into comprehensive industrial equipment operations. Mohawk Innovative Technology, USA, provides specialized multi-foil bearing systems with advanced technical capabilities. Parker Aerospace, USA delivers rotor technologies for aerospace and industrial applications. Rolls-Royce, SKF, and TURBONIK GmbH offer specialized rotor expertise, standardized procedures, and service reliability across global and regional networks.

Key Players in the Multi-foil Rotor Market

  • Calnetix Technologies
  • Capstone Green Energy
  • Doosan Enerbility
  • Honeywell Aerospace
  • Mitsubishi Heavy Industries
  • Mohawk Innovative Technology
  • Parker Aerospace
  • Rolls-Royce (microturbines/R&D)
  • SKF
  • TURBONIK GmbH

Scope of the Report

Items Values
Quantitative Units (2025) USD Million
Product Construction Standard-Duty, Heavy-Duty/Corrosion-Resistant, Hygienic/Cleanroom
Capacity/Size Class Small, Medium, Large
End-Use Sector Food & Beverage Processing, Chemicals & Petrochemicals, Power Generation & Utilities, Water & Wastewater Utilities, Metals & Mining, Pulp & Paper, Automotive & Transportation, Electronics & Semiconductors, Oil & Gas, Construction & Building Services
Compliance/Standard ISO/EN, ANSI/ASME, Customer/Other
Regions Covered North America, Europe, East Asia, South Asia & Pacific, Latin America, Middle East & Africa
Countries Covered United States, Canada, United Kingdom, Germany, France, China, Japan, South Korea, Brazil, Australia and 40+ countries
Key Companies Profiled Calnetix Technologies, Capstone Green Energy, Doosan Enerbility, Honeywell Aerospace, Mitsubishi Heavy Industries, Mohawk Innovative Technology, Parker Aerospace, Rolls-Royce, SKF, and TURBONIK GmbH
Additional Attributes Dollar sales by rotor size and foil configuration, regional demand trends, competitive landscape, buyer preferences for high-efficiency versus cost-optimized designs, integration with turbomachinery platforms, innovations in advanced alloys, aerodynamic optimization, and vibration-reduction technologies

Multi-foil Rotor Market by Segments

Product Construction:

  • Standard-Duty
  • Heavy-Duty/Corrosion-Resistant
  • Hygienic/Cleanroom

Capacity/Size Class:

  • Small
  • Medium
  • Large

End-Use Sector:

  • Food & Beverage Processing
  • Chemicals & Petrochemicals
  • Power Generation & Utilities
  • Water & Wastewater Utilities
  • Metals & Mining
  • Pulp & Paper
  • Automotive & Transportation
  • Electronics & Semiconductors
  • Oil & Gas (Up/Downstream)
  • Construction & Building Services

Compliance/Standard:

  • ISO/EN
  • ANSI/ASME
  • Customer/Other

Region:

  • North America
    • United States
    • Canada
    • Mexico
  • Europe
    • Germany
    • United Kingdom
    • France
    • Italy
    • Spain
    • Nordic
    • Rest of Europe
  • East Asia
    • China
    • Japan
    • South Korea
  • South Asia & Pacific
    • India
    • ASEAN
    • Australia & New Zealand
    • Rest of South Asia & Pacific
  • Latin America
    • Brazil
    • Chile
    • Rest of Latin America
  • Middle East & Africa
    • Kingdom of Saudi Arabia
    • Other GCC Countries
    • Turkey
    • South Africa
    • Other African Union
    • Rest of Middle East & Africa

Table of Content

  1. Executive Summary
    • Global Market Outlook
    • Demand-side Trends
    • Supply-side Trends
    • Technology Roadmap Analysis
    • Analysis and Recommendations
  2. Market Overview
    • Market Coverage / Taxonomy
    • Market Definition / Scope / Limitations
  3. Market Background
    • Market Dynamics
      • Drivers
      • Restraints
      • Opportunity
      • Trends
    • Scenario Forecast
      • Demand in Optimistic Scenario
      • Demand in Likely Scenario
      • Demand in Conservative Scenario
    • Opportunity Map Analysis
    • Product Life Cycle Analysis
    • Supply Chain Analysis
    • Investment Feasibility Matrix
    • Value Chain Analysis
    • PESTLE and Porter’s Analysis
    • Regulatory Landscape
    • Regional Parent Market Outlook
    • Production and Consumption Statistics
    • Import and Export Statistics
  4. Global Market Analysis 2020-2024 and Forecast, 2025-2035
    • Historical Market Size Value (USD Million) Analysis, 2020-2024
    • Current and Future Market Size Value (USD Million) Projections, 2025-2035
      • Y-o-Y Growth Trend Analysis
      • Absolute $ Opportunity Analysis
  5. Global Market Pricing Analysis 2020-2024 and Forecast 2025-2035
  6. Global Market Analysis 2020-2024 and Forecast 2025-2035, By Product Construction
    • Introduction / Key Findings
    • Historical Market Size Value (USD Million) Analysis By Product Construction , 2020-2024
    • Current and Future Market Size Value (USD Million) Analysis and Forecast By Product Construction , 2025-2035
      • Standard-Duty
      • Heavy-Duty/Corrosion-Resistant
      • Hygienic/Cleanroom
      • Special mission
      • Others
    • Y-o-Y Growth Trend Analysis By Product Construction , 2020-2024
    • Absolute $ Opportunity Analysis By Product Construction , 2025-2035
  7. Global Market Analysis 2020-2024 and Forecast 2025-2035, By Capacity/Size Class
    • Introduction / Key Findings
    • Historical Market Size Value (USD Million) Analysis By Capacity/Size Class, 2020-2024
    • Current and Future Market Size Value (USD Million) Analysis and Forecast By Capacity/Size Class, 2025-2035
      • Medium
      • Small
      • Large
      • Water & Wastewater Utilities
      • Metals & Mining
      • Pulp & Paper
      • Automotive & Transportation
      • Electronics & Semiconductors
      • Oil & Gas (Up/Downstream)
      • Construction & Building Services
    • Y-o-Y Growth Trend Analysis By Capacity/Size Class, 2020-2024
    • Absolute $ Opportunity Analysis By Capacity/Size Class, 2025-2035
  8. Global Market Analysis 2020-2024 and Forecast 2025-2035, By End-Use Sector
    • Introduction / Key Findings
    • Historical Market Size Value (USD Million) Analysis By End-Use Sector, 2020-2024
    • Current and Future Market Size Value (USD Million) Analysis and Forecast By End-Use Sector, 2025-2035
      • Food & Beverage Processing
      • Chemicals & Petrochemicals
      • Power Generation & Utilities
      • Water & Wastewater Utilities
      • Metals & Mining
      • Pulp & Paper
      • Automotive & Transportation
      • Electronics & Semiconductors
      • Oil & Gas (Up/Downstream)
      • Construction & Building Services
    • Y-o-Y Growth Trend Analysis By End-Use Sector, 2020-2024
    • Absolute $ Opportunity Analysis By End-Use Sector, 2025-2035
  9. Global Market Analysis 2020-2024 and Forecast 2025-2035, By Compliance/Standard
    • Introduction / Key Findings
    • Historical Market Size Value (USD Million) Analysis By Compliance/Standard, 2020-2024
    • Current and Future Market Size Value (USD Million) Analysis and Forecast By Compliance/Standard, 2025-2035
      • ISO/EN
      • ANSI/ASME
      • Customer/Other
      • Healthcare Facilities
      • Government & Disaster Relief
      • Retail & Malls
    • Y-o-Y Growth Trend Analysis By Compliance/Standard, 2020-2024
    • Absolute $ Opportunity Analysis By Compliance/Standard, 2025-2035
  10. Global Market Analysis 2020-2024 and Forecast 2025-2035, By Region
    • Introduction
    • Historical Market Size Value (USD Million) Analysis By Region, 2020-2024
    • Current Market Size Value (USD Million) Analysis and Forecast By Region, 2025-2035
      • North America
      • Latin America
      • Western Europe
      • Eastern Europe
      • East Asia
      • South Asia and Pacific
      • Middle East & Africa
    • Market Attractiveness Analysis By Region
  11. North America Market Analysis 2020-2024 and Forecast 2025-2035, By Country
    • Historical Market Size Value (USD Million) Trend Analysis By Market Taxonomy, 2020-2024
    • Market Size Value (USD Million) Forecast By Market Taxonomy, 2025-2035
      • By Country
        • USA
        • Canada
        • Mexico
      • By Product Construction
      • By Capacity/Size Class
      • By End-Use Sector
      • By Compliance/Standard
    • Market Attractiveness Analysis
      • By Country
      • By Product Construction
      • By Capacity/Size Class
      • By End-Use Sector
      • By Compliance/Standard
    • Key Takeaways
  12. Latin America Market Analysis 2020-2024 and Forecast 2025-2035, By Country
    • Historical Market Size Value (USD Million) Trend Analysis By Market Taxonomy, 2020-2024
    • Market Size Value (USD Million) Forecast By Market Taxonomy, 2025-2035
      • By Country
        • Brazil
        • Chile
        • Rest of Latin America
      • By Product Construction
      • By Capacity/Size Class
      • By End-Use Sector
      • By Compliance/Standard
    • Market Attractiveness Analysis
      • By Country
      • By Product Construction
      • By Capacity/Size Class
      • By End-Use Sector
      • By Compliance/Standard
    • Key Takeaways
  13. Western Europe Market Analysis 2020-2024 and Forecast 2025-2035, By Country
    • Historical Market Size Value (USD Million) Trend Analysis By Market Taxonomy, 2020-2024
    • Market Size Value (USD Million) Forecast By Market Taxonomy, 2025-2035
      • By Country
        • Germany
        • UK
        • Italy
        • Spain
        • France
        • Nordic
        • BENELUX
        • Rest of Western Europe
      • By Product Construction
      • By Capacity/Size Class
      • By End-Use Sector
      • By Compliance/Standard
    • Market Attractiveness Analysis
      • By Country
      • By Product Construction
      • By Capacity/Size Class
      • By End-Use Sector
      • By Compliance/Standard
    • Key Takeaways
  14. Eastern Europe Market Analysis 2020-2024 and Forecast 2025-2035, By Country
    • Historical Market Size Value (USD Million) Trend Analysis By Market Taxonomy, 2020-2024
    • Market Size Value (USD Million) Forecast By Market Taxonomy, 2025-2035
      • By Country
        • Russia
        • Poland
        • Hungary
        • Balkan & Baltic
        • Rest of Eastern Europe
      • By Product Construction
      • By Capacity/Size Class
      • By End-Use Sector
      • By Compliance/Standard
    • Market Attractiveness Analysis
      • By Country
      • By Product Construction
      • By Capacity/Size Class
      • By End-Use Sector
      • By Compliance/Standard
    • Key Takeaways
  15. East Asia Market Analysis 2020-2024 and Forecast 2025-2035, By Country
    • Historical Market Size Value (USD Million) Trend Analysis By Market Taxonomy, 2020-2024
    • Market Size Value (USD Million) Forecast By Market Taxonomy, 2025-2035
      • By Country
        • China
        • Japan
        • South Korea
      • By Product Construction
      • By Capacity/Size Class
      • By End-Use Sector
      • By Compliance/Standard
    • Market Attractiveness Analysis
      • By Country
      • By Product Construction
      • By Capacity/Size Class
      • By End-Use Sector
      • By Compliance/Standard
    • Key Takeaways
  16. South Asia and Pacific Market Analysis 2020-2024 and Forecast 2025-2035, By Country
    • Historical Market Size Value (USD Million) Trend Analysis By Market Taxonomy, 2020-2024
    • Market Size Value (USD Million) Forecast By Market Taxonomy, 2025-2035
      • By Country
        • India
        • ASEAN
        • Australia & New Zealand
        • Rest of South Asia and Pacific
      • By Product Construction
      • By Capacity/Size Class
      • By End-Use Sector
      • By Compliance/Standard
    • Market Attractiveness Analysis
      • By Country
      • By Product Construction
      • By Capacity/Size Class
      • By End-Use Sector
      • By Compliance/Standard
    • Key Takeaways
  17. Middle East & Africa Market Analysis 2020-2024 and Forecast 2025-2035, By Country
    • Historical Market Size Value (USD Million) Trend Analysis By Market Taxonomy, 2020-2024
    • Market Size Value (USD Million) Forecast By Market Taxonomy, 2025-2035
      • By Country
        • Kingdom of Saudi Arabia
        • Other GCC Countries
        • Turkiye
        • South Africa
        • Other African Union
        • Rest of Middle East & Africa
      • By Product Construction
      • By Capacity/Size Class
      • By End-Use Sector
      • By Compliance/Standard
    • Market Attractiveness Analysis
      • By Country
      • By Product Construction
      • By Capacity/Size Class
      • By End-Use Sector
      • By Compliance/Standard
    • Key Takeaways
  18. Key Countries Market Analysis
    • USA
      • Pricing Analysis
      • Market Share Analysis, 2024
        • By Product Construction
        • By Capacity/Size Class
        • By End-Use Sector
        • By Compliance/Standard
    • Canada
      • Pricing Analysis
      • Market Share Analysis, 2024
        • By Product Construction
        • By Capacity/Size Class
        • By End-Use Sector
        • By Compliance/Standard
    • Mexico
      • Pricing Analysis
      • Market Share Analysis, 2024
        • By Product Construction
        • By Capacity/Size Class
        • By End-Use Sector
        • By Compliance/Standard
    • Brazil
      • Pricing Analysis
      • Market Share Analysis, 2024
        • By Product Construction
        • By Capacity/Size Class
        • By End-Use Sector
        • By Compliance/Standard
    • Chile
      • Pricing Analysis
      • Market Share Analysis, 2024
        • By Product Construction
        • By Capacity/Size Class
        • By End-Use Sector
        • By Compliance/Standard
    • Germany
      • Pricing Analysis
      • Market Share Analysis, 2024
        • By Product Construction
        • By Capacity/Size Class
        • By End-Use Sector
        • By Compliance/Standard
    • UK
      • Pricing Analysis
      • Market Share Analysis, 2024
        • By Product Construction
        • By Capacity/Size Class
        • By End-Use Sector
        • By Compliance/Standard
    • Italy
      • Pricing Analysis
      • Market Share Analysis, 2024
        • By Product Construction
        • By Capacity/Size Class
        • By End-Use Sector
        • By Compliance/Standard
    • Spain
      • Pricing Analysis
      • Market Share Analysis, 2024
        • By Product Construction
        • By Capacity/Size Class
        • By End-Use Sector
        • By Compliance/Standard
    • France
      • Pricing Analysis
      • Market Share Analysis, 2024
        • By Product Construction
        • By Capacity/Size Class
        • By End-Use Sector
        • By Compliance/Standard
    • India
      • Pricing Analysis
      • Market Share Analysis, 2024
        • By Product Construction
        • By Capacity/Size Class
        • By End-Use Sector
        • By Compliance/Standard
    • ASEAN
      • Pricing Analysis
      • Market Share Analysis, 2024
        • By Product Construction
        • By Capacity/Size Class
        • By End-Use Sector
        • By Compliance/Standard
    • Australia & New Zealand
      • Pricing Analysis
      • Market Share Analysis, 2024
        • By Product Construction
        • By Capacity/Size Class
        • By End-Use Sector
        • By Compliance/Standard
    • China
      • Pricing Analysis
      • Market Share Analysis, 2024
        • By Product Construction
        • By Capacity/Size Class
        • By End-Use Sector
        • By Compliance/Standard
    • Japan
      • Pricing Analysis
      • Market Share Analysis, 2024
        • By Product Construction
        • By Capacity/Size Class
        • By End-Use Sector
        • By Compliance/Standard
    • South Korea
      • Pricing Analysis
      • Market Share Analysis, 2024
        • By Product Construction
        • By Capacity/Size Class
        • By End-Use Sector
        • By Compliance/Standard
    • Russia
      • Pricing Analysis
      • Market Share Analysis, 2024
        • By Product Construction
        • By Capacity/Size Class
        • By End-Use Sector
        • By Compliance/Standard
    • Poland
      • Pricing Analysis
      • Market Share Analysis, 2024
        • By Product Construction
        • By Capacity/Size Class
        • By End-Use Sector
        • By Compliance/Standard
    • Hungary
      • Pricing Analysis
      • Market Share Analysis, 2024
        • By Product Construction
        • By Capacity/Size Class
        • By End-Use Sector
        • By Compliance/Standard
    • Kingdom of Saudi Arabia
      • Pricing Analysis
      • Market Share Analysis, 2024
        • By Product Construction
        • By Capacity/Size Class
        • By End-Use Sector
        • By Compliance/Standard
    • Turkiye
      • Pricing Analysis
      • Market Share Analysis, 2024
        • By Product Construction
        • By Capacity/Size Class
        • By End-Use Sector
        • By Compliance/Standard
    • South Africa
      • Pricing Analysis
      • Market Share Analysis, 2024
        • By Product Construction
        • By Capacity/Size Class
        • By End-Use Sector
        • By Compliance/Standard
  19. Market Structure Analysis
    • Competition Dashboard
    • Competition Benchmarking
    • Market Share Analysis of Top Players
      • By Regional
      • By Product Construction
      • By Capacity/Size Class
      • By End-Use Sector
      • By Compliance/Standard
  20. Competition Analysis
    • Competition Deep Dive
      • Calnetix Technologies
        • Overview
        • Product Portfolio
        • Profitability by Market Segments (Product/Age /Sales Channel/Region)
        • Sales Footprint
        • Strategy Overview
          • Marketing Strategy
          • Product Strategy
          • Channel Strategy
      • Capstone Green Energy
      • Doosan Enerbility
      • Honeywell Aerospace
      • Mitsubishi Heavy Industries
      • Mohawk Innovative Technology
      • Parker Aerospace
      • Rolls‑Royce (microturbines/R&D)
      • SKF
      • TURBONIK GmbH
  21. Assumptions & Acronyms Used
  22. Research Methodology

List of Tables

  • Table 1: Global Market Value (USD Million) Forecast by Region, 2020-2035
  • Table 2: Global Market Value (USD Million) Forecast by Product Construction , 2020-2035
  • Table 3: Global Market Value (USD Million) Forecast by Capacity/Size Class, 2020-2035
  • Table 4: Global Market Value (USD Million) Forecast by End-Use Sector, 2020-2035
  • Table 5: Global Market Value (USD Million) Forecast by Compliance/Standard, 2020-2035
  • Table 6: North America Market Value (USD Million) Forecast by Country, 2020-2035
  • Table 7: North America Market Value (USD Million) Forecast by Product Construction , 2020-2035
  • Table 8: North America Market Value (USD Million) Forecast by Capacity/Size Class, 2020-2035
  • Table 9: North America Market Value (USD Million) Forecast by End-Use Sector, 2020-2035
  • Table 10: North America Market Value (USD Million) Forecast by Compliance/Standard, 2020-2035
  • Table 11: Latin America Market Value (USD Million) Forecast by Country, 2020-2035
  • Table 12: Latin America Market Value (USD Million) Forecast by Product Construction , 2020-2035
  • Table 13: Latin America Market Value (USD Million) Forecast by Capacity/Size Class, 2020-2035
  • Table 14: Latin America Market Value (USD Million) Forecast by End-Use Sector, 2020-2035
  • Table 15: Latin America Market Value (USD Million) Forecast by Compliance/Standard, 2020-2035
  • Table 16: Western Europe Market Value (USD Million) Forecast by Country, 2020-2035
  • Table 17: Western Europe Market Value (USD Million) Forecast by Product Construction , 2020-2035
  • Table 18: Western Europe Market Value (USD Million) Forecast by Capacity/Size Class, 2020-2035
  • Table 19: Western Europe Market Value (USD Million) Forecast by End-Use Sector, 2020-2035
  • Table 20: Western Europe Market Value (USD Million) Forecast by Compliance/Standard, 2020-2035
  • Table 21: Eastern Europe Market Value (USD Million) Forecast by Country, 2020-2035
  • Table 22: Eastern Europe Market Value (USD Million) Forecast by Product Construction , 2020-2035
  • Table 23: Eastern Europe Market Value (USD Million) Forecast by Capacity/Size Class, 2020-2035
  • Table 24: Eastern Europe Market Value (USD Million) Forecast by End-Use Sector, 2020-2035
  • Table 25: Eastern Europe Market Value (USD Million) Forecast by Compliance/Standard, 2020-2035
  • Table 26: East Asia Market Value (USD Million) Forecast by Country, 2020-2035
  • Table 27: East Asia Market Value (USD Million) Forecast by Product Construction , 2020-2035
  • Table 28: East Asia Market Value (USD Million) Forecast by Capacity/Size Class, 2020-2035
  • Table 29: East Asia Market Value (USD Million) Forecast by End-Use Sector, 2020-2035
  • Table 30: East Asia Market Value (USD Million) Forecast by Compliance/Standard, 2020-2035
  • Table 31: South Asia and Pacific Market Value (USD Million) Forecast by Country, 2020-2035
  • Table 32: South Asia and Pacific Market Value (USD Million) Forecast by Product Construction , 2020-2035
  • Table 33: South Asia and Pacific Market Value (USD Million) Forecast by Capacity/Size Class, 2020-2035
  • Table 34: South Asia and Pacific Market Value (USD Million) Forecast by End-Use Sector, 2020-2035
  • Table 35: South Asia and Pacific Market Value (USD Million) Forecast by Compliance/Standard, 2020-2035
  • Table 36: Middle East & Africa Market Value (USD Million) Forecast by Country, 2020-2035
  • Table 37: Middle East & Africa Market Value (USD Million) Forecast by Product Construction , 2020-2035
  • Table 38: Middle East & Africa Market Value (USD Million) Forecast by Capacity/Size Class, 2020-2035
  • Table 39: Middle East & Africa Market Value (USD Million) Forecast by End-Use Sector, 2020-2035
  • Table 40: Middle East & Africa Market Value (USD Million) Forecast by Compliance/Standard, 2020-2035

List of Figures

  • Figure 1: Global Market Pricing Analysis
  • Figure 2: Global Market Value (USD Million) Forecast 2020-2035
  • Figure 3: Global Market Value Share and BPS Analysis by Product Construction , 2025 and 2035
  • Figure 4: Global Market Y-o-Y Growth Comparison by Product Construction , 2025-2035
  • Figure 5: Global Market Attractiveness Analysis by Product Construction
  • Figure 6: Global Market Value Share and BPS Analysis by Capacity/Size Class, 2025 and 2035
  • Figure 7: Global Market Y-o-Y Growth Comparison by Capacity/Size Class, 2025-2035
  • Figure 8: Global Market Attractiveness Analysis by Capacity/Size Class
  • Figure 9: Global Market Value Share and BPS Analysis by End-Use Sector, 2025 and 2035
  • Figure 10: Global Market Y-o-Y Growth Comparison by End-Use Sector, 2025-2035
  • Figure 11: Global Market Attractiveness Analysis by End-Use Sector
  • Figure 12: Global Market Value Share and BPS Analysis by Compliance/Standard, 2025 and 2035
  • Figure 13: Global Market Y-o-Y Growth Comparison by Compliance/Standard, 2025-2035
  • Figure 14: Global Market Attractiveness Analysis by Compliance/Standard
  • Figure 15: Global Market Value (USD Million) Share and BPS Analysis by Region, 2025 and 2035
  • Figure 16: Global Market Y-o-Y Growth Comparison by Region, 2025-2035
  • Figure 17: Global Market Attractiveness Analysis by Region
  • Figure 18: North America Market Incremental Dollar Opportunity, 2025-2035
  • Figure 19: Latin America Market Incremental Dollar Opportunity, 2025-2035
  • Figure 20: Western Europe Market Incremental Dollar Opportunity, 2025-2035
  • Figure 21: Eastern Europe Market Incremental Dollar Opportunity, 2025-2035
  • Figure 22: East Asia Market Incremental Dollar Opportunity, 2025-2035
  • Figure 23: South Asia and Pacific Market Incremental Dollar Opportunity, 2025-2035
  • Figure 24: Middle East & Africa Market Incremental Dollar Opportunity, 2025-2035
  • Figure 25: North America Market Value Share and BPS Analysis by Country, 2025 and 2035
  • Figure 26: North America Market Value Share and BPS Analysis by Product Construction , 2025 and 2035
  • Figure 27: North America Market Y-o-Y Growth Comparison by Product Construction , 2025-2035
  • Figure 28: North America Market Attractiveness Analysis by Product Construction
  • Figure 29: North America Market Value Share and BPS Analysis by Capacity/Size Class, 2025 and 2035
  • Figure 30: North America Market Y-o-Y Growth Comparison by Capacity/Size Class, 2025-2035
  • Figure 31: North America Market Attractiveness Analysis by Capacity/Size Class
  • Figure 32: North America Market Value Share and BPS Analysis by End-Use Sector, 2025 and 2035
  • Figure 33: North America Market Y-o-Y Growth Comparison by End-Use Sector, 2025-2035
  • Figure 34: North America Market Attractiveness Analysis by End-Use Sector
  • Figure 35: North America Market Value Share and BPS Analysis by Compliance/Standard, 2025 and 2035
  • Figure 36: North America Market Y-o-Y Growth Comparison by Compliance/Standard, 2025-2035
  • Figure 37: North America Market Attractiveness Analysis by Compliance/Standard
  • Figure 38: Latin America Market Value Share and BPS Analysis by Country, 2025 and 2035
  • Figure 39: Latin America Market Value Share and BPS Analysis by Product Construction , 2025 and 2035
  • Figure 40: Latin America Market Y-o-Y Growth Comparison by Product Construction , 2025-2035
  • Figure 41: Latin America Market Attractiveness Analysis by Product Construction
  • Figure 42: Latin America Market Value Share and BPS Analysis by Capacity/Size Class, 2025 and 2035
  • Figure 43: Latin America Market Y-o-Y Growth Comparison by Capacity/Size Class, 2025-2035
  • Figure 44: Latin America Market Attractiveness Analysis by Capacity/Size Class
  • Figure 45: Latin America Market Value Share and BPS Analysis by End-Use Sector, 2025 and 2035
  • Figure 46: Latin America Market Y-o-Y Growth Comparison by End-Use Sector, 2025-2035
  • Figure 47: Latin America Market Attractiveness Analysis by End-Use Sector
  • Figure 48: Latin America Market Value Share and BPS Analysis by Compliance/Standard, 2025 and 2035
  • Figure 49: Latin America Market Y-o-Y Growth Comparison by Compliance/Standard, 2025-2035
  • Figure 50: Latin America Market Attractiveness Analysis by Compliance/Standard
  • Figure 51: Western Europe Market Value Share and BPS Analysis by Country, 2025 and 2035
  • Figure 52: Western Europe Market Value Share and BPS Analysis by Product Construction , 2025 and 2035
  • Figure 53: Western Europe Market Y-o-Y Growth Comparison by Product Construction , 2025-2035
  • Figure 54: Western Europe Market Attractiveness Analysis by Product Construction
  • Figure 55: Western Europe Market Value Share and BPS Analysis by Capacity/Size Class, 2025 and 2035
  • Figure 56: Western Europe Market Y-o-Y Growth Comparison by Capacity/Size Class, 2025-2035
  • Figure 57: Western Europe Market Attractiveness Analysis by Capacity/Size Class
  • Figure 58: Western Europe Market Value Share and BPS Analysis by End-Use Sector, 2025 and 2035
  • Figure 59: Western Europe Market Y-o-Y Growth Comparison by End-Use Sector, 2025-2035
  • Figure 60: Western Europe Market Attractiveness Analysis by End-Use Sector
  • Figure 61: Western Europe Market Value Share and BPS Analysis by Compliance/Standard, 2025 and 2035
  • Figure 62: Western Europe Market Y-o-Y Growth Comparison by Compliance/Standard, 2025-2035
  • Figure 63: Western Europe Market Attractiveness Analysis by Compliance/Standard
  • Figure 64: Eastern Europe Market Value Share and BPS Analysis by Country, 2025 and 2035
  • Figure 65: Eastern Europe Market Value Share and BPS Analysis by Product Construction , 2025 and 2035
  • Figure 66: Eastern Europe Market Y-o-Y Growth Comparison by Product Construction , 2025-2035
  • Figure 67: Eastern Europe Market Attractiveness Analysis by Product Construction
  • Figure 68: Eastern Europe Market Value Share and BPS Analysis by Capacity/Size Class, 2025 and 2035
  • Figure 69: Eastern Europe Market Y-o-Y Growth Comparison by Capacity/Size Class, 2025-2035
  • Figure 70: Eastern Europe Market Attractiveness Analysis by Capacity/Size Class
  • Figure 71: Eastern Europe Market Value Share and BPS Analysis by End-Use Sector, 2025 and 2035
  • Figure 72: Eastern Europe Market Y-o-Y Growth Comparison by End-Use Sector, 2025-2035
  • Figure 73: Eastern Europe Market Attractiveness Analysis by End-Use Sector
  • Figure 74: Eastern Europe Market Value Share and BPS Analysis by Compliance/Standard, 2025 and 2035
  • Figure 75: Eastern Europe Market Y-o-Y Growth Comparison by Compliance/Standard, 2025-2035
  • Figure 76: Eastern Europe Market Attractiveness Analysis by Compliance/Standard
  • Figure 77: East Asia Market Value Share and BPS Analysis by Country, 2025 and 2035
  • Figure 78: East Asia Market Value Share and BPS Analysis by Product Construction , 2025 and 2035
  • Figure 79: East Asia Market Y-o-Y Growth Comparison by Product Construction , 2025-2035
  • Figure 80: East Asia Market Attractiveness Analysis by Product Construction
  • Figure 81: East Asia Market Value Share and BPS Analysis by Capacity/Size Class, 2025 and 2035
  • Figure 82: East Asia Market Y-o-Y Growth Comparison by Capacity/Size Class, 2025-2035
  • Figure 83: East Asia Market Attractiveness Analysis by Capacity/Size Class
  • Figure 84: East Asia Market Value Share and BPS Analysis by End-Use Sector, 2025 and 2035
  • Figure 85: East Asia Market Y-o-Y Growth Comparison by End-Use Sector, 2025-2035
  • Figure 86: East Asia Market Attractiveness Analysis by End-Use Sector
  • Figure 87: East Asia Market Value Share and BPS Analysis by Compliance/Standard, 2025 and 2035
  • Figure 88: East Asia Market Y-o-Y Growth Comparison by Compliance/Standard, 2025-2035
  • Figure 89: East Asia Market Attractiveness Analysis by Compliance/Standard
  • Figure 90: South Asia and Pacific Market Value Share and BPS Analysis by Country, 2025 and 2035
  • Figure 91: South Asia and Pacific Market Value Share and BPS Analysis by Product Construction , 2025 and 2035
  • Figure 92: South Asia and Pacific Market Y-o-Y Growth Comparison by Product Construction , 2025-2035
  • Figure 93: South Asia and Pacific Market Attractiveness Analysis by Product Construction
  • Figure 94: South Asia and Pacific Market Value Share and BPS Analysis by Capacity/Size Class, 2025 and 2035
  • Figure 95: South Asia and Pacific Market Y-o-Y Growth Comparison by Capacity/Size Class, 2025-2035
  • Figure 96: South Asia and Pacific Market Attractiveness Analysis by Capacity/Size Class
  • Figure 97: South Asia and Pacific Market Value Share and BPS Analysis by End-Use Sector, 2025 and 2035
  • Figure 98: South Asia and Pacific Market Y-o-Y Growth Comparison by End-Use Sector, 2025-2035
  • Figure 99: South Asia and Pacific Market Attractiveness Analysis by End-Use Sector
  • Figure 100: South Asia and Pacific Market Value Share and BPS Analysis by Compliance/Standard, 2025 and 2035
  • Figure 101: South Asia and Pacific Market Y-o-Y Growth Comparison by Compliance/Standard, 2025-2035
  • Figure 102: South Asia and Pacific Market Attractiveness Analysis by Compliance/Standard
  • Figure 103: Middle East & Africa Market Value Share and BPS Analysis by Country, 2025 and 2035
  • Figure 104: Middle East & Africa Market Value Share and BPS Analysis by Product Construction , 2025 and 2035
  • Figure 105: Middle East & Africa Market Y-o-Y Growth Comparison by Product Construction , 2025-2035
  • Figure 106: Middle East & Africa Market Attractiveness Analysis by Product Construction
  • Figure 107: Middle East & Africa Market Value Share and BPS Analysis by Capacity/Size Class, 2025 and 2035
  • Figure 108: Middle East & Africa Market Y-o-Y Growth Comparison by Capacity/Size Class, 2025-2035
  • Figure 109: Middle East & Africa Market Attractiveness Analysis by Capacity/Size Class
  • Figure 110: Middle East & Africa Market Value Share and BPS Analysis by End-Use Sector, 2025 and 2035
  • Figure 111: Middle East & Africa Market Y-o-Y Growth Comparison by End-Use Sector, 2025-2035
  • Figure 112: Middle East & Africa Market Attractiveness Analysis by End-Use Sector
  • Figure 113: Middle East & Africa Market Value Share and BPS Analysis by Compliance/Standard, 2025 and 2035
  • Figure 114: Middle East & Africa Market Y-o-Y Growth Comparison by Compliance/Standard, 2025-2035
  • Figure 115: Middle East & Africa Market Attractiveness Analysis by Compliance/Standard
  • Figure 116: Global Market - Tier Structure Analysis
  • Figure 117: Global Market - Company Share Analysis

Frequently Asked Questions

How big is the multi-foil rotor market in 2025?

The global multi-foil rotor market is estimated to be valued at USD 1,608.6 million in 2025.

What will be the size of multi-foil rotor market in 2035?

The market size for the multi-foil rotor market is projected to reach USD 2,204.2 million by 2035.

How much will be the multi-foil rotor market growth between 2025 and 2035?

The multi-foil rotor market is expected to grow at a 3.2% CAGR between 2025 and 2035.

What are the key product types in the multi-foil rotor market?

The key product types in multi-foil rotor market are standard-duty, heavy-duty/corrosion-resistant and hygienic/cleanroom.

Which capacity/size class segment to contribute significant share in the multi-foil rotor market in 2025?

In terms of capacity/size class, medium segment to command 45.0% share in the multi-foil rotor market in 2025.

Explore Similar Insights

Future Market Insights

Multi Foil Rotor Market

Chat With

MaRIA

Hi There, I am MaRIA, Your Market Research Intelligence Assistant. How may I help you?