Neurodegenerative Disease Market
Market Insights on Neurodegenerative Disease covering sales outlook, demand forecast & up-to-date key trends
Neurodegenerative Disease Market by Drug Class, Disease Indication & Region - Forecast 2022 – 2032
Neurodegenerative Disease Market Overview (2022-2032)
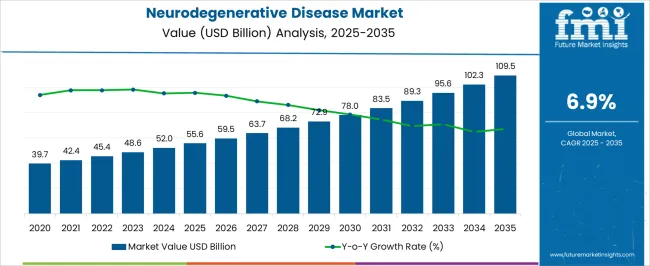
[250 Pages Report] The neurodegenerative disease market is anticipated to register a CAGR of 7% during the forecast period, up from US$ 43.7 Bn in 2021 to reach a valuation of US$ 92 Bn by 2032.
The neurodegenerative disease market is anticipated to show promising growth prospects during the forecasted period due to the increasing frequency of neurological diseases, an aging population, and growing demand for Alzheimer's and Parkinson's disease treatments.
Attributes |
Details |
Neurodegenerative Disease Market Value (2021) |
US$ 43.7 Bn |
Neurodegenerative Disease Market Value (2032) |
US$ 92 Bn |
CAGR (2021-2032) |
7% |
The neurodegenerative disease market share is expected to grow significantly, mainly due to increasing cases of neurodegenerative disorders. The neurodegenerative disease market is expected to witness advancement in the upcoming years due to a new type of drug launch.
Due to patent protection loss, new players are expected to enter the neurodegenerative disease market during the forecast years. In the Alzheimer’s market, drugs like GABA receptor modulators, anti-amyloid protein agents and nicotinic and cholinergic receptor agonists are expected to influence the neurodegenerative disease market growth.
However, the Parkinson’s disease market will be driven due to the launch of drugs like dopamine receptor agonists and reuptake inhibitors, glutamate receptor modulators, and adrenergic and adenosine antagonists.
Let us know your requirement to get
100% FREE customization
What are the Key Drivers to the Neurodegenerative Disease Market Share?
The neurodegenerative disease market is expected to thrive as medical technology advances for the detection and rising demand for the treatment of neurodegenerative diseases, increasing the need for neurodegenerative drugs.
The aging population is leading to an increase in the frequency of neurodegenerative diseases, which is one of the primary reasons driving the growth of the neurodegenerative market.
Developing nations, particularly those in the Asia Pacific, are predicted to be strong in the future years.
Growing physician awareness is assisting the neurodegenerative disease market growth to remain in developed countries. Due to the illness's multifaceted character, the lack of comprehensive curative treatment measures might hinder the global neurodegenerative disease market.
The neurodegenerative disease continues to place a significant strain on global healthcare costs and population mental and physical health. All disorders that impact the neurons in the human brain are classified as neurodegenerative diseases.
Alzheimer's disease is the most common neurodegenerative illness, with an estimated 5.8 million instances of Alzheimer's dementia in the United States alone in 2019. Parkinson's disease, multiple sclerosis, amyotrophic lateral sclerosis, Huntington's disease, spinal muscular atrophy, multiple system atrophy, and others are examples of neurodegenerative diseases.
Find your sweet spots for generating winning opportunities in this market.
Talk to AnalystWhich is the Leading Region in the Neurodegenerative Disease Market?
North America generated US$ 18,174.6 Mn in revenue from sales of neurodegenerative diseases drugs in 2018 and is likely to lead the neurodegenerative diseases market during the forecast period.
Growing medication demand, high prices, increased R&D investment, and favorable health reimbursement policies are driving the growth of the neurodegenerative diseases market in North America.
The European neurodegenerative disease market is expected to increase significantly due to the active government backing and marketing clearance for SPINRAZA in June 2017.
The Asia Pacific neurodegenerative diseases drugs market sales are expected to grow at the fastest rate during the forecast period, owing to the rising prevalence of neurodegenerative diseases, an aging population, and increased demand for Alzheimer's and Parkinson's disease drugs in Japan and China.
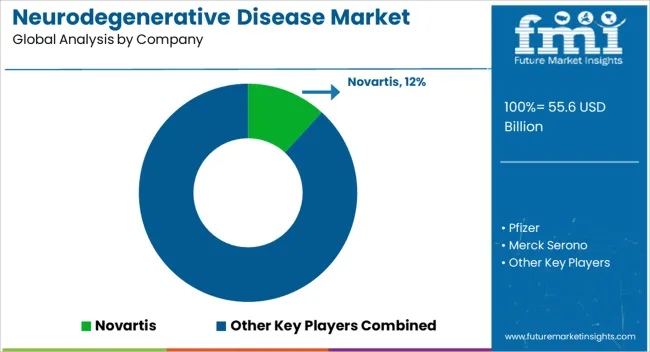
Some of the key market players in the global neurodegenerative disease market are Novartis, Pfizer, Merck Serono, Biogen Idec, TEVA Pharmaceuticals Industries, UCB, Boehringer Ingelheim, Sanofi S.A., GlaxoSmithKline. Due to patent protection loss, significant players in the neurodegenerative disease market will face competition in the upcoming years.
Recent Developments
- Luye Pharma and Towa Pharmaceutical announced a strategic agreement in February 2021 to develop and market Rivastigmine Multi-Day Transdermal Patch in Japan. Luye Pharma created the Rivastigmine Multi-Day Transdermal Patch, which treats Alzheimer's disease.
- Eli Lilly and Business finalized the purchase of Prevail, a biotechnology company exploring potentially disease-modifying AAV9-based gene treatments for patients suffering from neurodegenerative diseases, in January 2021.

A unified Market Research Subscription Platform, built for today's disparate research needs.
Scope of Report
Report Attribute |
Details |
Growth rate |
CAGR of 7% from 2022 to 2032 |
Base year for estimation |
2021 |
Historical data |
2015 - 2020 |
Forecast period |
2022 - 2032 |
Quantitative units |
Revenue in USD million, volume in kilotons, and CAGR from 2022 to 2032 |
Report coverage |
Revenue forecast, volume forecast, company ranking, competitive landscape, growth factors, and trends, Pricing Analysis, |
Segments covered |
Drug class, disease indication, region |
Regional scope |
North America; Western Europe, Eastern Europe, Middle East, Africa, ASEAN, South Asia, Rest of Asia, Australia and New Zealand |
Country scope |
U.S.; Canada; Mexico; Germany; U.K.; France; Italy; Spain; Russia; Belgium; Poland; Czech Republic; China; India; Japan; Australia; Brazil; Argentina; Colombia; Saudi Arabia; UAE; Iran; South Africa |
Key companies profiled |
Novartis, Pfizer, Merck Serono, Biogen Idec, TEVA Pharmaceuticals Industries, UCB, Boehringer Ingelheim, Sanofi S.A., GlaxoSmithKline |
Customization scope |
Free report customization (equivalent to up to 8 analysts working days) with purchase. Addition or alteration to country, regional & segment scope. |
Pricing and purchase options |
Avail customized purchase options to meet your exact research needs. |
Key Segments
By Drug class:
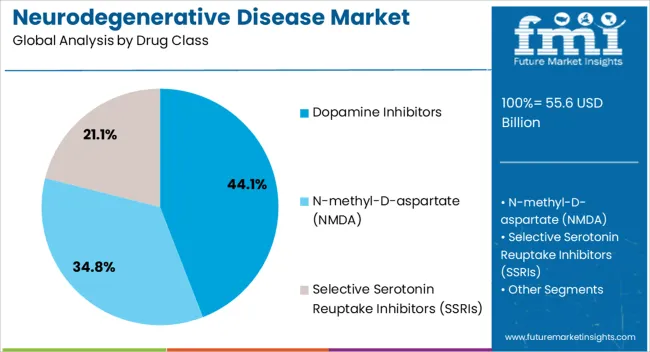
- NMDA
- SSRIs
- Dopamine Inhibitors
By Disease Indication:
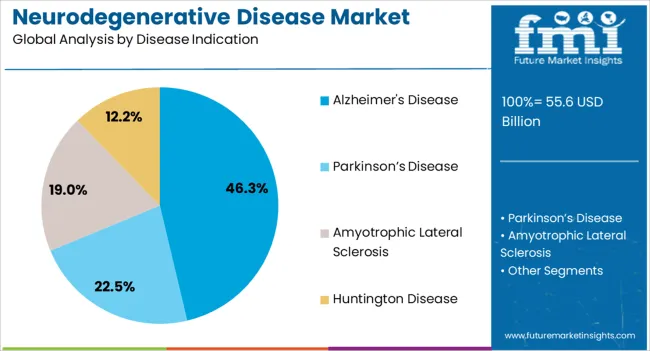
- Parkinson’s disease
- Alzheimer's disease
- Amyotrophic Lateral Sclerosis
- Huntington disease
By Region:
- North America
- Latin America
- Asia Pacific
- MEA
- Europe
Frequently Asked Questions
The neurodegenerative disease market is likely to register a CAGR of 7% during the forecast period.
Key players holding substantial neurodegenerative disease market share include Novartis, Pfizer, Merck Serono, Biogen Idec, TEVA Pharmaceuticals Industries, UCB, Boehringer Ingelheim, Sanofi S.A., GlaxoSmithKline
As per the analysis, the neurodegenerative disease market share is likely to be US$ 92 Bn by 2032.
Demand for neurodegenerative disease treatment is likely to rise due to increasing prevalence of neurological diseases, an ageing population, and an increase in demand for Alzheimer's and Parkinson's disease treatments.
Table of Content
1. Executive Summary
1.1. Global Market Outlook
1.2. Demand-side Trends
1.3. Supply-side Trends
1.4. Technology Roadmap Analysis
1.5. Analysis and Recommendations
2. Market Overview
2.1. Market Coverage / Taxonomy
2.2. Market Definition / Scope / Limitations
3. Market Background
3.1. Market Dynamics
3.1.1. Drivers
3.1.2. Restraints
3.1.3. Opportunity
3.1.4. Trends
3.2. Scenario Forecast
3.2.1. Demand in Optimistic Scenario
3.2.2. Demand in Likely Scenario
3.2.3. Demand in Conservative Scenario
3.3. Opportunity Map Analysis
3.4. Investment Feasibility Matrix
3.5. PESTLE and Porter’s Analysis
3.6. Regulatory Landscape
3.6.1. By Key Regions
3.6.2. By Key Countries
3.7. Regional Parent Market Outlook
4. Global Market Analysis 2017-2021 and Forecast, 2022-2032
4.1. Historical Market Size Value (US$ Mn) Analysis, 2017-2021
4.2. Current and Future Market Size Value (US$ Mn) Projections, 2022-2032
4.2.1. Y-o-Y Growth Trend Analysis
4.2.2. Absolute $ Opportunity Analysis
5. Global Market Analysis 2017-2021 and Forecast 2022-2032, By Disease Indication
5.1. Introduction / Key Findings
5.2. Historical Market Size Value (US$ Mn) Analysis By Disease Indication, 2017-2021
5.3. Current and Future Market Size Value (US$ Mn) Analysis and Forecast By Disease Indication, 2022-2032
5.3.1. Alzheimer’s Disease
5.3.2. Motor Neuron Diseases
5.3.3. Parkinson’s Disease
5.3.4. Huntington’s Disease
5.3.5. Multiple Sclerosis
5.3.6. Others
5.4. Y-o-Y Growth Trend Analysis By Disease Indication, 2017-2021
5.5. Absolute $ Opportunity Analysis By Disease Indication, 2022-2032
Deep-dive segmentation will be available in the sample on request
6. Global Market Analysis 2017-2021 and Forecast 2022-2032, By Drug Class
6.1. Introduction / Key Findings
6.2. Historical Market Size Value (US$ Mn) Analysis By Drug Class, 2017-2021
6.3. Current and Future Market Size Value (US$ Mn) Analysis and Forecast By Drug Class, 2022-2032
6.3.1. Cholinesterase Inhibitors
6.3.2. Dopamine Inhibitors
6.3.3. MAO-B Inhibitors
6.3.4. Catechol-O-methyltransferase Inhibitors
6.3.5. Anticholinergics
6.3.6. Antipsychotic Drugs
6.3.7. Dopamine Antagonists
6.3.8. Others
6.4. Y-o-Y Growth Trend Analysis By Drug Class, 2017-2021
6.5. Absolute $ Opportunity Analysis By Drug Class, 2022-2032
Deep-dive segmentation will be available in the sample on request
7. Global Market Analysis 2017-2021 and Forecast 2022-2032, By Route of Administration
7.1. Introduction / Key Findings
7.2. Historical Market Size Value (US$ Mn) Analysis By Route of Administration, 2017-2021
7.3. Current and Future Market Size Value (US$ Mn) Analysis and Forecast By Route of Administration, 2022-2032
7.3.1. Oral Drugs
7.3.2. Parenteral Drugs
7.3.3. Topical Drugs
7.4. Y-o-Y Growth Trend Analysis By Route of Administration, 2017-2021
7.5. Absolute $ Opportunity Analysis By Route of Administration, 2022-2032
Deep-dive segmentation will be available in the sample on request
8. Global Market Analysis 2017-2021 and Forecast 2022-2032, By Distribution Channel
8.1. Introduction / Key Findings
8.2. Historical Market Size Value (US$ Mn) Analysis By Distribution Channel, 2017-2021
8.3. Current and Future Market Size Value (US$ Mn) Analysis and Forecast By Distribution Channel, 2022-2032
8.3.1. Hospital Pharmacies
8.3.2. Retail Pharmacies
8.3.3. Online Pharmacies
8.3.4. Drug Stores
8.4. Y-o-Y Growth Trend Analysis By Distribution Channel, 2017-2021
8.5. Absolute $ Opportunity Analysis By Distribution Channel, 2022-2032
Deep-dive segmentation will be available in the sample on request
9. Global Market Analysis 2017-2021 and Forecast 2022-2032, By Region
9.1. Introduction
9.2. Historical Market Size Value (US$ Mn) Analysis By Region, 2017-2021
9.3. Current Market Size Value (US$ Mn) Analysis and Forecast By Region, 2022-2032
9.3.1. North America
9.3.2. Latin America
9.3.3. Europe
9.3.4. East Asia
9.3.5. South Asia & Pacific
9.3.6. MEA
9.4. Market Attractiveness Analysis By Region
10. North America Market Analysis 2017-2021 and Forecast 2022-2032, By Country
10.1. Historical Market Size Value (US$ Mn) Trend Analysis By Market Taxonomy, 2017-2021
10.2. Market Size Value (US$ Mn) Forecast By Market Taxonomy, 2022-2032
10.2.1. By Country
10.2.1.1. U.K.
10.2.1.2. Canada
10.2.2. By Disease Indication
10.2.3. By Drug Class
10.2.4. By Route of Administration
10.2.5. By Distribution Channel
10.3. Market Attractiveness Analysis
10.3.1. By Country
10.3.2. By Disease Indication
10.3.3. By Drug Class
10.3.4. By Route of Administration
10.3.5. By Distribution Channel
10.4. Key Takeaways
11. Latin America Market Analysis 2017-2021 and Forecast 2022-2032, By Country
11.1. Historical Market Size Value (US$ Mn) Trend Analysis By Market Taxonomy, 2017-2021
11.2. Market Size Value (US$ Mn) Forecast By Market Taxonomy, 2022-2032
11.2.1. By Country
11.2.1.1. Brazil
11.2.1.2. Mexico
11.2.1.3. Rest of Latin America
11.2.2. By Disease Indication
11.2.3. By Drug Class
11.2.4. By Route of Administration
11.2.5. By Distribution Channel
11.3. Market Attractiveness Analysis
11.3.1. By Country
11.3.2. By Disease Indication
11.3.3. By Drug Class
11.3.4. By Route of Administration
11.3.5. By Distribution Channel
11.4. Key Takeaways
12. Europe Market Analysis 2017-2021 and Forecast 2022-2032, By Country
12.1. Historical Market Size Value (US$ Mn) Trend Analysis By Market Taxonomy, 2017-2021
12.2. Market Size Value (US$ Mn) Forecast By Market Taxonomy, 2022-2032
12.2.1. By Country
12.2.1.1. Germany
12.2.1.2. U.K.
12.2.1.3. France
12.2.1.4. Spain
12.2.1.5. Italy
12.2.1.6. Rest of Europe
12.2.2. By Disease Indication
12.2.3. By Drug Class
12.2.4. By Route of Administration
12.2.5. By Distribution Channel
12.3. Market Attractiveness Analysis
12.3.1. By Country
12.3.2. By Disease Indication
12.3.3. By Drug Class
12.3.4. By Route of Administration
12.3.5. By Distribution Channel
12.4. Key Takeaways
13. East Asia Market Analysis 2017-2021 and Forecast 2022-2032, By Country
13.1. Historical Market Size Value (US$ Mn) Trend Analysis By Market Taxonomy, 2017-2021
13.2. Market Size Value (US$ Mn) Forecast By Market Taxonomy, 2022-2032
13.2.1. By Country
13.2.1.1. China
13.2.1.2. Japan
13.2.1.3. South Korea
13.2.2. By Disease Indication
13.2.3. By Drug Class
13.2.4. By Route of Administration
13.2.5. By Distribution Channel
13.3. Market Attractiveness Analysis
13.3.1. By Country
13.3.2. By Disease Indication
13.3.3. By Drug Class
13.3.4. By Route of Administration
13.3.5. By Distribution Channel
13.4. Key Takeaways
14. South Asia & Pacific Market Analysis 2017-2021 and Forecast 2022-2032, By Country
14.1. Historical Market Size Value (US$ Mn) Trend Analysis By Market Taxonomy, 2017-2021
14.2. Market Size Value (US$ Mn) Forecast By Market Taxonomy, 2022-2032
14.2.1. By Country
14.2.1.1. India
14.2.1.2. Thailand
14.2.1.3. Indonesia
14.2.1.4. Malaysia
14.2.1.5. Singapore
14.2.1.6. Australia
14.2.1.7. New Zealand
14.2.1.8. Rest of South Asia & Pacific
14.2.2. By Disease Indication
14.2.3. By Drug Class
14.2.4. By Route of Administration
14.2.5. By Distribution Channel
14.3. Market Attractiveness Analysis
14.3.1. By Country
14.3.2. By Disease Indication
14.3.3. By Drug Class
14.3.4. By Route of Administration
14.3.5. By Distribution Channel
14.4. Key Takeaways
15. MEA Market Analysis 2017-2021 and Forecast 2022-2032, By Country
15.1. Historical Market Size Value (US$ Mn) Trend Analysis By Market Taxonomy, 2017-2021
15.2. Market Size Value (US$ Mn) Forecast By Market Taxonomy, 2022-2032
15.2.1. By Country
15.2.1.1. GCC Countries
15.2.1.2. South Africa
15.2.1.3. Israel
15.2.1.4. Rest of MEA
15.2.2. By Disease Indication
15.2.3. By Drug Class
15.2.4. By Route of Administration
15.2.5. By Distribution Channel
15.3. Market Attractiveness Analysis
15.3.1. By Country
15.3.2. By Disease Indication
15.3.3. By Drug Class
15.3.4. By Route of Administration
15.3.5. By Distribution Channel
15.4. Key Takeaways
16. Key Countries Market Analysis
16.1. U.K.
16.1.1. Pricing Analysis
16.1.2. Market Share Analysis, 2021
16.1.2.1. By Disease Indication
16.1.2.2. By Drug Class
16.1.2.3. By Route of Administration
16.1.2.4. By Distribution Channel
16.2. Canada
16.2.1. Pricing Analysis
16.2.2. Market Share Analysis, 2021
16.2.2.1. By Disease Indication
16.2.2.2. By Drug Class
16.2.2.3. By Route of Administration
16.2.2.4. By Distribution Channel
16.3. Brazil
16.3.1. Pricing Analysis
16.3.2. Market Share Analysis, 2021
16.3.2.1. By Disease Indication
16.3.2.2. By Drug Class
16.3.2.3. By Route of Administration
16.3.2.4. By Distribution Channel
16.4. Mexico
16.4.1. Pricing Analysis
16.4.2. Market Share Analysis, 2021
16.4.2.1. By Disease Indication
16.4.2.2. By Drug Class
16.4.2.3. By Route of Administration
16.4.2.4. By Distribution Channel
16.5. Germany
16.5.1. Pricing Analysis
16.5.2. Market Share Analysis, 2021
16.5.2.1. By Disease Indication
16.5.2.2. By Drug Class
16.5.2.3. By Route of Administration
16.5.2.4. By Distribution Channel
16.6. U.K.
16.6.1. Pricing Analysis
16.6.2. Market Share Analysis, 2021
16.6.2.1. By Disease Indication
16.6.2.2. By Drug Class
16.6.2.3. By Route of Administration
16.6.2.4. By Distribution Channel
16.7. France
16.7.1. Pricing Analysis
16.7.2. Market Share Analysis, 2021
16.7.2.1. By Disease Indication
16.7.2.2. By Drug Class
16.7.2.3. By Route of Administration
16.7.2.4. By Distribution Channel
16.8. Spain
16.8.1. Pricing Analysis
16.8.2. Market Share Analysis, 2021
16.8.2.1. By Disease Indication
16.8.2.2. By Drug Class
16.8.2.3. By Route of Administration
16.8.2.4. By Distribution Channel
16.9. Italy
16.9.1. Pricing Analysis
16.9.2. Market Share Analysis, 2021
16.9.2.1. By Disease Indication
16.9.2.2. By Drug Class
16.9.2.3. By Route of Administration
16.9.2.4. By Distribution Channel
16.10. China
16.10.1. Pricing Analysis
16.10.2. Market Share Analysis, 2021
16.10.2.1. By Disease Indication
16.10.2.2. By Drug Class
16.10.2.3. By Route of Administration
16.10.2.4. By Distribution Channel
16.11. Japan
16.11.1. Pricing Analysis
16.11.2. Market Share Analysis, 2021
16.11.2.1. By Disease Indication
16.11.2.2. By Drug Class
16.11.2.3. By Route of Administration
16.11.2.4. By Distribution Channel
16.12. South Korea
16.12.1. Pricing Analysis
16.12.2. Market Share Analysis, 2021
16.12.2.1. By Disease Indication
16.12.2.2. By Drug Class
16.12.2.3. By Route of Administration
16.12.2.4. By Distribution Channel
16.13. India
16.13.1. Pricing Analysis
16.13.2. Market Share Analysis, 2021
16.13.2.1. By Disease Indication
16.13.2.2. By Drug Class
16.13.2.3. By Route of Administration
16.13.2.4. By Distribution Channel
16.14. Thailand
16.14.1. Pricing Analysis
16.14.2. Market Share Analysis, 2021
16.14.2.1. By Disease Indication
16.14.2.2. By Drug Class
16.14.2.3. By Route of Administration
16.14.2.4. By Distribution Channel
16.15. Indonesia
16.15.1. Pricing Analysis
16.15.2. Market Share Analysis, 2021
16.15.2.1. By Disease Indication
16.15.2.2. By Drug Class
16.15.2.3. By Route of Administration
16.15.2.4. By Distribution Channel
16.16. Malaysia
16.16.1. Pricing Analysis
16.16.2. Market Share Analysis, 2021
16.16.2.1. By Disease Indication
16.16.2.2. By Drug Class
16.16.2.3. By Route of Administration
16.16.2.4. By Distribution Channel
16.17. Singapore
16.17.1. Pricing Analysis
16.17.2. Market Share Analysis, 2021
16.17.2.1. By Disease Indication
16.17.2.2. By Drug Class
16.17.2.3. By Route of Administration
16.17.2.4. By Distribution Channel
16.18. Australia
16.18.1. Pricing Analysis
16.18.2. Market Share Analysis, 2021
16.18.2.1. By Disease Indication
16.18.2.2. By Drug Class
16.18.2.3. By Route of Administration
16.18.2.4. By Distribution Channel
16.19. New Zealand
16.19.1. Pricing Analysis
16.19.2. Market Share Analysis, 2021
16.19.2.1. By Disease Indication
16.19.2.2. By Drug Class
16.19.2.3. By Route of Administration
16.19.2.4. By Distribution Channel
16.20. GCC Countries
16.20.1. Pricing Analysis
16.20.2. Market Share Analysis, 2021
16.20.2.1. By Disease Indication
16.20.2.2. By Drug Class
16.20.2.3. By Route of Administration
16.20.2.4. By Distribution Channel
16.21. South Africa
16.21.1. Pricing Analysis
16.21.2. Market Share Analysis, 2021
16.21.2.1. By Disease Indication
16.21.2.2. By Drug Class
16.21.2.3. By Route of Administration
16.21.2.4. By Distribution Channel
16.22. Israel
16.22.1. Pricing Analysis
16.22.2. Market Share Analysis, 2021
16.22.2.1. By Disease Indication
16.22.2.2. By Drug Class
16.22.2.3. By Route of Administration
16.22.2.4. By Distribution Channel
17. Market Structure Analysis
17.1. Competition Dashboard
17.2. Competition Benchmarking
17.3. Market Share Analysis of Top Players
17.3.1. By Regional
17.3.2. By Disease Indication
17.3.3. By Drug Class
17.3.4. By Route of Administration
17.3.5. By Distribution Channel
18. Competition Analysis
18.1. Competition Deep Dive
18.1.1. F. Hoffmann-La Roche Ltd
18.1.1.1. Overview
18.1.1.2. Product Portfolio
18.1.1.3. Profitability by Market Segments
18.1.1.4. Sales Footprint
18.1.1.5. Strategy Overview
18.1.1.5.1. Marketing Strategy
18.1.2. Novartis AG
18.1.2.1. Overview
18.1.2.2. Product Portfolio
18.1.2.3. Profitability by Market Segments
18.1.2.4. Sales Footprint
18.1.2.5. Strategy Overview
18.1.2.5.1. Marketing Strategy
18.1.3. Biogen
18.1.3.1. Overview
18.1.3.2. Product Portfolio
18.1.3.3. Profitability by Market Segments
18.1.3.4. Sales Footprint
18.1.3.5. Strategy Overview
18.1.3.5.1. Marketing Strategy
18.1.4. Teva Pharmaceuticals Industries Ltd.
18.1.4.1. Overview
18.1.4.2. Product Portfolio
18.1.4.3. Profitability by Market Segments
18.1.4.4. Sales Footprint
18.1.4.5. Strategy Overview
18.1.4.5.1. Marketing Strategy
18.1.5. Eisai Co., Ltd.
18.1.5.1. Overview
18.1.5.2. Product Portfolio
18.1.5.3. Profitability by Market Segments
18.1.5.4. Sales Footprint
18.1.5.5. Strategy Overview
18.1.5.5.1. Marketing Strategy
18.1.6. Sanofi
18.1.6.1. Overview
18.1.6.2. Product Portfolio
18.1.6.3. Profitability by Market Segments
18.1.6.4. Sales Footprint
18.1.6.5. Strategy Overview
18.1.6.5.1. Marketing Strategy
18.1.7. Merck KGaA
18.1.7.1. Overview
18.1.7.2. Product Portfolio
18.1.7.3. Profitability by Market Segments
18.1.7.4. Sales Footprint
18.1.7.5. Strategy Overview
18.1.7.5.1. Marketing Strategy
18.1.8. UCB S.A
18.1.8.1. Overview
18.1.8.2. Product Portfolio
18.1.8.3. Profitability by Market Segments
18.1.8.4. Sales Footprint
18.1.8.5. Strategy Overview
18.1.8.5.1. Marketing Strategy
18.1.9. Boehringer Ingelheim International GmbH
18.1.9.1. Overview
18.1.9.2. Product Portfolio
18.1.9.3. Profitability by Market Segments
18.1.9.4. Sales Footprint
18.1.9.5. Strategy Overview
18.1.9.5.1. Marketing Strategy
18.1.10. GlaxoSmithKline plc
18.1.10.1. Overview
18.1.10.2. Product Portfolio
18.1.10.3. Profitability by Market Segments
18.1.10.4. Sales Footprint
18.1.10.5. Strategy Overview
18.1.10.5.1. Marketing Strategy
18.1.11. Neuro-Hitech, Inc.
18.1.11.1. Overview
18.1.11.2. Product Portfolio
18.1.11.3. Profitability by Market Segments
18.1.11.4. Sales Footprint
18.1.11.5. Strategy Overview
18.1.11.5.1. Marketing Strategy
18.1.12. BioVision Inc
18.1.12.1. Overview
18.1.12.2. Product Portfolio
18.1.12.3. Profitability by Market Segments
18.1.12.4. Sales Footprint
18.1.12.5. Strategy Overview
18.1.12.5.1. Marketing Strategy
18.1.13. Aquinnah Pharmaceuticals
18.1.13.1. Overview
18.1.13.2. Product Portfolio
18.1.13.3. Profitability by Market Segments
18.1.13.4. Sales Footprint
18.1.13.5. Strategy Overview
18.1.13.5.1. Marketing Strategy
18.1.14. ADDEX THERAPEUTICS
18.1.14.1. Overview
18.1.14.2. Product Portfolio
18.1.14.3. Profitability by Market Segments
18.1.14.4. Sales Footprint
18.1.14.5. Strategy Overview
18.1.14.5.1. Marketing Strategy
18.1.15. Cellcentric
18.1.15.1. Overview
18.1.15.2. Product Portfolio
18.1.15.3. Profitability by Market Segments
18.1.15.4. Sales Footprint
18.1.15.5. Strategy Overview
18.1.15.5.1. Marketing Strategy
18.1.16. Mission Therapeutics
18.1.16.1. Overview
18.1.16.2. Product Portfolio
18.1.16.3. Profitability by Market Segments
18.1.16.4. Sales Footprint
18.1.16.5. Strategy Overview
18.1.16.5.1. Marketing Strategy
18.1.17. CogRx
18.1.17.1. Overview
18.1.17.2. Product Portfolio
18.1.17.3. Profitability by Market Segments
18.1.17.4. Sales Footprint
18.1.17.5. Strategy Overview
18.1.17.5.1. Marketing Strategy
18.1.18. Denali Therapeutics Inc
18.1.18.1. Overview
18.1.18.2. Product Portfolio
18.1.18.3. Profitability by Market Segments
18.1.18.4. Sales Footprint
18.1.18.5. Strategy Overview
18.1.18.5.1. Marketing Strategy
18.1.19. Psyadon Pharmaceuticals, Inc.
18.1.19.1. Overview
18.1.19.2. Product Portfolio
18.1.19.3. Profitability by Market Segments
18.1.19.4. Sales Footprint
18.1.19.5. Strategy Overview
18.1.19.5.1. Marketing Strategy
18.1.20. Cipla Inc.
18.1.20.1. Overview
18.1.20.2. Product Portfolio
18.1.20.3. Profitability by Market Segments
18.1.20.4. Sales Footprint
18.1.20.5. Strategy Overview
18.1.20.5.1. Marketing Strategy
19. Assumptions & Acronyms Used
20. Research Methodology
Let us know your requirement to get
100% FREE customization
List of Tables
Table 1: Global Market Value (US$ Mn) Forecast by Region, 2017-2032
Table 2: Global Market Value (US$ Mn) Forecast by Disease Indication, 2017-2032
Table 3: Global Market Value (US$ Mn) Forecast by Drug Class, 2017-2032
Table 4: Global Market Value (US$ Mn) Forecast by Route of Administration, 2017-2032
Table 5: Global Market Value (US$ Mn) Forecast by Distribution Channel, 2017-2032
Table 6: North America Market Value (US$ Mn) Forecast by Country, 2017-2032
Table 7: North America Market Value (US$ Mn) Forecast by Disease Indication, 2017-2032
Table 8: North America Market Value (US$ Mn) Forecast by Drug Class, 2017-2032
Table 9: North America Market Value (US$ Mn) Forecast by Route of Administration, 2017-2032
Table 10: North America Market Value (US$ Mn) Forecast by Distribution Channel, 2017-2032
Table 11: Latin America Market Value (US$ Mn) Forecast by Country, 2017-2032
Table 12: Latin America Market Value (US$ Mn) Forecast by Disease Indication, 2017-2032
Table 13: Latin America Market Value (US$ Mn) Forecast by Drug Class, 2017-2032
Table 14: Latin America Market Value (US$ Mn) Forecast by Route of Administration, 2017-2032
Table 15: Latin America Market Value (US$ Mn) Forecast by Distribution Channel, 2017-2032
Table 16: Europe Market Value (US$ Mn) Forecast by Country, 2017-2032
Table 17: Europe Market Value (US$ Mn) Forecast by Disease Indication, 2017-2032
Table 18: Europe Market Value (US$ Mn) Forecast by Drug Class, 2017-2032
Table 19: Europe Market Value (US$ Mn) Forecast by Route of Administration, 2017-2032
Table 20: Europe Market Value (US$ Mn) Forecast by Distribution Channel, 2017-2032
Table 21: East Asia Market Value (US$ Mn) Forecast by Country, 2017-2032
Table 22: East Asia Market Value (US$ Mn) Forecast by Disease Indication, 2017-2032
Table 23: East Asia Market Value (US$ Mn) Forecast by Drug Class, 2017-2032
Table 24: East Asia Market Value (US$ Mn) Forecast by Route of Administration, 2017-2032
Table 25: East Asia Market Value (US$ Mn) Forecast by Distribution Channel, 2017-2032
Table 26: South Asia & Pacific Market Value (US$ Mn) Forecast by Country, 2017-2032
Table 27: South Asia & Pacific Market Value (US$ Mn) Forecast by Disease Indication, 2017-2032
Table 28: South Asia & Pacific Market Value (US$ Mn) Forecast by Drug Class, 2017-2032
Table 29: South Asia & Pacific Market Value (US$ Mn) Forecast by Route of Administration, 2017-2032
Table 30: South Asia & Pacific Market Value (US$ Mn) Forecast by Distribution Channel, 2017-2032
Table 31: MEA Market Value (US$ Mn) Forecast by Country, 2017-2032
Table 32: MEA Market Value (US$ Mn) Forecast by Disease Indication, 2017-2032
Table 33: MEA Market Value (US$ Mn) Forecast by Drug Class, 2017-2032
Table 34: MEA Market Value (US$ Mn) Forecast by Route of Administration, 2017-2032
Table 35: MEA Market Value (US$ Mn) Forecast by Distribution Channel, 2017-2032
Find your sweet spots for generating winning opportunities in this market.
Talk to AnalystList of Charts
Figure 1: Global Market Value (US$ Mn) by Disease Indication, 2022-2032
Figure 2: Global Market Value (US$ Mn) by Drug Class, 2022-2032
Figure 3: Global Market Value (US$ Mn) by Route of Administration, 2022-2032
Figure 4: Global Market Value (US$ Mn) by Distribution Channel, 2022-2032
Figure 5: Global Market Value (US$ Mn) by Region, 2022-2032
Figure 6: Global Market Value (US$ Mn) Analysis by Region, 2017-2032
Figure 7: Global Market Value Share (%) and BPS Analysis by Region, 2022-2032
Figure 8: Global Market Y-o-Y Growth (%) Projections by Region, 2022-2032
Figure 9: Global Market Value (US$ Mn) Analysis by Disease Indication, 2017-2032
Figure 10: Global Market Value Share (%) and BPS Analysis by Disease Indication, 2022-2032
Figure 11: Global Market Y-o-Y Growth (%) Projections by Disease Indication, 2022-2032
Figure 12: Global Market Value (US$ Mn) Analysis by Drug Class, 2017-2032
Figure 13: Global Market Value Share (%) and BPS Analysis by Drug Class, 2022-2032
Figure 14: Global Market Y-o-Y Growth (%) Projections by Drug Class, 2022-2032
Figure 15: Global Market Value (US$ Mn) Analysis by Route of Administration, 2017-2032
Figure 16: Global Market Value Share (%) and BPS Analysis by Route of Administration, 2022-2032
Figure 17: Global Market Y-o-Y Growth (%) Projections by Route of Administration, 2022-2032
Figure 18: Global Market Value (US$ Mn) Analysis by Distribution Channel, 2017-2032
Figure 19: Global Market Value Share (%) and BPS Analysis by Distribution Channel, 2022-2032
Figure 20: Global Market Y-o-Y Growth (%) Projections by Distribution Channel, 2022-2032
Figure 21: Global Market Attractiveness by Disease Indication, 2022-2032
Figure 22: Global Market Attractiveness by Drug Class, 2022-2032
Figure 23: Global Market Attractiveness by Route of Administration, 2022-2032
Figure 24: Global Market Attractiveness by Distribution Channel, 2022-2032
Figure 25: Global Market Attractiveness by Region, 2022-2032
Figure 26: North America Market Value (US$ Mn) by Disease Indication, 2022-2032
Figure 27: North America Market Value (US$ Mn) by Drug Class, 2022-2032
Figure 28: North America Market Value (US$ Mn) by Route of Administration, 2022-2032
Figure 29: North America Market Value (US$ Mn) by Distribution Channel, 2022-2032
Figure 30: North America Market Value (US$ Mn) by Country, 2022-2032
Figure 31: North America Market Value (US$ Mn) Analysis by Country, 2017-2032
Figure 32: North America Market Value Share (%) and BPS Analysis by Country, 2022-2032
Figure 33: North America Market Y-o-Y Growth (%) Projections by Country, 2022-2032
Figure 34: North America Market Value (US$ Mn) Analysis by Disease Indication, 2017-2032
Figure 35: North America Market Value Share (%) and BPS Analysis by Disease Indication, 2022-2032
Figure 36: North America Market Y-o-Y Growth (%) Projections by Disease Indication, 2022-2032
Figure 37: North America Market Value (US$ Mn) Analysis by Drug Class, 2017-2032
Figure 38: North America Market Value Share (%) and BPS Analysis by Drug Class, 2022-2032
Figure 39: North America Market Y-o-Y Growth (%) Projections by Drug Class, 2022-2032
Figure 40: North America Market Value (US$ Mn) Analysis by Route of Administration, 2017-2032
Figure 41: North America Market Value Share (%) and BPS Analysis by Route of Administration, 2022-2032
Figure 42: North America Market Y-o-Y Growth (%) Projections by Route of Administration, 2022-2032
Figure 43: North America Market Value (US$ Mn) Analysis by Distribution Channel, 2017-2032
Figure 44: North America Market Value Share (%) and BPS Analysis by Distribution Channel, 2022-2032
Figure 45: North America Market Y-o-Y Growth (%) Projections by Distribution Channel, 2022-2032
Figure 46: North America Market Attractiveness by Disease Indication, 2022-2032
Figure 47: North America Market Attractiveness by Drug Class, 2022-2032
Figure 48: North America Market Attractiveness by Route of Administration, 2022-2032
Figure 49: North America Market Attractiveness by Distribution Channel, 2022-2032
Figure 50: North America Market Attractiveness by Country, 2022-2032
Figure 51: Latin America Market Value (US$ Mn) by Disease Indication, 2022-2032
Figure 52: Latin America Market Value (US$ Mn) by Drug Class, 2022-2032
Figure 53: Latin America Market Value (US$ Mn) by Route of Administration, 2022-2032
Figure 54: Latin America Market Value (US$ Mn) by Distribution Channel, 2022-2032
Figure 55: Latin America Market Value (US$ Mn) by Country, 2022-2032
Figure 56: Latin America Market Value (US$ Mn) Analysis by Country, 2017-2032
Figure 57: Latin America Market Value Share (%) and BPS Analysis by Country, 2022-2032
Figure 58: Latin America Market Y-o-Y Growth (%) Projections by Country, 2022-2032
Figure 59: Latin America Market Value (US$ Mn) Analysis by Disease Indication, 2017-2032
Figure 60: Latin America Market Value Share (%) and BPS Analysis by Disease Indication, 2022-2032
Figure 61: Latin America Market Y-o-Y Growth (%) Projections by Disease Indication, 2022-2032
Figure 62: Latin America Market Value (US$ Mn) Analysis by Drug Class, 2017-2032
Figure 63: Latin America Market Value Share (%) and BPS Analysis by Drug Class, 2022-2032
Figure 64: Latin America Market Y-o-Y Growth (%) Projections by Drug Class, 2022-2032
Figure 65: Latin America Market Value (US$ Mn) Analysis by Route of Administration, 2017-2032
Figure 66: Latin America Market Value Share (%) and BPS Analysis by Route of Administration, 2022-2032
Figure 67: Latin America Market Y-o-Y Growth (%) Projections by Route of Administration, 2022-2032
Figure 68: Latin America Market Value (US$ Mn) Analysis by Distribution Channel, 2017-2032
Figure 69: Latin America Market Value Share (%) and BPS Analysis by Distribution Channel, 2022-2032
Figure 70: Latin America Market Y-o-Y Growth (%) Projections by Distribution Channel, 2022-2032
Figure 71: Latin America Market Attractiveness by Disease Indication, 2022-2032
Figure 72: Latin America Market Attractiveness by Drug Class, 2022-2032
Figure 73: Latin America Market Attractiveness by Route of Administration, 2022-2032
Figure 74: Latin America Market Attractiveness by Distribution Channel, 2022-2032
Figure 75: Latin America Market Attractiveness by Country, 2022-2032
Figure 76: Europe Market Value (US$ Mn) by Disease Indication, 2022-2032
Figure 77: Europe Market Value (US$ Mn) by Drug Class, 2022-2032
Figure 78: Europe Market Value (US$ Mn) by Route of Administration, 2022-2032
Figure 79: Europe Market Value (US$ Mn) by Distribution Channel, 2022-2032
Figure 80: Europe Market Value (US$ Mn) by Country, 2022-2032
Figure 81: Europe Market Value (US$ Mn) Analysis by Country, 2017-2032
Figure 82: Europe Market Value Share (%) and BPS Analysis by Country, 2022-2032
Figure 83: Europe Market Y-o-Y Growth (%) Projections by Country, 2022-2032
Figure 84: Europe Market Value (US$ Mn) Analysis by Disease Indication, 2017-2032
Figure 85: Europe Market Value Share (%) and BPS Analysis by Disease Indication, 2022-2032
Figure 86: Europe Market Y-o-Y Growth (%) Projections by Disease Indication, 2022-2032
Figure 87: Europe Market Value (US$ Mn) Analysis by Drug Class, 2017-2032
Figure 88: Europe Market Value Share (%) and BPS Analysis by Drug Class, 2022-2032
Figure 89: Europe Market Y-o-Y Growth (%) Projections by Drug Class, 2022-2032
Figure 90: Europe Market Value (US$ Mn) Analysis by Route of Administration, 2017-2032
Figure 91: Europe Market Value Share (%) and BPS Analysis by Route of Administration, 2022-2032
Figure 92: Europe Market Y-o-Y Growth (%) Projections by Route of Administration, 2022-2032
Figure 93: Europe Market Value (US$ Mn) Analysis by Distribution Channel, 2017-2032
Figure 94: Europe Market Value Share (%) and BPS Analysis by Distribution Channel, 2022-2032
Figure 95: Europe Market Y-o-Y Growth (%) Projections by Distribution Channel, 2022-2032
Figure 96: Europe Market Attractiveness by Disease Indication, 2022-2032
Figure 97: Europe Market Attractiveness by Drug Class, 2022-2032
Figure 98: Europe Market Attractiveness by Route of Administration, 2022-2032
Figure 99: Europe Market Attractiveness by Distribution Channel, 2022-2032
Figure 100: Europe Market Attractiveness by Country, 2022-2032
Figure 101: East Asia Market Value (US$ Mn) by Disease Indication, 2022-2032
Figure 102: East Asia Market Value (US$ Mn) by Drug Class, 2022-2032
Figure 103: East Asia Market Value (US$ Mn) by Route of Administration, 2022-2032
Figure 104: East Asia Market Value (US$ Mn) by Distribution Channel, 2022-2032
Figure 105: East Asia Market Value (US$ Mn) by Country, 2022-2032
Figure 106: East Asia Market Value (US$ Mn) Analysis by Country, 2017-2032
Figure 107: East Asia Market Value Share (%) and BPS Analysis by Country, 2022-2032
Figure 108: East Asia Market Y-o-Y Growth (%) Projections by Country, 2022-2032
Figure 109: East Asia Market Value (US$ Mn) Analysis by Disease Indication, 2017-2032
Figure 110: East Asia Market Value Share (%) and BPS Analysis by Disease Indication, 2022-2032
Figure 111: East Asia Market Y-o-Y Growth (%) Projections by Disease Indication, 2022-2032
Figure 112: East Asia Market Value (US$ Mn) Analysis by Drug Class, 2017-2032
Figure 113: East Asia Market Value Share (%) and BPS Analysis by Drug Class, 2022-2032
Figure 114: East Asia Market Y-o-Y Growth (%) Projections by Drug Class, 2022-2032
Figure 115: East Asia Market Value (US$ Mn) Analysis by Route of Administration, 2017-2032
Figure 116: East Asia Market Value Share (%) and BPS Analysis by Route of Administration, 2022-2032
Figure 117: East Asia Market Y-o-Y Growth (%) Projections by Route of Administration, 2022-2032
Figure 118: East Asia Market Value (US$ Mn) Analysis by Distribution Channel, 2017-2032
Figure 119: East Asia Market Value Share (%) and BPS Analysis by Distribution Channel, 2022-2032
Figure 120: East Asia Market Y-o-Y Growth (%) Projections by Distribution Channel, 2022-2032
Figure 121: East Asia Market Attractiveness by Disease Indication, 2022-2032
Figure 122: East Asia Market Attractiveness by Drug Class, 2022-2032
Figure 123: East Asia Market Attractiveness by Route of Administration, 2022-2032
Figure 124: East Asia Market Attractiveness by Distribution Channel, 2022-2032
Figure 125: East Asia Market Attractiveness by Country, 2022-2032
Figure 126: South Asia & Pacific Market Value (US$ Mn) by Disease Indication, 2022-2032
Figure 127: South Asia & Pacific Market Value (US$ Mn) by Drug Class, 2022-2032
Figure 128: South Asia & Pacific Market Value (US$ Mn) by Route of Administration, 2022-2032
Figure 129: South Asia & Pacific Market Value (US$ Mn) by Distribution Channel, 2022-2032
Figure 130: South Asia & Pacific Market Value (US$ Mn) by Country, 2022-2032
Figure 131: South Asia & Pacific Market Value (US$ Mn) Analysis by Country, 2017-2032
Figure 132: South Asia & Pacific Market Value Share (%) and BPS Analysis by Country, 2022-2032
Figure 133: South Asia & Pacific Market Y-o-Y Growth (%) Projections by Country, 2022-2032
Figure 134: South Asia & Pacific Market Value (US$ Mn) Analysis by Disease Indication, 2017-2032
Figure 135: South Asia & Pacific Market Value Share (%) and BPS Analysis by Disease Indication, 2022-2032
Figure 136: South Asia & Pacific Market Y-o-Y Growth (%) Projections by Disease Indication, 2022-2032
Figure 137: South Asia & Pacific Market Value (US$ Mn) Analysis by Drug Class, 2017-2032
Figure 138: South Asia & Pacific Market Value Share (%) and BPS Analysis by Drug Class, 2022-2032
Figure 139: South Asia & Pacific Market Y-o-Y Growth (%) Projections by Drug Class, 2022-2032
Figure 140: South Asia & Pacific Market Value (US$ Mn) Analysis by Route of Administration, 2017-2032
Figure 141: South Asia & Pacific Market Value Share (%) and BPS Analysis by Route of Administration, 2022-2032
Figure 142: South Asia & Pacific Market Y-o-Y Growth (%) Projections by Route of Administration, 2022-2032
Figure 143: South Asia & Pacific Market Value (US$ Mn) Analysis by Distribution Channel, 2017-2032
Figure 144: South Asia & Pacific Market Value Share (%) and BPS Analysis by Distribution Channel, 2022-2032
Figure 145: South Asia & Pacific Market Y-o-Y Growth (%) Projections by Distribution Channel, 2022-2032
Figure 146: South Asia & Pacific Market Attractiveness by Disease Indication, 2022-2032
Figure 147: South Asia & Pacific Market Attractiveness by Drug Class, 2022-2032
Figure 148: South Asia & Pacific Market Attractiveness by Route of Administration, 2022-2032
Figure 149: South Asia & Pacific Market Attractiveness by Distribution Channel, 2022-2032
Figure 150: South Asia & Pacific Market Attractiveness by Country, 2022-2032
Figure 151: MEA Market Value (US$ Mn) by Disease Indication, 2022-2032
Figure 152: MEA Market Value (US$ Mn) by Drug Class, 2022-2032
Figure 153: MEA Market Value (US$ Mn) by Route of Administration, 2022-2032
Figure 154: MEA Market Value (US$ Mn) by Distribution Channel, 2022-2032
Figure 155: MEA Market Value (US$ Mn) by Country, 2022-2032
Figure 156: MEA Market Value (US$ Mn) Analysis by Country, 2017-2032
Figure 157: MEA Market Value Share (%) and BPS Analysis by Country, 2022-2032
Figure 158: MEA Market Y-o-Y Growth (%) Projections by Country, 2022-2032
Figure 159: MEA Market Value (US$ Mn) Analysis by Disease Indication, 2017-2032
Figure 160: MEA Market Value Share (%) and BPS Analysis by Disease Indication, 2022-2032
Figure 161: MEA Market Y-o-Y Growth (%) Projections by Disease Indication, 2022-2032
Figure 162: MEA Market Value (US$ Mn) Analysis by Drug Class, 2017-2032
Figure 163: MEA Market Value Share (%) and BPS Analysis by Drug Class, 2022-2032
Figure 164: MEA Market Y-o-Y Growth (%) Projections by Drug Class, 2022-2032
Figure 165: MEA Market Value (US$ Mn) Analysis by Route of Administration, 2017-2032
Figure 166: MEA Market Value Share (%) and BPS Analysis by Route of Administration, 2022-2032
Figure 167: MEA Market Y-o-Y Growth (%) Projections by Route of Administration, 2022-2032
Figure 168: MEA Market Value (US$ Mn) Analysis by Distribution Channel, 2017-2032
Figure 169: MEA Market Value Share (%) and BPS Analysis by Distribution Channel, 2022-2032
Figure 170: MEA Market Y-o-Y Growth (%) Projections by Distribution Channel, 2022-2032
Figure 171: MEA Market Attractiveness by Disease Indication, 2022-2032
Figure 172: MEA Market Attractiveness by Drug Class, 2022-2032
Figure 173: MEA Market Attractiveness by Route of Administration, 2022-2032
Figure 174: MEA Market Attractiveness by Distribution Channel, 2022-2032
Figure 175: MEA Market Attractiveness by Country, 2022-2032
Need specific information?
Request CustomizationExplore Healthcare Insights
View Reports